
Summary Statement
A broad collection of tables and charts covering health and safety in the U.S. construction industry, as well as considerable economic and training data.
2007
Section 6: The Value and Units of Residential Construction
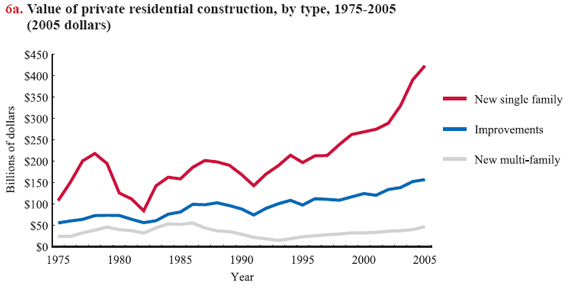
The value of residential construction reached $650.5 billion in 2005, accounting for 56.9% of the total as measured by Construction Spending, a construction statistics series published by the U.S. Census Bureau (see chart book page 5). Most of the value, or more than $642 billion, was from private residential construction. When the value of new private residential construction is broken down and traced over time, it becomes clear that the value of new single-family housing constructed each year has grown substantially, from $107.6 billion in 1975 to $423.4 billion in 2005 (chart 6a).
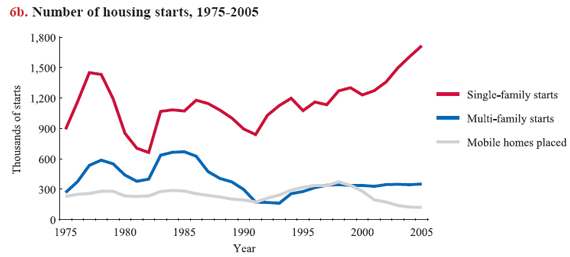
In addition to Construction Spending, the Census Bureau publishes New Residential Construction, which compiles data on the units of housing starts, permits, and completions. This data source provides the number of 1) new housing units authorized by building permits, 2) housing units authorized to be built, but not yet started, 3) housing units started (e.g., excavation dug), 4) housing units under construction, and 5) housing units completed (see Glossary).Along with the expansion of the value of residential construction, new single-family housing starts climbed from 892,000 in 1975 to 1.72 million in 2005 (chart 6b). The figures for building permits and starts are collected from different surveys. Changes to the status of buildings often take place after the permit has been issued, causing differences between the number of permits and the number of starts/completions.
Another Census Bureau series, Expenditures for Residential Improvements and Repairs, provides estimates of spending by property owners for maintenance, repairs, additions, alterations, and major replacements to residential properties (including, for instance, a guest house or landscaping) during the current quarter and for specified preceding quarters, with some comparative data for earlier years in the United States and its regions. The series, which is more inclusive than the Construction Spending, includes maintenance and repairs for public housing.
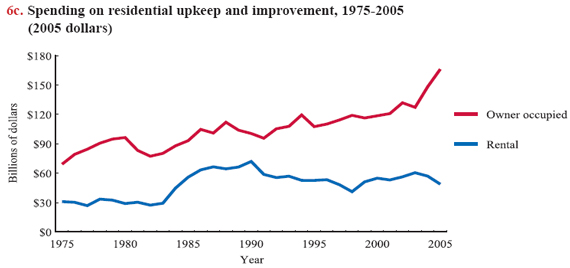
In 2005, about $215 billion was spent on owner-occupied and rental units, combined, for maintenance, repairs, additions, and alterations (or $166.3 billion and $48.7 billion, respectively, in 2005 dollars, chart 6c). Maintenance, repairs, additions, and alterations estimates are based on data collected from homeowner interviews for the U.S. Bureau of Labor Statistics (BLS) Consumer Expenditure Survey and rental unit owners, who are contacted by mail or telephone by the Census Bureau each quarter.
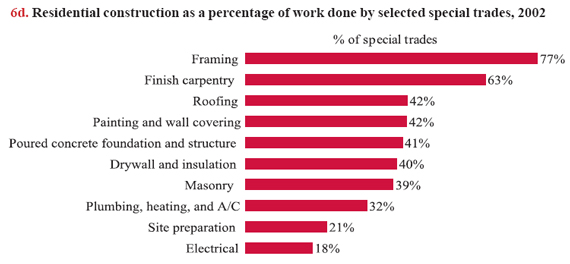
Neither the Construction Spending series nor the New Residential Construction series collects information on who produces residential buildings. Although the Economic Census reports number of establishments and employees for Residential Building Construction (NAICS 23611), typically, a large amount of work in the residential construction sector is subcontracted to the Specialty Trade Contractors (NAICS 238) sector. For example, nearly 80% of work done by Framing Contractors (NAICS 23813) was related to residential construction in 2002 (chart 6d). Since there are no linkages among these data series, the true total numbers of both establishments and employees in the residential construction sector remains unknown.
Download MS PowerPoint versions of Charts
Note:
Chart 6a - Private-sector residential construction totaled $626.8 billion in 2005.
Chart 6b - Total of 2.19 million housing units started in 2005; data cover private sector only.
Chart 6c - In 2005, spending on residential maintenance, repairs, additions, and alterations totaled about $215 billion.
Source:
Charts 6a, 6b, and 6c - The State of the Nation's Housing 2006, Joint Center for Housing Studies of Harvard University, Table A-2.
Chart 6d - U.S. Census Bureau, 2002 Economic Census, Construction-Industry Series, Value of Construction Work for Establishments by Type of Construction: 2002.
Back to Table of Contents