
NIOSH Worker Health Chartbook, 2004: Excerpts
Summary Statement
An excerpt from a chartbook that includes figures and tables describing the magnitude, distribution, and trends of the Nation’s occupational injuries, illnesses, and fatalities. The excerpt includes information on construction. A link to the entire PDF can be found here: http://www.cpwr.com/sites/default/files/publications/5th%20Edition%20Chart%20Book%20Final.pdf
Sep 2004
This document is in the public domain and may be freely copied or reprinted.
DisclaimerMention of any company or product does not constitute endorsement by the National Institute for Occupational Safety and Health (NIOSH). In addition, citations to Web sites external to NIOSH do not constitute NIOSH endorsement of the sponsoring organizations or their programs or products. Furthermore, NIOSH is not responsible for the content of these Web sites.
Ordering Information
To receive documents or other information about occupational safety and health topics, contact NIOSH at
NIOSH
Publications Dissemination
4676 Columbia Parkway
Cincinnati, OH 45226–1998
Telephone: 1–800–35–NIOSH (1–800–356–4674)
Fax: 513–533–8573
E-mail: pubstaft@cdc.gov
or visit the NIOSH Web site at www.cdc.gov/niosh
DHHS (NIOSH) Publication No. 2004–146
September 2004
Abstract
The Worker Health Chartbook, 2004 is a descriptive epidemiologic reference on occupational morbidity and mortality in the United States. The Chartbook includes more than 400 figures and tables describing the magnitude, distribution, and trends of the Nation’s occupational injuries, illnesses, and fatalities. This 2004 edition of the Worker Health Chartbook builds on the foundation established in the first edition, published in 2000. The Chartbook is intended as a resource for technical and nontechnical audiences, including agencies, organizations, employers, researchers, workers, and others who need to know about occupational injury and illness. This concise, chart-based document consolidates information from the network of monitoring systems that forms the cornerstone of injury and illness surveillance in the United States. The document is intended to fulfill the NIOSH strategic goals for preventing occupational injury and illness and to guide research and prevention efforts.
The Worker Health Chartbook, 2004 contains five chapters and three appendices. Chapter 1 describes the U.S. labor force and the health status of workers. Chapter 2 focuses on the demographic characteristics of workers (age, sex, occupation, industry, and case severity) and 33 types of occupational injuries and illnesses that affect them: amputations; anxiety, stress, and neurotic disorders; asbestosis; asthma; back, including spine and spinal cord; bloodborne infections and percutaneous exposures; bruises and contusions; byssinosis; carpal tunnel syndrome (CTS); coal workers’ pneumoconiosis (CWP); cuts and lacerations; dermatitis; disorders due to physical agents; disorders associated with repeated trauma; dust diseases of the lungs; fatal injuries; fractures; hearing loss; heat burns and scalds; hypersensitivity pneumonitis; lead toxicity; mesothelioma; musculoskeletal disorders; nonfatal injury; pneumoconioses; poisoning; respiratory diseases; respiratory conditions due to toxic agents; silicosis; skin diseases and disorders; sprains, strains, and tears; tendonitis; and tuberculosis. Chapter 2 also examines the magnitude, trends, and geographic distribution of these conditions. Chapter 3 focuses exclusively on agriculture, presenting data on fatal and nonfatal injuries among adults and children in agriculture and examining selected health conditions of farm workers. Chapter 4 concentrates on high-risk industries and occupations and reflects NIOSH research priorities in mining and construction. Chapter 5 addresses special populations, exploring available occupational injury and illness data on young workers, older workers, and Hispanic workers.
The three appendices complement the chapters with details about source data and programs. Appendix A describes the 21 survey and surveillance programs used by the contributors; it includes program contacts and reference citations for follow-up by users. Appendix B examines various aspects of data collection, analysis methods, and dissemination practices that limit the uses and inferences of data. Appendix C provides a bibliography of reference materials from the public domain, including data tables, report forms and documentation, government news releases, and research articles.
Chapter 4: High-Risk Industries and Occupations
The National Institute for Occupational Safety and Health (NIOSH) conducts comprehensive surveillance and research programs focused on selected high-risk industrial sectors such as agriculture, mining, and construction. Historically, workers in these industries have suffered the highest rates of fatal injury. The most recent data from the Bureau of Labor Statistics (BLS) Census of Fatal Occupational Injuries (CFOI) reveal that fatal injury rates in these high-risk industries range from 3.0 to 5.6 times the private industry rate of 4.2 per 100,000 workers (Figure 4–1) [BLS 2003a]. Except for mining, these high-risk industries also have elevated rates of nonfatal occupational injuries and illnesses, as shown by data from the BLS annual Survey of Occupational Injuries and Illnesses (SOII) (Figure 4–2).
This chapter provides data on nonfatal and fatal injuries and illnesses in the mining* and construction industries as well as associated occupations. Similar data for the agriculture industry are provided in Chapter 3.
*The Mine Safety and Health Administration (MSHA) provides BLS with data conforming to the Occupational Safety and Health Administration (OSHA) defi nitions for “mining operators in coal, metal, and nonmetal mining.” Readers should note the following within the BLS data: (1) mining includes oil and gas extraction, and (2) independent mining contractors are excluded from the coal, metal, and nonmetal mining industries.
Figure 4–1. Fatal occupational injury rates by industry division, 2002. Fatal occupational injury rates in 2002 were highest in mining (23.5 per 100,000 workers), agriculture, forestry, and fishing (22.7), construction (12.2), and transportation and public utilities (11.3). The rate for all private industry was 4.2 per 100,000 workers. (Source: BLS [2003a].)
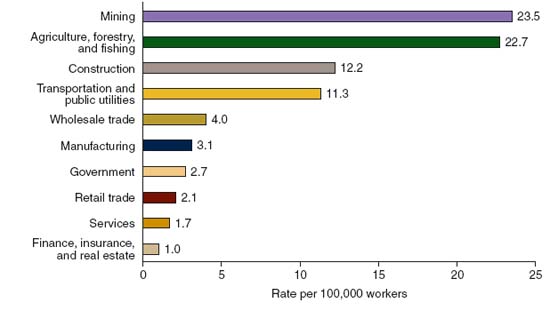
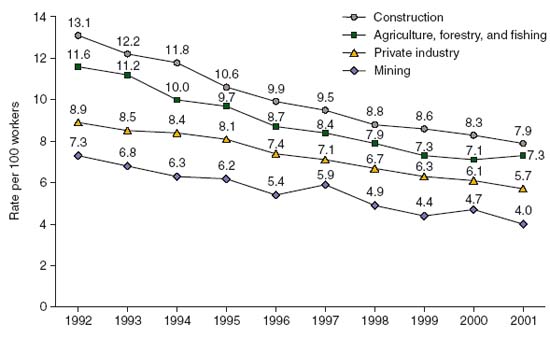
Figure 4–2. Incidence rates of nonfatal occupational injuries and illnesses in private industry and in high-risk industrial sectors, 1992–2001. During 1992–2001, the rates of total recordable injuries and illnesses in construction and agriculture exceeded those for all private industry by an average of 37% and 22%, respectively. However, the rates all decreased by similar percentages during this period—36% for all private industry, 40% for construction, and 37% for agriculture, forestry, and fishing. (Source: BLS [2002a].)
Construction Trades
This section provides data for tracking trends in fatal and nonfatal occupational injuries and illnesses among workers in the construction trade. An estimated 9.6 million persons were employed in the construction industry in 2001. Most of these workers were aged 25–54 (75.4%), male (90.3%), and white (90.8%) [BLS 2001].
Over the years, construction has ranked among industries with the highest rates of both fatal and nonfatal occupational injuries. BLS reported that the number and rate of fatal occupational injuries in the construction sector in 2001 were the highest recorded since the inception of CFOI (1,225 fatal occupational injuries with an incidence rate of 13.3 per 100,000 employed workers) [BLS 2002b]. For the same year, BLS reported that the construction industry experienced 481,400 nonfatal injuries and illnesses at a rate of 7.9 per 100 full-time workers in the industry [BLS 2002a].
Since the early 1990s, NIOSH has supported extensive extramural surveillance and research on the construction sector of private industry. CPWR – Center for Construction Research and Training (CPWR) is a principal partner of NIOSH in conducting these activities. Early efforts focused on surveillance data and surveillance research, including the preparation of the first of three chart books focusing on construction safety and health issues [Pollack and Chowdhury 2001].
The underlying data for Figures 4–20 through 4–52 come from a number of the BLS statistical programs, including the Current Population Survey (CPS), CFOI, and SOII. The CPS provides data for estimating the construction trade occupation denominators used for many of the rate estimates. The CPWR uses CFOI to characterize occupational fatalities and SOII to characterize nonfatal injuries and illnesses. Twelve construction trade occupations are the principal focus of this section:
- Brickmasons
- Carpenters
- Drywall installers
- Electricians
- Ironworkers
- Construction laborers
- Operating engineers
- Painters
- Plumbers
- Roofers
- Truck drivers
- Welders and cutters
Among the trades monitored by CPWR, the estimated distribution
of employed construction workers by trade ranged from 0.6% to
13.3% during 1992–2001. Carpenters made up the largest proportion
of construction workers (13.3%), followed by construction
laborers (8.8%) and electricians (5.9%) (Figure 4–20). The construction
workforce has been growing older: In 2001, the average
age for construction workers was 38.7 (1.5 years older than it was
in 1992). In addition, the median age increased from 35 to 39 during
this 10-year period. The aging of the construction workforce
is reflected in the distribution of fatal occupational injuries in this
group by age (Figure 4–21). From 1992 to 2001, the largest proportion
of fatal occupational injuries shifted from construction workers
aged 25–34 to those aged 35–44. For construction workers aged
25 or 34, the proportion with fatal injuries declined (from 27.8%
to 21.7%), whereas it increased for workers aged 65 or older (from
3.9% to 5.9%).
Fatal occupational injury rates in the construction trades for 2001
ranged from 6.0 per 100,000 full-time workers for drywall installers to 75.6 for ironworkers—more than a 12-fold difference (Figure
4–23). Falls to lower level accounted for the highest number of
fatal injuries among construction workers (410 or 4.3 per 100,000
full-time workers), and highway accidents accounted for the next
highest number (161 or 1.7 per 100,000 full-time workers) (Figure
4–25). This section includes figures that chart fatal injury rates for
each of the 12 construction trades that form our focus. For each
trade, the figure contrasts fatal occupational injury rates for all
construction workers during each year from 1992 through 2001
(Figures 4–29, 4–31, 4–33, 4–35, 4–37, 4–39, 4–41, 4–43, 4–45, 4–47,
4–49, and 4–51).
Rates of nonfatal injuries and illnesses involving days away from
work in the construction trades in 2001 ranged from 131.2 per
10,000 full-time workers for painters to 751.8 for ironworkers—
nearly a 6-fold difference (Figure 4–27). Injuries and illnesses associated
with ergonomic events or exposures made up 26.5% (49,237
of 185,662) of all nonfatal occupational injuries and illnesses involving
days away from work in the construction industry in 2001 [BLS
2003c]. The rate of bending, climbing, crawling, reaching, twisting
injuries in construction was 15 per 10,000 full-time workers—nearly
double the rate of 8 for all private industry that year (Figure 4–28).
This section includes figures that chart nonfatal injury and illness
rates for each of the 12 construction trades that form our focus. For
each trade, the figure contrasts nonfatal injury and illness rates for
all construction workers during each year from 1992 through 2001
(Figures 4–30, 4–32, 4–34, 4–36, 4–38, 4–40, 4–42, 4–44, 4–46, 4–48,
4–50, and 4–52).
Distribution of Construction Workers
by Trade
How were construction workers distributed by major
construction trade during 1992–2001?
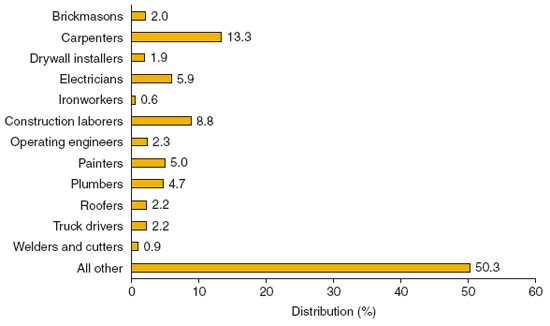
Figure 4–20. Average distribution of full-time construction
workers by trade, 1992–2001. Among the trades monitored
by CPWR, the estimated distribution of employed construction
workers by trade ranged from 0.6% to 13.3% during
1992–2001. Carpenters made up the largest proportion of
construction workers (13.3%), followed by construction laborers
(8.8%) and electricians (5.9%). (Notes: (1) Apprentices are
included for some trades when data were available. (2) All other
includes managers, professionals, supervisors, clerical workers,
sales personnel, and trades that each totaled less than 1% of
the industry. (3) Computations were based on a definition of
full-time work as 2,000 employee hours per year.) (Sources: BLS
[2002c]; Dong et al. [2004].)
Fatal Injuries
Age
How did the numbers and rates of fatal occupational
injuries in construction workers vary by age during 1992
and 2001?
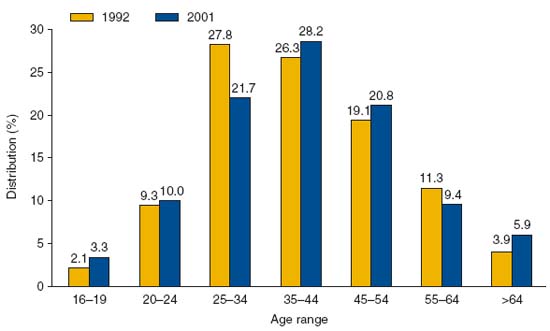
Figure 4–21. Distribution of fatal occupational injuries among
construction workers by age, 1992 and 2001. The construction
workforce has been growing older: In 2001, the average age
for construction workers was 38.7 (1.5 years older than it was
in 1992). In addition, the median age increased from 35 to
39 during this 10-year period. The aging of the construction
workforce is reflected in the distribution of fatal occupational
injuries in this group by age. From 1992 to 2001, the largest
proportion of fatal occupational injuries shifted from construction
workers aged 25–34 to those aged 35–44. For construction
workers aged 25 or 34, the proportion with fatal injuries
declined (from 27.8% to 21.7%), whereas it increased for
workers aged 65 or older (from 3.9% to 5.9%). (Sources: BLS
[2002b,c]; Dong et al. [2004].)
Race/Ethnicity
How did fatal occupational injury rates differ between
Hispanic and non-Hispanic construction workers during
1992–2001?
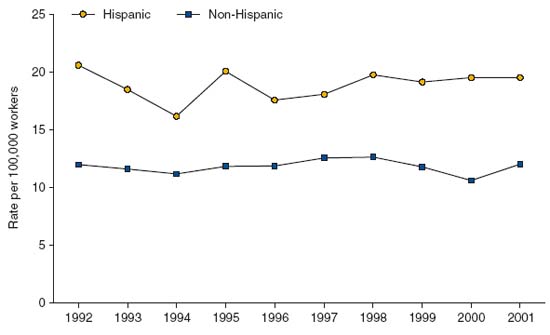
Figure 4–22. Fatal occupational injury rates among Hispanic
and non-Hispanic workers in the construction industry, 1992– 2001. Fatal occupational injuries
among Hispanic construction workers increased from 108 in 1992 to 281 in 2001. Since 1992,
Hispanic construction workers have had markedly higher fatal
occupational injury rates than their non-Hispanic counterparts.
In 2001 (the most recent year measured), the rate of
work-related deaths from construction injuries for Hispanics
was 19.5 per 100,000 full-time workers—62.5% higher than
the rate of 12.0 for non-Hispanic construction workers. During
1990–2001, Hispanic employment in the U.S. construction
industry increased greatly, from 649,800 in 1990 to 1.5 million
(or 15.6% of the construction workforce) in 2001. (Sources: BLS
[2002b,c]; Dong et al. [2004].)
Occupation
How did the fatal occupational injury rates differ by
construction trade in 2001?
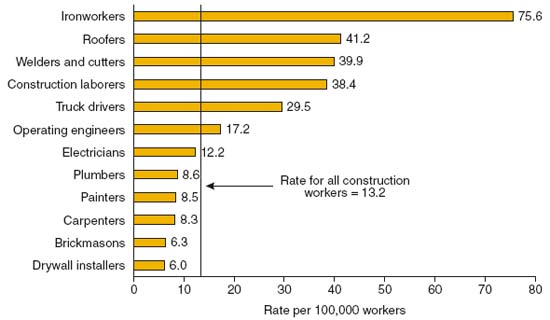
Figure 4–23. Fatal occupational injury rates by construction
trade, 2001. Fatal occupational injury rates in the construction
trades for 2001 ranged from 6.0 per 100,000 full-time workers
for drywall installers to 75.6 for ironworkers—more than a 12-
fold difference. (Sources: BLS [2002b,c]; Chowdhury and Dong
[2002].)
Establishment Size
How did fatal occupational injury rates vary by
employment size of establishment?
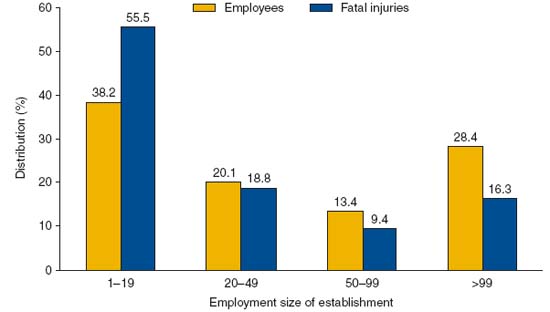
Figure 4–24. Distribution of construction workers and fatal
occupational injuries by employment size of establishment,
2001. In 2001, more than 80% of construction establishments had
fewer than 10 employees, and establishments with fewer than 20
employees employed only 38.2% of the wage-and-salary workforce.
However, fatal occupational injuries among these smaller establishments
accounted for more than 55.5% of fatal occupational
injuries in 2001. (Note: The calculation excludes the self-employed
workers and deaths reported without establishment-size information.)
(Sources: BLS [2002b,c]; Census [2003]; Dong et al. [2004].)
Event or Exposure
How did the numbers and rates of fatal occupational
injuries differ by fatal event in 2001?
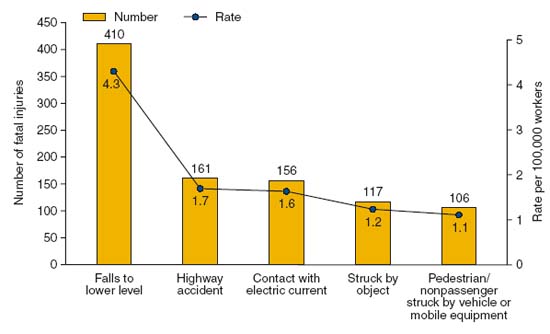
Figure 4–25. Numbers and rates of fatal occupational injuries
among construction workers by fatal event, 2001. In 2001, falls
to lower level accounted for the greatest number of fatal occupational
injuries among construction workers (410 fatalities or
4.3 per 100,000 full-time workers). Highway accidents accounted
for 161 deaths, a fatal injury rate of 1.7 per 100,000 full-time
workers. (Sources: BLS [2002b,c]; Dong et al. [2004].)
How did fatal fall rates differ by construction trade in
2001?
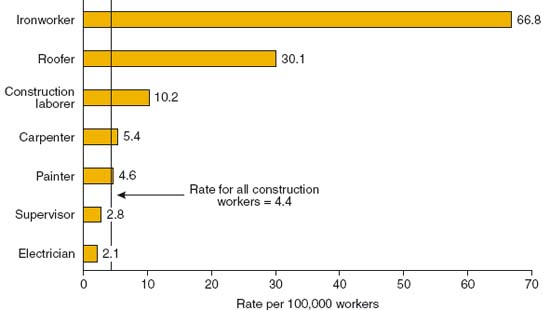
Figure 4–26. Fatal occupational fall rates by selected construction
trade, 2001. The 2001 rate for fatal occupational falls
among ironworkers was 66.8 per 100,000 workers—15 times
the average rate for all construction. For roofers, the fatal fall
rate was 30.1, or 7 times the average rate for all construction.
(Sources: BLS [2002b,c]; Dong et al. [2004].)
Nonfatal Injuries and Illnesses
Occupation
How did the rate of nonfatal occupational injury and
illness differ by construction trade in 2001?
Figure 4–27. Rate of nonfatal occupational injury and illness
cases with days away from work by construction trade, 2001. In
2001, the rate of nonfatal injuries and illnesses involving days
away from work ranged from 131.2 per 10,000 full-time workers
among painters to 751.8 for ironworkers—nearly a 6-fold
difference. (Sources: BLS [2002c; 2003b]; Pollack and Chowdhury
[2001]; Dong et al. [2004].)

Event or Exposure
How did rates of nonfatal occupational injury and illness
differ by type of ergonomic exposure in construction and
all private industry in 2001?
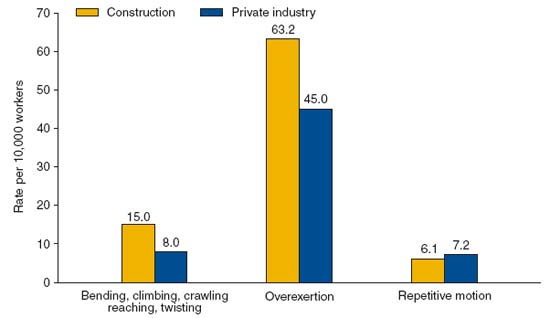
Figure 4–28. Rates of nonfatal occupational injury and illness
cases with days away from work in construction and private
industry by selected ergonomic events or exposures, 2001.
Injuries and illnesses associated with ergonomic events or
exposures made up 26.5% (49,237 of 185,662) of all nonfatal
occupational injuries and illnesses involving days away from
work in the construction industry in 2001. The rate of bending,
climbing, crawling, reaching, twisting injuries in construction
was 15 per 10,000 full-time workers—nearly double the
rate of 8 for all private industry that year. (Sources: BLS [2002c;
2003b,c]; Dong et al. [2004].)
Brickmasons
Fatal Injuries
How did the fatal occupational injury rates for
brickmasons compare with those for all construction
workers during 1992–2001?
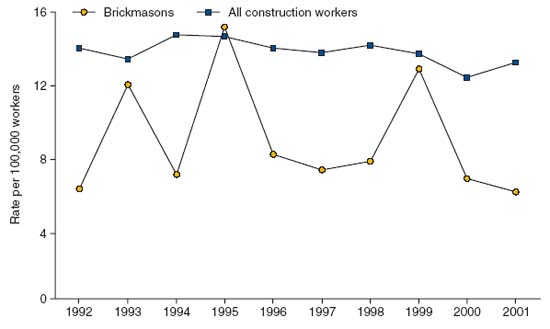
Figure 4–29. Fatal occupational injury rates for brickmasons
and all construction workers, 1992–2001. During 1992–2001,
fatal occupational injury rates for brickmasons were generally
lower than those for all construction workers. Rates for brickmasons
showed an up-and-down decreasing pattern, varying
from 6.3 per 100,000 full-time workers in 2001 to 15.2 in 1995.
BLS reported 145 fatal occupational injuries among brickmasons
during this 10-year period—an average of 14 fatalities per
year. (Sources: BLS [2002b,c]; Pollack and Chowdhury [2001];
Chowdhury and Dong [2003].)
Nonfatal Injuries and Illnesses
How did the rates of nonfatal occupational injuries and
illnesses for brickmasons compare with those for all
construction workers during 1992–2001?
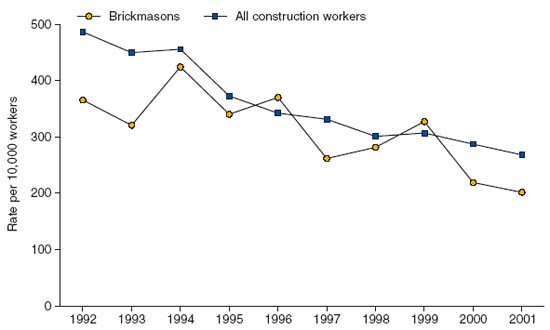
Figure 4–30. Rates of nonfatal occupational injuries and illnesses
involving days away from work for brickmasons and all
construction workers, 1992–2001. During 1992–2001, rates of
nonfatal occupational injuries and illnesses involving days away
from work were generally lower for brickmasons than for all
construction workers. Rates for brickmasons showed a downward
trend from a 424 per 10,000 full-time workers in 1994
to 201 in 2001. BLS reported 36,172 nonfatal occupational
injuries and illnesses among brickmasons during this 10-year
period—an average of 3,617 nonfatal cases per year. (Sources:
BLS [2002c; 2003b]; Pollack and Chowdhury [2001]; Dong et al.
[2004].)
Carpenters
Fatal Injuries
How did the fatal occupational injury rates for carpenters
compare with those for all construction workers during
1992–2001?
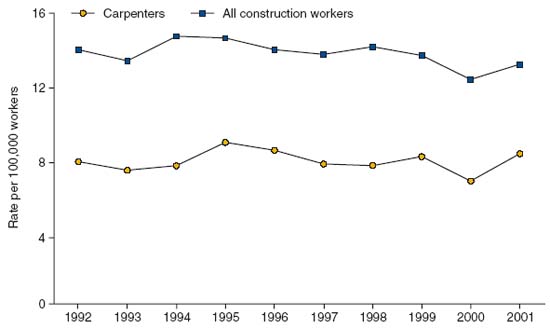
Figure 4–31. Fatal occupational injury rates for carpenters
and all construction workers, 1992–2001. During 1992–2001,
fatal occupational injury rates for carpenters were parallel to
and consistently lower than rates for all construction workers.
Rates for carpenters varied within a narrow range, from 8.9 per
100,000 full-time workers in 1995 to 6.7 in 2000. BLS reported
848 fatal occupational injuries among carpenters during this
10-year period—an average of 85 fatalities per year. (Sources:
BLS [2002b,c]; Pollack and Chowdhury [2001]; Chowdhury and
Dong [2003].)
Nonfatal Injuries and Illnesses
How did the rates of nonfatal occupational injuries
and illnesses for carpenters compare with those for all
construction workers during 1992–2001?
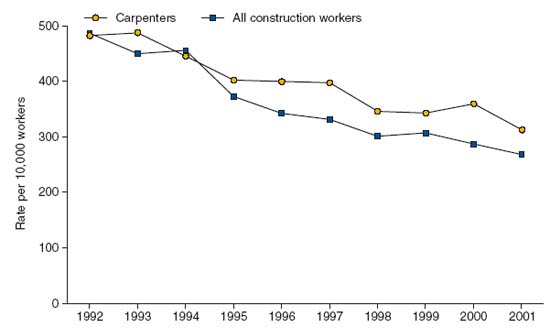
Figure 4–32. Rates of nonfatal occupational injuries and illnesses
involving days away from work for carpenters and all
construction workers, 1992–2001. During 1992–2001, rates of
nonfatal occupational injuries and illnesses involving days away
from work were slightly higher for carpenters than for all construction
workers, but they were comparable in overall magnitude.
Rates for carpenters showed a downward trend, from
489 per 10,000 full-time workers in 1993 to 313 in 2001. BLS
reported 285,705 nonfatal occupational injuries and illnesses
among carpenters during this 10-year period—an average of
28,570 nonfatal cases per year. (Sources: BLS [2002c; 2003b]; Pollack
and Chowdhury [2001]; Dong et al. [2004].)
Drywall Installers
Fatal Injuries
How did the fatal occupational injury rates for drywall
installers compare with those for all construction workers
during 1992–2001?
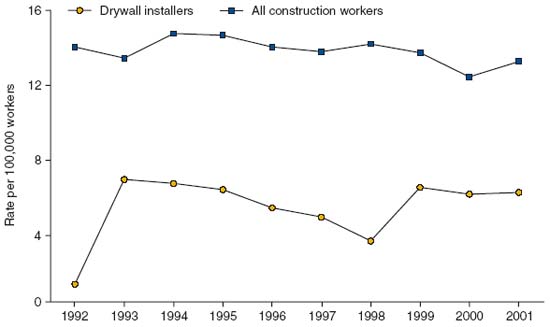
Figure 4–33. Fatal occupational injury rates for drywall installers
and all construction workers, 1992–2001. Fatal occupational
injury rates for drywall installers were consistently lower than
those for all construction workers during 1992–2001. Except
for 1992, the rates for drywall installers varied within a narrow
range, from 6.7 per 100,000 full-time workers in 1993 to 3.4
in 1998. BLS reported 80 fatal occupational injuries among
drywall installers during this 10-year period—an average of 10
fatalities per year. (Sources: BLS [2002b,c]; Pollack and Chowdhury
[2001]; Chowdhury and Dong [2003].)
Nonfatal Injuries and Illnesses
How did the rates of nonfatal occupational injuries and
illnesses for drywall installers compare with those for all
construction workers during 1992–2001?
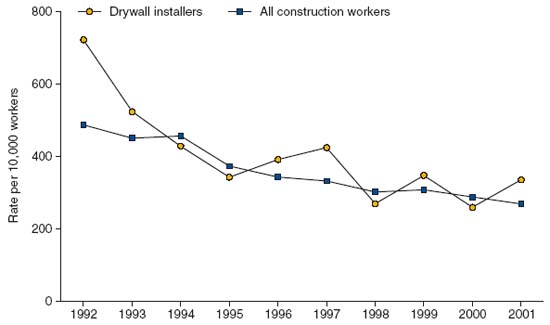
Figure 4–34. Rates of nonfatal occupational injuries and illnesses
involving days away from work for drywall installers and
all construction workers, 1992–2001. Rates of nonfatal occupational
injuries and illnesses involving days away from work for
drywall installers showed a downward trend during 1992–2001,
from 720 per 10,000 full-time workers in 1992 to 259 in 2000.
BLS reported 43,575 nonfatal occupational injuries and illnesses
among construction workers during this 10-year period—an
average of 4,357 nonfatal cases per year. (Sources: BLS [2002c;
2003b]; Pollack and Chowdhury [2001]; Dong et al. [2004].)
Electricians
Fatal Injuries
How did the fatal occupational injury rates for electricians
compare with those for all construction workers during
1992–2001?
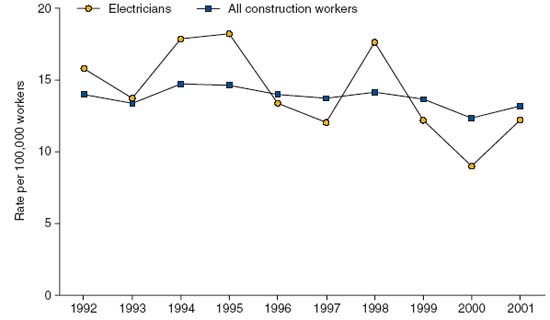
Figure 4–35. Fatal occupational injury rates for electricians
and all construction workers, 1992–2001. Fatal occupational
injury rates for electricians during 1992–2001 were comparable
with those for all construction workers. Rates for electricians
showed an up-and-down decreasing pattern, from 18.3 per
100,000 full-time workers in 1995 to 9.0 in 2000. BLS reported
671 fatal occupational injuries among electricians during this
10-year period—an average of 67 fatalities per year. (Sources:
BLS [2002b,c]; Pollack and Chowdhury [2001]; Chowdhury and
Dong [2003].)
Nonfatal Injuries and Illnesses
How did the rates of nonfatal occupational injuries and
illnesses for electricians compare with those for all
construction workers during 1992–2001?
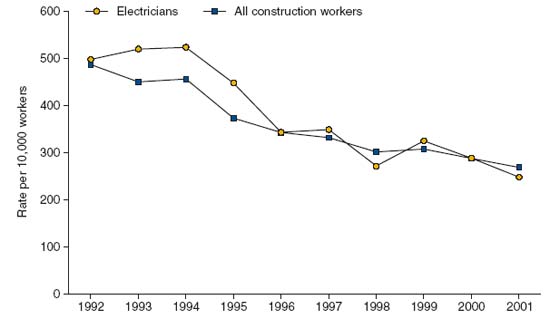
Figure 4–36. Rates of nonfatal occupational injuries and illnesses
involving days away from work for electricians and all
construction workers, 1992–2001. During 1992–2001, rates of
nonfatal occupational injuries and illnesses involving days away
from work for electricians were slightly higher but comparable
with those for all construction workers. Rates for electricians
showed a downward trend, from 522 per 10,000 full-time workers
in 1994 to 246 in 2001. BLS reported 142,811 nonfatal occupational
injuries and illnesses among electricians during this
10-year period—an average of 14,281 nonfatal cases per year.
(Sources: BLS [2002c; 2003b]; Pollack and Chowdhury [2001];
Dong et al. [2004].)
Ironworkers
Fatal Injuries
How did the fatal occupational injury rates for ironworkers
compare with those for all construction workers during
1992–2001?
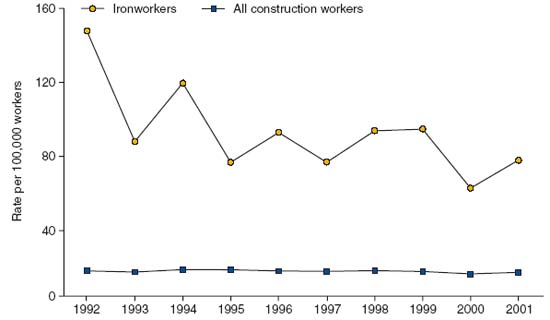
Figure 4–37. Fatal occupational injury rates for ironworkers
and all construction workers, 1992–2001. Fatal occupational
injury rates for ironworkers during 1992–2001 were substantially
greater (4.8–10.5 times greater) than those for all construction
workers. Rates for ironworkers showed a downward
trend, from 147.6 per 100,000 full-time workers in 1992 to 60.0
in 2000. BLS reported 424 fatal occupational injuries among
ironworkers during this 10-year period—an average of 42 fatalities
per year. (Sources: BLS [2002b,c]; Pollack and Chowdhury
[2001]; Chowdhury and Dong [2003].)
Nonfatal Injuries and Illnesses
How did the rates of nonfatal occupational injuries and
illnesses for ironworkers compare with those for all
construction workers during 1992–2001?
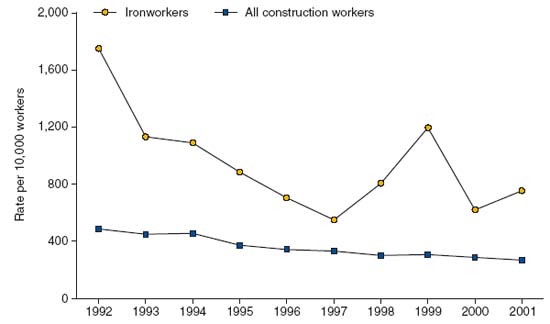
Figure 4–38. Rates of nonfatal occupational injuries and illnesses
involving days away from work for ironworkers and
all construction workers, 1992–2001. Rates of nonfatal occupational
injuries and illnesses involving days away from work
for ironworkers during 1992–2001 were consistently greater
(1.7–3.9 times greater) than those for all construction workers.
Rates for ironworkers showed a downward trend, from
1,750 per 10,000 full-time workers in 1992 to 550 in 1997. The
2001 rate of 752 per 10,000 full-time workers represents a 57%
decrease from the 1992 rate of nonfatal injury and illness for
ironworkers. BLS reported 40,173 cases of nonfatal occupational
injuries and illnesses among ironworkers during this
10-year period—an average of 4,017 nonfatal cases per year.
(Sources: BLS [2002c; 2003b]; Pollack and Chowdhury [2001];
Dong et al. [2004].)
Construction Laborers
Fatal Injuries
How did the fatal occupational injury rates for
construction laborers compare with those for all
construction workers during 1992–2001?
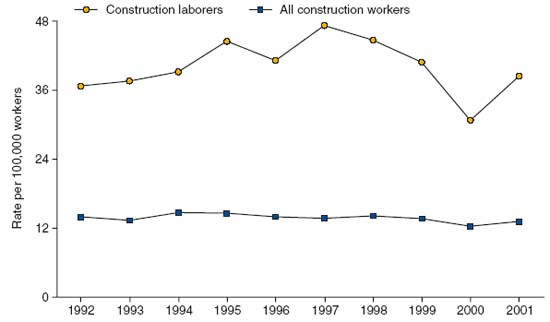
Figure 4–39. Fatal occupational injury rates for construction
laborers and all construction workers, 1992–2001. Fatal occupational
injury rates for construction laborers during 1992–2001
were substantially greater (2.5–3.4 times greater) than those
for all construction workers. Between 1992 and 1997, rates
increased from 36.8 per 100,000 full-time workers to 47.3, then
decreased to a low of 30.8 in 2000. BLS reported 2,873 fatal
occupational injuries among construction laborers during this
10-year period—an average of 287 fatalities per year. (Sources:
BLS [2002b,c]; Pollack and Chowdhury [2001]; Chowdhury and
Dong [2003].)
Nonfatal Injuries and Illnesses
How did the rates of nonfatal occupational injuries and
illnesses for construction laborers compare with those for
all construction workers during 1992–2001?
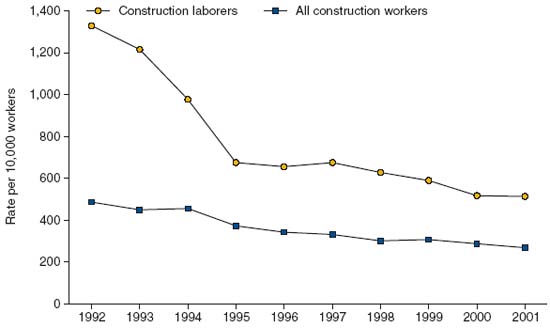
Figure 4–40. Rates of nonfatal occupational injuries and illnesses
involving days away from work for construction laborers
and all construction workers, 1992–2001. Rates of nonfatal
occupational injuries and illnesses involving days away
from work for construction laborers during 1992–2001 were
consistently greater (1.8–2.7 times greater) than those for all
construction workers. Rates for construction laborers showed
a downward trend, from 1,330 per 10,000 full-time workers in
1992 to 512 in 2001. The 2001 rate represents a 62% decrease
from the 1992 rate. BLS reported 467,258 nonfatal occupational
injuries and illnesses among construction laborers during
this 10-year period—an average of 46,726 nonfatal cases
per year. (Sources: BLS [2002c; 2003b]; Pollack and Chowdhury
[2001]; Dong et al. [2004].)
Operating Engineers
Fatal Injuries
How did the fatal occupational injury rates for operating
engineers compare with those for all construction workers
during 1992–2001?
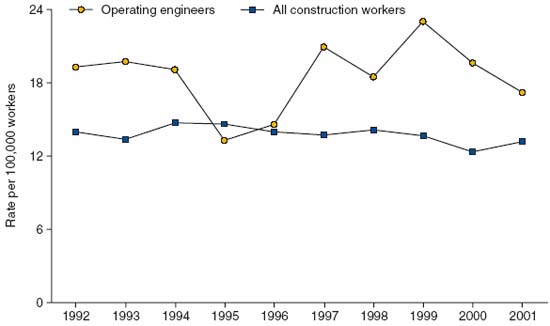
Figure 4–41. Fatal occupational injury rates for operating
engineers and all construction workers, 1992–2001. Fatal occupational
injury rates for operating engineers during 1992–2001
exceeded those for all construction workers except during 1995.
Rates for operating engineers showed an increasing trend, varying
between 12.2 per 100,000 full-time workers and 23.0 (compared
with 12.4 and 14.8 per 100,000 full-time workers for all
construction workers). BLS reported 342 fatal occupational injuries
among operating engineers during this 10-year period—an
average of 34 fatalities per year. (Sources: BLS [2002b,c]; Pollack
and Chowdhury [2001]; Chowdhury and Dong [2003].)
Nonfatal Injuries and Illnesses
How did the rates of nonfatal occupational injuries and
illnesses for operating engineers compare with those for
all construction workers during 1992–2001?
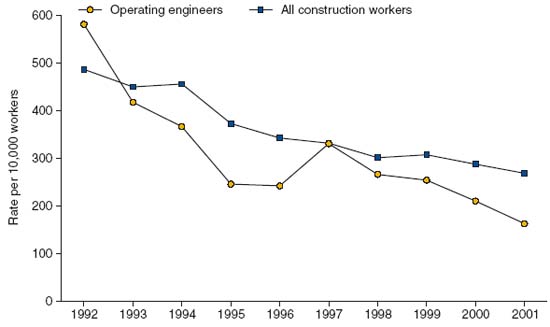
Figure 4–42. Rates of nonfatal occupational injuries and illnesses
involving days away from work for operating engineers
and all construction workers, 1992–2001. During 1992–2001,
rates of nonfatal occupational injuries and illnesses involving
days away from work were lower for operating engineers than
for all construction workers, but both rates were comparable
in overall magnitude. Rates for operating engineers showed a
downward trend, from 581 per 10,000 full-time workers in 1992
to 162 in 2001. BLS reported 37,431 nonfatal occupational
injuries and illnesses among operating engineers during this
10-year period—an average of 3,743 nonfatal cases per year.
(Sources: BLS [2002c; 2003b]; Pollack and Chowdhury [2001];
Dong et al. [2004].)
Painters
Fatal Injuries
How did the fatal occupational injury rates for painters
compare with those for all construction workers during
1992–2001?
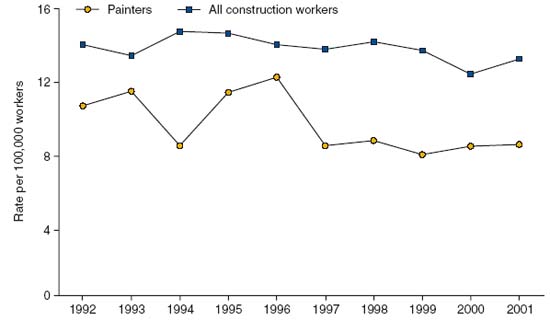
Figure 4–43. Fatal occupational injury rates for painters and
all construction workers, 1992–2001. During 1992–2001, fatal
occupational injury rates for painters were lower than those
for all construction workers. Rates for painters showed an upand-
down decreasing pattern, varying from 12.2 per 100,000
full-time workers in 1996 to 7.9 in 1999. BLS reported 384 fatal
occupational injuries among painters during this 10-year period—
an average of 38 fatalities per year. (Sources: BLS [2002b,c];
Pollack and Chowdhury [2001]; Chowdhury and Dong [2003].)
Nonfatal Injuries and Illnesses
How did the rates of nonfatal occupational injuries
and illnesses for painters compare with those for all
construction workers during 1992–2001?
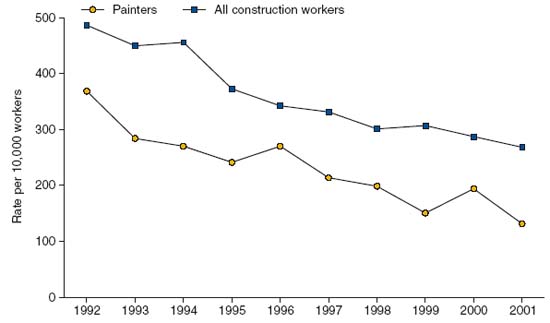
Figure 4–44. Rates of nonfatal occupational injuries and
illnesses involving days away from work for painters and all
construction workers, 1992–2001. During 1992–2001, rates of
nonfatal occupational injuries and illnesses involving days away
from work for painters were consistently lower (0.5 to 0.8 times
lower) than those for all construction workers. Rates showed
a downward trend, from 368 per 10,000 full-time workers in
1992 to 131 in 2001. The 2001 rate of 131 per 10,000 full-time
workers represents a 64% decrease in rates since 1992. BLS
reported 50,264 nonfatal occupational injuries and illnesses
among painters during this 10-year period—an average of
5,026 nonfatal cases per year. (Sources: BLS [2002c; 2003b]; Pollack
and Chowdhury [2001]; Dong et al. [2004].)
Plumbers
Fatal Injuries
How did the fatal occupational injury rates for plumbers
compare with those for all construction workers during
1992–2001?
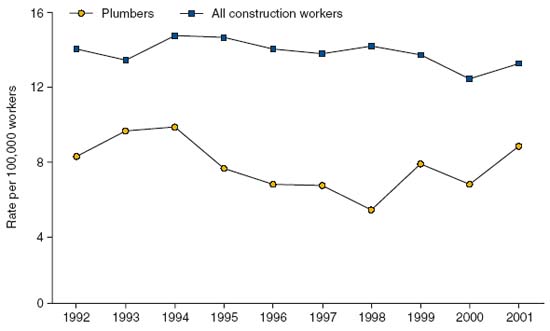
Figure 4–45. Fatal occupational injury rates for plumbers
and all construction workers, 1992–2001. During 1992–2001,
fatal occupational injury rates for plumbers were lower than
those for all construction workers. Rates for plumbers showed
a downward trend, from 9.7 per 100,000 full-time workers in
1994 to 5.1 in 1998. BLS reported 284 fatal occupational injuries
among plumbers during this 10-year period—an average of
28 fatalities per year. (Sources: BLS [2002b,c]; Pollack and Chowdhury
[2001]; Chowdhury and Dong [2003].)
Nonfatal Injuries and Illnesses
How did the rates of nonfatal occupational injuries
and illnesses for plumbers compare with those for all
construction workers during 1992–2001?
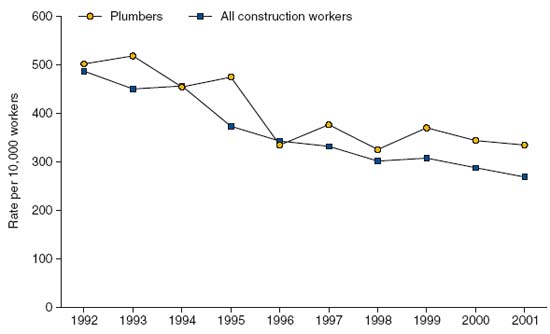
Figure 4–46. Rates of nonfatal occupational injuries and illnesses
involving days away from work for plumbers and all
construction workers, 1992–2001. During 1992–2001, rates of
nonfatal occupational injuries and illnesses involving days away
from work for plumbers were slightly higher than those for all
construction workers, though they were comparable in overall
magnitude. Rates for plumbers showed a downward trend,
from 504 per 10,000 full-time workers in 1992 to 326 in 1998.
BLS reported 113,679 nonfatal occupational injuries and illnesses
among plumbers during this 10-year period—an average
of 11,370 nonfatal cases per year. (Sources: BLS [2002c; 2003b];
Pollack and Chowdhury [2001]; Dong et al. [2004].)
Roofers
Fatal Injuries
How did the fatal occupational injury rates for roofers
compare with those for all construction workers during
1992–2001?
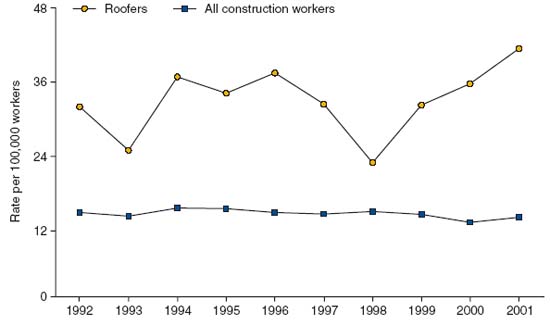
Figure 4–47. Fatal occupational injury rates for roofers and
all construction workers, 1992–2001. Fatal occupational injury
rates for roofers were 1.6–2.8 times greater than those for all
construction workers during 1992–2001. Rates followed an upand-
down increasing pattern, with a high of 41.2 per 100,000
full-time workers in 2001 and a low of 22.3 in 1998. BLS reported
569 fatal occupational injuries among roofers during this
10-year period—an average of 57 fatalities per year. (Sources:
BLS [2002b,c]; Pollack and Chowdhury [2001]; Chowdhury and
Dong [2003].)
Nonfatal Injuries and Illnesses
How did the rates of nonfatal occupational injuries
and illnesses for roofers compare with those for all
construction workers during 1992–2001?
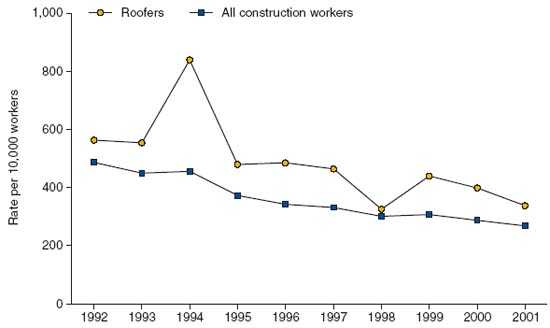
Figure 4–48. Rates of nonfatal occupational injuries and
illnesses involving days away from work for roofers and all
construction workers, 1992–2001. During 1992–2001, rates
of nonfatal occupational injuries and illnesses involving days
away from work were consistently greater for roofers (1.1–1.8
times greater) than for all construction workers. Rates for roofers
showed a downward trend, from 838 per 10,000 full-time
workers in 1994 to 325 in 1998. BLS reported 61,539 nonfatal
occupational injuries and illnesses among roofers during this
10-year period—an average of 6,154 nonfatal cases per year.
(Sources: BLS [2002c; 2003b]; Pollack and Chowdhury [2001];
Dong et al. [2004].)
Truck Drivers
Fatal Injuries
How did the fatal occupational injury rates for truck
drivers compare with those for all construction workers
during 1992–2001?
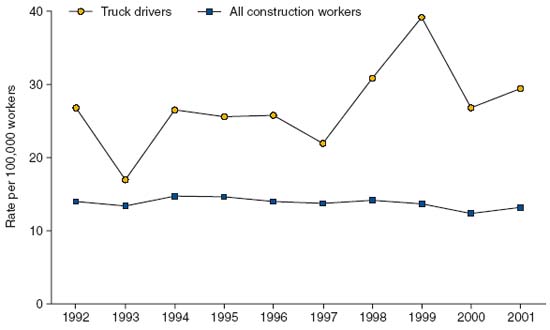
Figure 4–49. Fatal occupational injury rates for truck drivers
and all construction workers, 1992–2001. Fatal occupational
injury rates for truck drivers were 1.3–2.9 times greater than
those for all construction workers during 1992–2001. Rates
for truck drivers showed a down-and-up pattern, with a low of
17.0 per 100,000 full-time workers in 1993 and a high of 39.2
in 1999. BLS reported 479 fatal occupational injuries among
truck drivers during this 10-year period—an average of 48 fatalities
per year. (Sources: BLS [2002b,c]; Pollack and Chowdhury
[2001]; Chowdhury and Dong [2003].)
Nonfatal Injuries and Illnesses
How did the rates of nonfatal occupational injuries and
illnesses for truck drivers compare with those for all
construction workers during 1992–2001?
Figure 4–50. Rates of nonfatal occupational injuries and illnesses
involving days away from work for truck drivers and all
construction workers, 1992–2001. During 1992–2001, rates of
nonfatal occupational injuries and illnesses involving days away
from work for truck drivers usually exceeded rates for all construction
workers. Rates for truck drivers varied from 533 per
10,000 full-time workers in 1992 to 359 in 1998. BLS reported
57,999 nonfatal occupational injuries and illnesses among
truck drivers during this 10-year period—an average of 5,800
nonfatal cases per year. (Sources: BLS [2002c; 2003b]; Pollack and
Chowdhury [2001]; Dong et al. [2004].)

Welders and Cutters
Fatal Injuries
How did the fatal occupational injury rates for welders
and cutters compare with those for all construction
workers during 1992–2001?
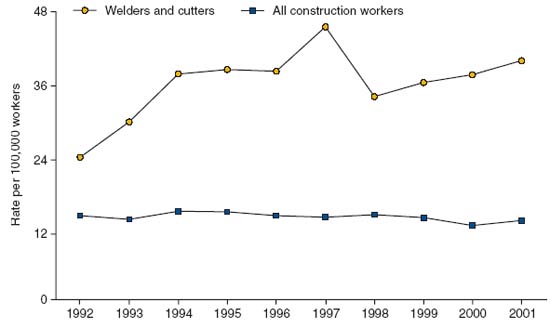
Figure 4–51. Fatal occupational injury rates for welders and cutters
and all construction workers, 1992–2001. Fatal occupational
injury rates for welders and cutters were 1.7–3.3 times greater
than those for all construction workers during 1992–2001. Rates
for welders and cutters showed an increasing trend, from 23.7
per 100,000 full-time workers in 1992 to 45.4 in 1997. The 2001
fatal injury rate of 39.9 per 100,000 full-time workers was 3 times
the rate for all construction workers and represented a 68%
increase from 1992. BLS reported 257 fatal occupational injuries
among welders and cutters during this 10-year period—an average
of 26 fatalities per year. (Sources: BLS [2002b,c]; Pollack and
Chowdhury [2001]; Chowdhury and Dong [2003].)
Nonfatal Injuries and Illnesses
How did the rates of nonfatal occupational injuries and
illnesses for welders and cutters compare with those for
all construction workers during 1992–2001?
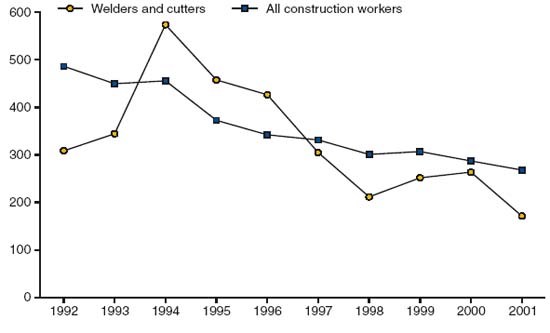
Figure 4–52. Rates of nonfatal occupational injuries and illnesses
involving days away from work for welders and cutters
and all construction workers, 1992–2001. During 1992–2001,
rates of nonfatal occupational injuries and illnesses involving
days away from work for welders and cutters show an overall
decreasing trend, ranging from 573 per 10,000 full-time
workers in 1994 to 171 in 2001. BLS reported 21,940 nonfatal
occupational injuries and illnesses among welders and cutters
during this 10-year period—an average of 2,194 nonfatal cases
per year. (Sources: BLS [2002c; 2003b]; Pollack and Chowdhury
[2001]; Dong et al. [2004].)
References
BLS [2001]. Current population survey. Washington, DC: U.S.
Department of Labor, Bureau of Labor Statistics. [www.bls.gov/cps/] and [www.bls.census.gov/cps]
BLS [2002a]. Survey of occupational injuries and illnesses. Washington,
D.C.: U.S. Department of Labor, Bureau of Labor Statistics,
Safety and Health Statistics Program. Nonfatal (OSHA recordable)
injuries and illnesses. Industry incidence rates and counts.
[www.bls.gov/iif/oshsum.htm]
BLS [2002b]. Census of fatal occupational injuries. Fatal injuries.
Washington, DC: U.S. Department of Labor, Bureau of Labor
Statistics, Safety and Health Statistics Program. [www.bls.gov/iif/oshcfoi1.htm]
BLS [2002c]. Current population survey. Washington, DC: U.S.
Department of Labor, Bureau of Labor Statistics. [www.bls.gov/cps/] and [www.bls.census.gov/cps]
BLS [2003a]. Census of fatal occupational injuries. Fatal injuries.
Washington, DC: U.S. Department of Labor, Bureau of Labor
Statistics, Safety and Health Statistics Program. [www.bls.gov/iif/oshcfoi1.htm]
BLS [2003b]. Survey of occupational injuries and illnesses. Nonfatal
(OSHA recordable) injuries and illnesses. Case and demographic
characteristics. Washington, DC: U.S. Department of Labor,
Bureau of Labor Statistics, Safety and Health Statistics Program.
[www.bls.gov/iif/oshcdnew.htm]
BLS [2003c]. Survey of occupational injuries and illnesses. Nonfatal
(OSHA recordable) injuries and illnesses. Number of nonfatal
occupational injuries and illnesses with days away from work
involving musculoskeletal disorders by selected worker and case
characteristics, 2001. Washington, DC: U.S. Department of Labor,
Bureau of Labor Statistics, Safety and Health Statistics Program.
[www.bls.gov/iif/oshwc/osh/case/ostb1154.pdf]
Census [2003]. County business patterns—United States: 2001.
Washington, DC: U.S. Department of Commerce, Economics and
Statistics Administration, U.S. Census Bureau. [www.census.gov/prod/2003pubs/01cbp/cbp01-1.pdf]
Chowdhury RT, Dong X [2003]. Analysis of census of fatal occupational
injuries (CFOI) data, 1992–2001. Silver Spring, MD: CPWR – Center for Construction Research and Training. Unpublished.
Dong X, Men R, Hu H, Chauhan J, Gittleman J [2004]. Trends in
work-related deaths and injury rates among U.S. construction workers,
1992–2001. Washington, DC: CPWR – Center for Construction Research and Training (CPWR). Unpublished.
MSHA [2002]. Quarterly employment and coal production,
accidents/injuries/illnesses reported to MSHA under 30 CFR Part
50, 1991–2000. Denver, CO: U.S. Department of Labor, Mine Safety
and Health Administration, Office of Injury and Employment Information.
[www.msha.gov/STATS/PART50/p50y2k/p50y2k.HTM]
MSHA [2003]. Quarterly employment and coal production, accidents/
injuries/illnesses reported to MSHA under 30 CFR Part 50, 1991–
2000. Denver, CO: U.S. Department of Labor, Mine Safety and Health Administration, Office of Injury and
Employment Information. [www.msha.gov/STATS/PART50/p50y2k/p50y2k.HTM]
NCHS [2002]. Multiple-cause-of-death public-use data files. Hyattsville,
MD: U.S. Department of Health and Human Services, Centers for
Disease Control and Prevention, National Center for Health Statistics.
[www.cdc.gov/nchs/products/elec_prods/subject/mortmcd.htm]
NIOSH [2002]. National surveillance system for pneumoconiosis
mortality. Morgantown, WV: U.S. Department of Health and
Human Services. Centers for Disease Control and Prevention,
National Institute for Occupational Safety and Health. Database.
NIOSH [2003a]. Surveillance, statistics, and research support activity
(SSRSA). Pittsburgh, PA: U.S. Department of Health and Human
Services, Centers for Disease Control and Prevention, National
Institute for Occupational Safety and Health. [www.cdc.gov/niosh/mining/]
NIOSH [2003b]. Mining surveillance and statistical support activity
(MSSSA). Spokane, WA: U.S. Department of Health and Human
Services, Centers for Disease Control and Prevention, National
Institute for Occupational Safety and Health. [www.cdc.gov/niosh/mining/]
NIOSH [2003c]. Analysis of 33 volunteer sand and gravel operations,
1999–2000. Pittsburgh, PA: Department of Health and Human
Services, Centers for Disease Control and Prevention, National Institute
for Occupational Safety and Health. Unpublished.
Pollack ES, Chowdhury RT [2001]. Trends in work-related deaths
and injury rates among U.S. construction workers, 1992–1998. Washington,
DC: CPWR – Center for Construction Research and Training.
Royster LH, Thomas WG [1979]. Age effect hearing levels for a
white nonindustrial noise exposed population (ninep) and their use
in evaluating industrial hearing conservation programs. Am Ind Hyg
Assoc J 40:504–511.
Royster LH, Driscoll DP, Thomas WG, Royster JD [1980]. Age effect
hearing levels for a black nonindustrial noise exposed population
(ninep). Am Ind Hyg Assoc J 41:113–119.