
Summary Statement
A broad collection of tables and charts covering health and safety in the U.S. construction industry, as well as considerable economic and training data.
2007
Section 36: Leading Causes of Fatal and Nonfatal Injuries in Construction
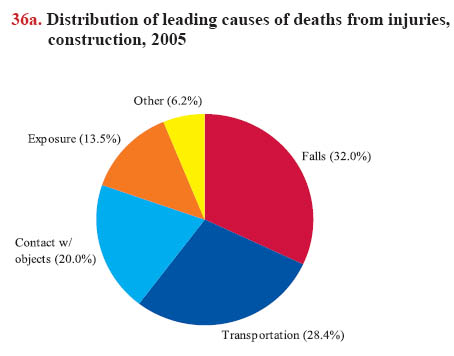
In 2005, falls were the leading cause of death in construction, accounting for about one-third of all work-related deaths, followed by transportation incidents and contact with objects (chart 36a).
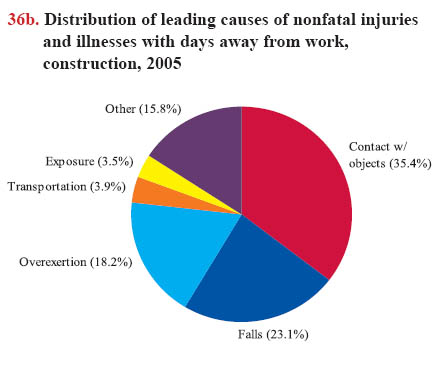
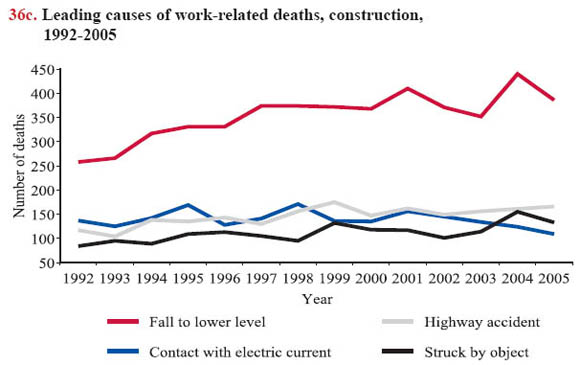
The most common types of injuries resulting in deaths differ from the leading causes of serious nonfatal injuries. Falls ranked as the number one cause of deaths, but as the second-leading cause of nonfatal injuries. Transportation incidents caused more than one-fourth of deaths, but accounted for less than 4% of nonfatal injuries (chart 36b). Overexertion, which does not normally cause death, is the third-leading cause of nonfatal injuries.From 1992 through 2005, the highest ranking causes of work-related deaths were falls to a lower level (most frequent cause), contact with electric current (a subcategory of exposure to harmful substances or environments), highway incidents (a subcategory of transportation), and being struck by an object (a subcategory of contact with objects and equipment; chart 36c).
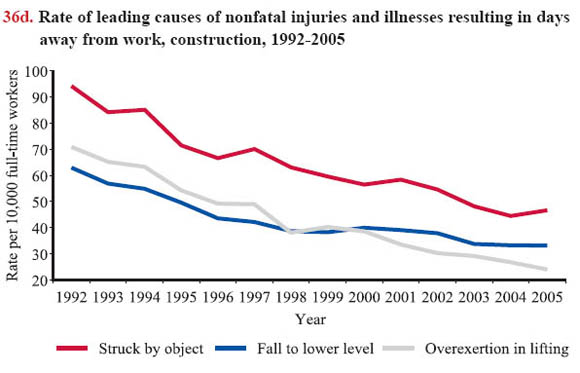
Being struck by an object is the leading cause of nonfatal injuries that resulted in days away from work (chart 36d). The rate has dropped steadily from 94.2 to 46.7 per 10,000 fulltime workers between 1992 and 2005, consistent with overall injury trends in construction (see chart book page 32).
In this chart book, lost-workday cases include only those involving days away from work, not cases with only restricted work activity. The U.S. Bureau of Labor Statistics data on nonfatal injuries and illnesses report only the private sector and exclude the self-employed. Also, the numbers for construction essentially show injuries. For example, illnesses were about 2.5% of the total injury and illness cases in construction in 2005, which do not substantially affect injury rates.1 Most of the serious work-related illnesses in construction, such as asbestosis or cancers, take years to develop and thus would not be reported as cases resulting in absences from work. So, the charts presented here are essentially about injuries.
The data on deaths are derived from the 2005 Census of Fatal Occupational Injuries (CFOI) and nonfatal-injury data are from the 2005 Survey of Occupational Injuries and Illnesses (SOII). Due to the changes in these data sources, the statistics across years may not be directly comparable (see chart book page 32).
Download MS PowerPoint versions of Charts
1. U.S. Bureau of Labor Statistics, Workplace Injuries and Illnesses in 2005, http://www.stats.bls.gov/iif/oshwc/osh/os/osnr0025.pdf (Accessed November 2007).
Note:
Chart 36a - "Transportation" refers to injuries involving vehicles – including the capsizing of a crane that is being moved - and not necessarily on the work site. "Contact with objects" includes being struck by an object, struck against an object, caught in or compressed by equipment or objects, and caught in or crushed by collapsing materials. "Exposure" includes exposure to electric current, to temperature extremes, to air pressure changes, and to caustic, noxious, or allergenic substances. "Other" includes fires and explosions; violence, including self-inflicted injuries, assaults, and assaults by animals; and bodily reactions, such as when startled. Total: 1,243 deaths from injuries in construction in 2005.
Chart 36b - Numbers do not add up to 100% because of rounding. "Other" includes fires and explosions; assaults and violent acts; and other events or exposures. Total: 157,070 cases involving days away from work in construction in 2005. Data covers the private sector only and excludes the self-employed. Lost-workday cases include only those involving days away from work, not cases with only restricted work activity. Illnesses are about 2.5% of the total.
Source:
Charts 36a and 36c - U.S. Bureau of Labor Statistics, 1992-2005 Census of Fatal Occupational Injuries. Calculations by CPWR Data Center.
Charts 36b and 36d - U.S. Bureau of Labor Statistics, 1992-2005 Survey of Occupational Injuries and Illnesses, Tables R64 and R75, http://www.bls.gov/iif/oshcdnew.htm (Accessed November 2007).
Back to Table of Contents