
Summary Statement
A broad collection of tables and charts covering health and safety in the U.S. construction industry, as well as considerable economic and training data.
2007
Section 28: Educational Attainment in Construction and Other Industries
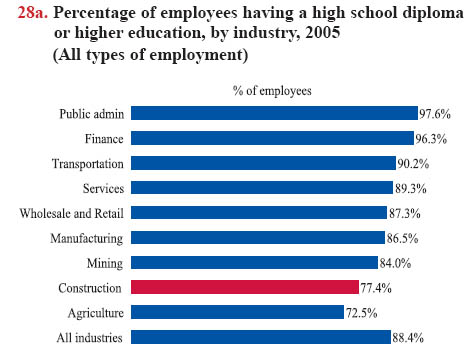
Educational attainment of employees in construction is lower when compared with the level of educational attainment of all other industries combined; this is true also when construction is compared with other goods-producing industries, such as manufacturing and mining (chart 28a). In 2005, about 35% of construction workers had some post-secondary education, while 59% of the total workforce did.1 These estimates are based on the Current Population Survey (CPS), in which respondents are asked about the highest level of education they have reached, coding each level of formal education attained.
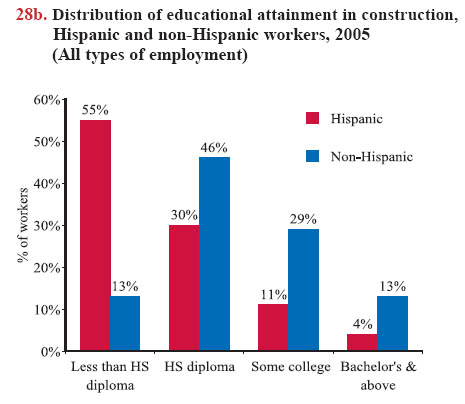
The lower level of formal education for construction is due, at least partly, to its high proportion of production, or bluecollar workers, who tend to have lower educational attainment in all industries. In 2005, 27% of construction production workers had less than a high school diploma, 45% had a high school diploma, and 28% had some post-secondary education. By contrast, in other industries, 19% of production workers had less than a high school diploma, 47% had a high school diploma, and 34% had some post-secondary education in 2005.Educational attainment differs among ethnic groups. Hispanic construction workers are much less likely to have a high school diploma and post-secondary education than non-Hispanic workers (chart 28b). Over the past five years, sharp increases in Hispanic employment in construction have coincided with a drop in the average level of educational attainment in the industry (see chart book pages 15 and 16). The percentage of construction employees having a high school diploma or higher education decreased from 79.1% in 2000 to 77.4% in 2005.2 In contrast, the percentage of employees with a high school diploma in the total workforce was 87.5% in 2000 and 88.4% in 2005, a slight increase. There is no significant difference in educational attainment between racial minorities and non-minorities in construction.
The level of education differs between men and women. Women construction workers are more likely to have higher educational attainment than men, and occupational distribution partly accounts for the difference.
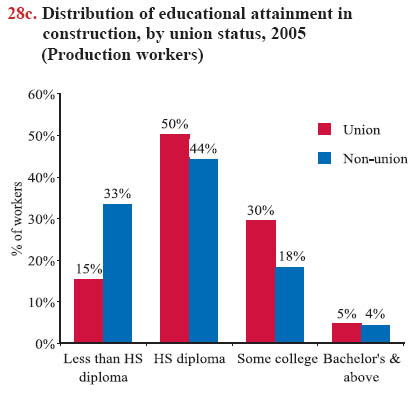
Within construction, union workers are more likely to have a high school diploma than non-union workers (chart 28c). Among production occupations in 2005, a larger portion of union workers had a post-secondary education – including some college or an associate's degree – than did non-union workers.
While the CPS measures formal levels of training, it is less effective at measuring informal training – although most construction knowledge is learned on the job or as part of special courses, licensing, or certification requirements and apprenticeships (see chart book page 29). Training toward these levels may or may not include safety training. For instance, unions and employer associations require that their members take either 10- hour or 30-hour safety training courses mandated by the Occupational Safety and Health Administration (OSHA), and this training may or may not be counted toward an occupational or vocational associate's degree.
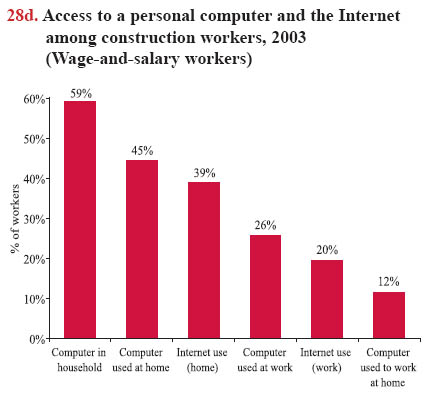
With the rapid adoption of computer and Internet technology, more and more people have a computer and Internet access at home. According to a recent survey, nearly 60% of construction wage-and-salary workers reported they had a computer at home (chart 28d). Union members are more likely than nonunion workers to have a computer and Internet access. About 66% of union members in construction had a computer at home in 2003, compared with 57% of non-union workers. For those without Internet access at home, 32% reported they do not need it or are not interested, followed by 28% who said the costs were too high, and 25% who said they had no computer or their computer was inadequate.3
Download MS PowerPoint versions of Charts
1. The numbers used in the text (except for computer use): U.S. Census Bureau and U.S. Bureau of Labor Statistics, 2005 Current Population Survey. Calculations by CPWR Data Center.
2. The Center to Protect Workers' Rights (CPWR), 2002. The Construction Chart Book: The U.S. Construction Industry and Its Workers, Third Edition.
3. The numbers for computer use: U.S. Census Bureau, 2003 October Internet and Computer Use Supplement to the Current Population Survey. Calculations by CPWR Data Center.
Note:
Chart 28c - Production workers are all workers, except managerial, professional, and administrative support staff, and include the self-employed. Percentages may not add up to 100 because of rounding.
Chart 28d - Computer access includes all individuals living in households in which the respondents answered "yes" to the question, "Is there a computer or laptop in this household?" (Members of the households are considered to have access to the computers.) Internet access includes those who have at least one member using the Internet at home.
Source:
Charts 28a, 28b, and 28c - U.S. Census Bureau and U.S. Bureau of Labor Statistics, 2005 Current Population Survey. Calculations by CPWR Data Center. Chart 28d - U.S. Census Bureau, 2003 October Internet and Computer Use Supplement to the Current Population Survey. Calculations by CPWR Data Center.