
Summary Statement
A broad collection of tables and charts covering health and safety in the U.S. construction industry, as well as considerable economic and training data.
2007
Section 24: Hourly Wages, by Union Status and Region, Gender, Ethnicity, and Race
Wages of production (blue-collar) construction workers vary by region, gender, ethnicity, race, and union membership, according to data collected by the U.S. Census Bureau’s Current Population Survey (CPS). Unlike the Occupational Employment Statistics program that collects wage data from employers (see chart book page 23), the CPS asks wage earners about their hourly pay, excluding overtime pay, tips, and commissions (see chart book page 9). Collecting data on hourly pay in this manner permits researchers to get a clear picture of wage rates overall. Collecting information about each wage earner permits researchers to compare wage rates among different groups.
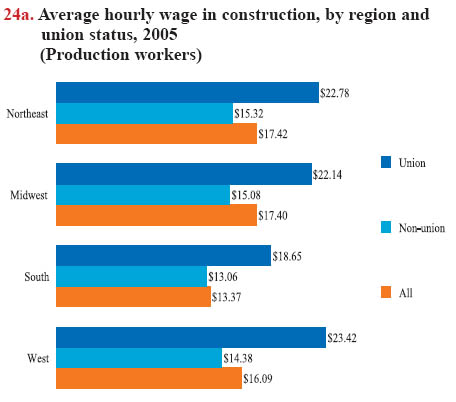
Among the most durable differences in wages in construction is the substantial advantage union members hold over non-union workers. Among production workers, union members have a 58.6% wage advantage over non-union workers: the average union wage is $22.20, compared to an average non-union wage of $14.00. Some of this difference is explained by occupation, education, age, and experience. For instance, production workers who are union members, on average, are slightly older and more educated than non-union workers (see chart book pages 13 and 28). The higher union wage may also reflect higher productivity and training levels that cannot be measured using this survey.When wages are compared among U.S. regions, construction workers in the South, which is less unionized than other regions, made less than their counterparts in other regions – either union or non-union workers. The average hourly wage in the South is about $4, or 23% less than that in the Northeast and Midwest, and nearly $3, or 17% less than in the West (chart 24a).
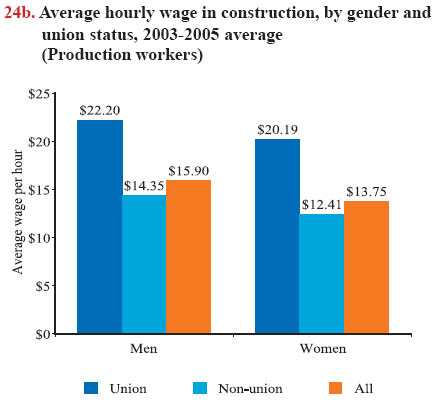
For women workers in construction production occupations, as for men, union pay is roughly 1.5 times higher than nonunion pay (chart 24b). The average wage difference between women and men in the union sector is 9% compared with 14% in the non-union sector.
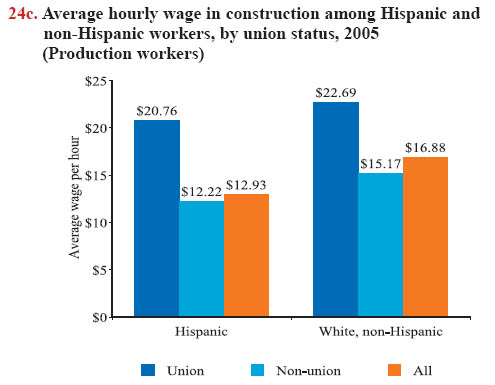
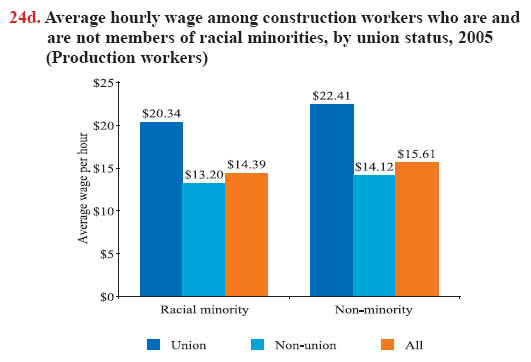
Other workers in construction who are union members earn a higher hourly wage, on average, than non-union workers. The average wage difference between Hispanic and white, non- Hispanic workers in the union sector is 9% compared with 19% in the non-union sector (chart 24c). Similarly, unionized minority workers earn a higher wage, on average, than their counterparts who worked in nonunionized construction sectors (chart 24d).
Download MS PowerPoint versions of Charts
Note:
All charts - Production workers are blue-collar workers – all workers except managerial, professional (architects, accountants, and so on), and administrative support staff. (The self-employed are excluded from these charts, which cover only wage earners.) The wage is what a worker reports as his/her hourly rate of pay, excluding overtime pay, tips, or commissions. Data include all hourly wage earners whose wages were greater than zero, among survey respondents who said it was easier to report their pay on an hourly basis. The estimates are based on the selfreported data in the Current Population Survey. Thus, they are not comparable to estimates on chart book page 23. The calculations do not take into account occupational and other differences.
Chart 24a - The U.S. Bureau of Labor Statistics divides the United States into these regions:
Northeast:
Connecticut, Maine, Massachusetts, New Hampshire, New Jersey, New York, Pennsylvania, Rhode Island, and Vermont.Midwest:
Illinois, Indiana, Iowa, Kansas, Michigan, Minnesota, Missouri, Nebraska, North Dakota, Ohio, South Dakota, and Wisconsin.South:
Alabama, Arkansas, Delaware, District of Columbia, Florida, Georgia, Kentucky, Louisiana, Maryland, Mississippi, North Carolina, Oklahoma, South Carolina, Tennessee, Texas, Virginia, and West Virginia.West:
Alaska, Arizona, California, Colorado, Hawaii, Idaho, Montana, Nevada, New Mexico, Oregon, Utah, Washington, and Wyoming.
The minimum sample size is 190, standard errors of wages are within ± 3%, ranges between upper and lower levels (95% CI) were within $2.00, p-value < 0.001.
Chart 24b - Wages are averaged for three years in 2005 dollars; wages in 2003 and 2004 are adjusted by using the Urban Wage Consumer Price Index (CPI-W). The minimum sample size is 86, standard errors of wages are within ± 4%, ranges between upper and lower levels (95% CI) were within $3.00, p-value < 0.001.
Chart 24c - The minimum sample size is 161, standard errors of wages are within ± 3%, ranges between upper and lower levels (95% CI) were within $2.00, p-value < 0.001.
Chart 24d - The minimum sample size is 174, standard errors of wages are within ± 1%, ranges between upper and lower levels (95% CI) were within $3.00, p-value < 0.001.
Source:
All charts - U.S. Bureau of Labor Statistics, 2005 Current Population Survey. Calculations by CPWR Data Center.