
Summary Statement
A broad collection of tables and charts covering health and safety in the U.S. construction industry, as well as considerable economic and training data.
2007
Section 17: Members of Racial Minorities in Construction and Other Industries
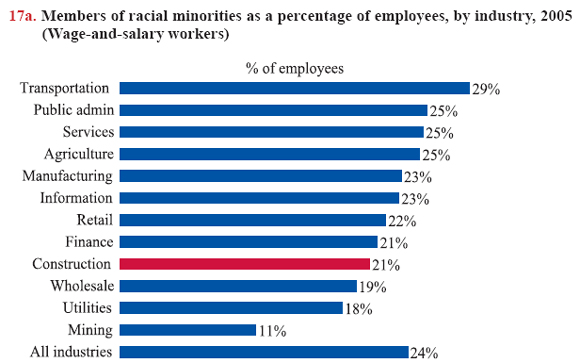
Approximately 1..9 million people of racial minorities were employed in construction in 2005 as self-employed and wage-and-salary workers.1 (“Racial minorities” combines all racial groups except “white only.”) The percentage of wage-and-salary workers who are members of racial minorities is lower in construction than in most other industries (chart 17a).
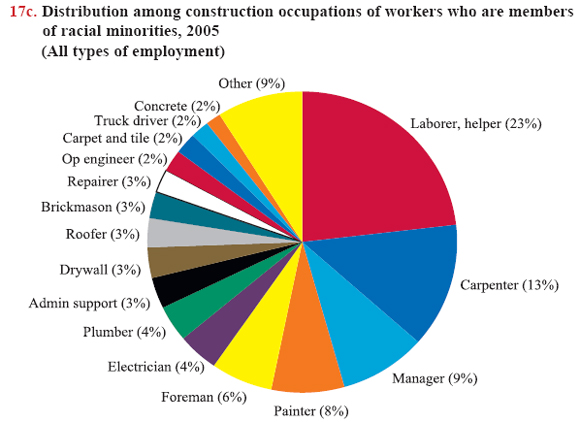
The distribution of construction employment differs considerably by race. In 2005, 16% of racial minorities were self employed compared to 25% of all construction workers. Minority members are also more likely to be employed as a production worker (see chart book page 10) than are construction workers as a whole: 79% of all construction workers are employed in production positions, but 87% of racial minorities are production employees. This difference is also evident by construction occupation; while 33% of concrete finishers are members of racial minorities, only 10% of construction managers are minority members (chart 17b).The occupational distribution among racial minorities shows the racial disparities from another perspective. Among construction workers who are members of racial minorities, 23% were laborers or helpers (chart 17c). That proportion is higher than the average of 14% of the construction workforce as laborers or helpers (see chart 10b). Also, only 7% of members of racial minorities in construction were women, lower than the average of 9% for all women in construction.
"Race," which characterizes the population based on physical characteristics, is separate from ethnicity, which considers cultural, linguistic, or national origin traits.2 So, for instance, people of Hispanic origin may or may not be included in racial minorities (see chart book pages 15 and 16).
Data provided here are from the American Community Survey (ACS), which classifies race as white, black or African American, American Indian, Alaska Native, American Indian and Alaska Native, Asian, Native Hawaiian or Other Pacific Islander, "some other race," or "two or more major race groups." "Some other race" includes all other responses not included in the race categories described above. "Two or more race groups" refers to multiracial people. The survey respondents were given the option of selecting one or more race categories to indicate their racial identities. An estimated 2% (5.6 million) of Americans identified themselves as members of two or more races in 2005.2
Due to changes in data sources and classifications, data showing race in this chart book are not directly comparable with data on race in the previous editions of this book. Caution must be used when interpreting changes in the racial composition of construction employment over time.

Download MS PowerPoint versions of Charts
1. All numbers in the text are from the U.S. Census Bureau, 2005 American Community Survey and may not match up with the numbers from the Current Population Survey (see chart book page 9 charts). Calculations by CPWR Data Center.
2. U.S. Census Bureau, General Demographic Characteristics, 2005, http://factfinder.census.gov (Accessed November 2007).
Note:
All charts - Averages include all occupations from managerial through clerical/administrative support. "Racial minorities" are those who chose to identify themselves as black or African American, American Indian, Alaska Native, Asian, Native Hawaiian or Other Pacific Islander, or some race other than white.
Chart 17b - Other managers in construction (not listed) was 11%.
Chart 17c - Percentages do not add up to 100 because of rounding. "Manager" includes Construction Managers as well as non- Construction Managers.
Source:
All charts - U.S. Census Bureau, 2005 American Community Survey. Calculations by CPWR Data Center.
Back to Table of Contents