
Summary Statement
A broad collection of tables and charts covering health and safety in the U.S. construction industry, as well as considerable economic and training data.
2007
Section 15: Hispanic Workers in Construction and Other Industries
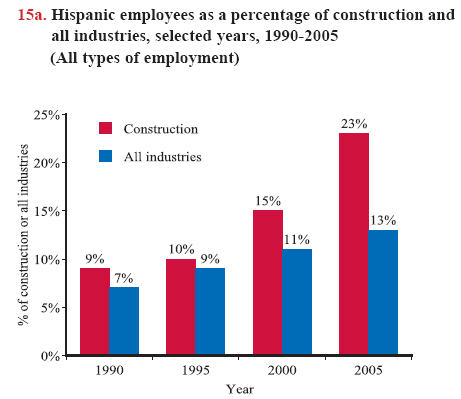
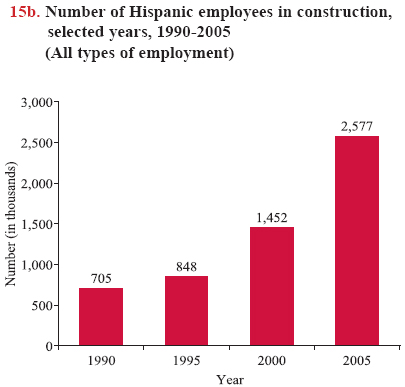
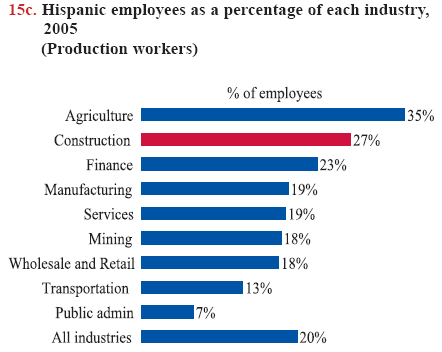
In 2005, 18.6 million Hispanics were employed in the United States, comprising 13.1% of the workforce. The increase in the Hispanic portion of the labor force has been rapid, particularly in construction. From 1990 to 2005, the proportion of workers who identified themselves as Hispanic increased by 86% for all industries, while it jumped by 156% for construction (chart 15a). The number of Hispanics employed in construction almost quadrupled, from 704,606 in 19901 to 2.6 million in 2005 (chart 15b). Many Hispanic workers are employed in production*, or bluecollar, occupations (see chart book page 10). In construction, 27% of production workers were Hispanic, higher than in any other industry, except agriculture (chart 15c).
Hispanic* refers to any person or individual whose origin is Mexican, Puerto Rican, Cuban, South or Central American, Chicano, or other Latin American, regardless of racial background and country of origin. The term Latino is used in place of the term Hispanic in many publications. However, to maintain consistency, the term Hispanic is used throughout this chart book, as it is used by the U.S. Census Bureau.Parallel to demographic trends in the United States, most of the recent increases in Hispanic employment are attributable to foreign-born workers (see chart book page 14). About 75% of the 2.6 million Hispanic construction workers were born outside the United States, and about two-thirds – 1.7 million, or 66% – were not U.S. citizens in 2005. The growth of Hispanic employment in construction is driven, in particular, by recent arrivals. Among those who were not U.S. citizens, 57% (956,660) entered the country after 1995. Of the foreign-born Hispanic workers, 88% reported they spoke Spanish at home.2
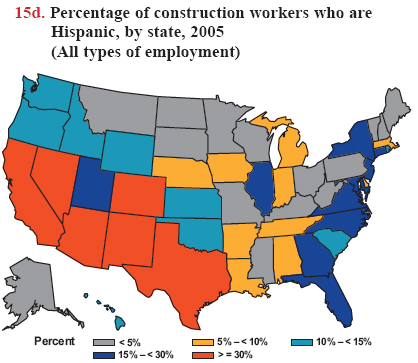
Hispanic workers are more likely to reside in the South and West, and less likely to live in the northeastern United States.3 In construction, 47% of Hispanic workers reside in the South, 40% in the West, 6% in the Midwest, and 7% in the Northeast.4 Although the percentage of Hispanic construction workers is below 5% in some states, such as Alaska and West Virginia, the figure is as high as 57% in New Mexico and 54% in Texas, 48% in California and 47% in Arizona, 41% in Nevada and 34% in the District of Columbia, and 31% in Colorado (chart 15d).2
In this chart book, detailed demographic information for sub-groups (such as language spoken among foreign-born workers) and state-level data are from the American Community Survey (ACS), while historical data, occupational data, and data on unionization, are from the Current Population Survey (CPS), as shown on chart book pages 12, 16, 18, and the current page. Page 9 of this chart book gives an introduction to the CPS.
Both ACS and CPS surveys provide a Spanish-language version and identify people as Hispanic only if the respondents say they are. These household surveys are believed to undercount the population of Hispanic origin, as new immigrants tend to be mobile and thus difficult to locate for an interview.
Although both the CPS and the ACS provide demographic and employment information, they differ in sample size, time frame, and principal purpose. The ACS is a relatively new survey, first conducted in 2000, providing detailed socioeconomic data on an annual basis (see chart book page 14). The CPS has been used to provide monthly estimates of household employment and unemployment for more than 50 years. The ACS sample size is much larger than the CPS, but the CPS has more detailed labor force questions. For example, the CPS collects information on union status, while the ACS does not. The CPS sample is designed to achieve a high degree of reliability for monthly estimates nationwide, but its sample is spread too thinly geographically to provide reliable computations for state-level estimates. Thus, the two surveys complement, but do not replace, each other.5
Download MS PowerPoint versions of Charts
1. The number of Hispanics in 1990 was adjusted by the parameters provided by the U.S. Bureau of Labor Statistics.
2. U.S. Census Bureau, 2005 American Community Survey. Calculations by CPWR Data Center.
3. U.S. Census Bureau: The 2007 Statistics Abstract, The National Data Book, Table 23. Resident Population by Race, Hispanic or Latino Origin, and State: 2000 to 2005.
4. The states and the District of Columbia are divided into regions as follows: Northeast (Connecticut, Maine, Massachusetts, New Hampshire, New Jersey, New York, Pennsylvania, Rhode Island, and Vermont); South (Alabama, Arkansas, Delaware, District of Columbia, Florida, Georgia, Kentucky, Louisiana, Maryland, Mississippi, North Carolina, Oklahoma, South Carolina, Tennessee, Texas, Virginia, and West Virginia); Midwest (Illinois, Indiana, Iowa, Kansas, Michigan, Minnesota, Missouri, Nebraska, North Dakota, Ohio, South Dakota, and Wisconsin); West (Alaska, Arizona, California, Colorado, Hawaii, Idaho, Montana, Nevada, New Mexico, Oregon, Utah, Washington, and Wyoming).
5. Shail Butani, Charles Alexander, and James Esposito. Using the American Community Survey to enhance the Current Population Survey: Opportunities and Issues, http://www.fcsm.gov/99papers/acsasa.html (Accessed November 2007).
*See Glossary for complete definition.
Note:
Chart 15b - When data are adjusted to accommodate coding system changes, the discrepancy between adjusted and non-adjusted numbers is less than 70,000.
Chart 15c - Production workers are compared here. Even though construction has a relatively high percentage of self-employed workers, Hispanic workers tend not to be self-employed (see chart book page 20).
Source:
Charts 15a, 15b, and 15c - U.S. Bureau of Labor Statistics, 2005 Current Population Survey. Calculations by CPWR Data Center.
Chart 15d - U.S. Census Bureau, 2005 American Community Survey, http://www.census.gov/acs/www/ (Accessed November 2007). Calculations by CPWR Data Center.
Back to Table of Contents