
Summary Statement
A broad collection of tables and charts covering health and safety in the U.S. construction industry, as well as considerable economic and training data.
2007
Section 13: Age of Construction Workers, by Union Status, Hispanic Ethnicity, Type of Employment, and Occupation
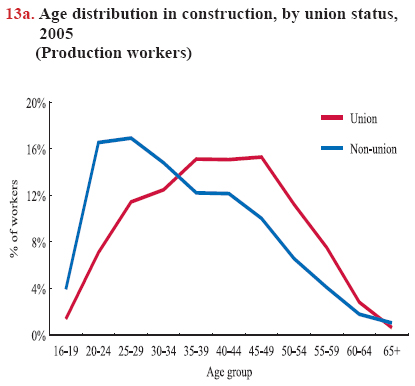
The age of construction workers varies among worker groups. Union construction workers, on average, are older than nonunion workers, and production (blue-collar) workers are younger than those in managerial and professional occupations.1 The average age of all construction workers in production occupations is 37.8 years (median 37).2 For union members in construction production occupations, the average age is 40.3 years; for non-union workers, it is 35.5 years. The median age gap is larger – 40 years old for union members compared with 34 years old for non-union workers in construction production occupations.
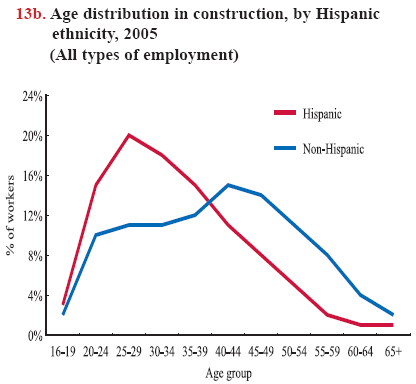
The differences in the age structure are most apparent among construction production (blue-collar) workers. Only 20% of union members who perform construction production work are less than 30 years old, but 37% of the non-union workers are under 30. Nearly half (45%) of the employed union members in production occupations are between 35 and 49 years old, while only 34% of the non-union workers are in that age range (chart 13a).Hispanic construction workers are, on average, six years younger than non-Hispanic workers. The median age gap is larger – 32 years old for Hispanic workers, while it is 41 years old for non-Hispanic workers. The median age difference between Hispanic and non-Hispanic construction workers has increased, from six years in 2000 to nine years in 2005, suggesting many of the Hispanic workers who entered in the construction industry in recent years were young while the non-Hispanic workforce is aging (see chart book pages 14, 15, and 16). In construction, more than one-third (38%) of Hispanic workers are under 30, compared to 23% of non-Hispanic workers. Eighteen percent of Hispanic workers are less than 25 years old, compared with 12% of non-Hispanic workers (chart 13b).
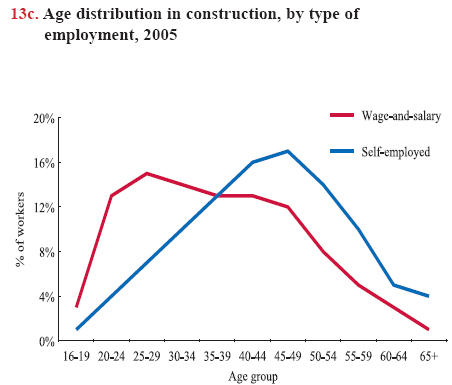
Age differences are reflected, as well, in the type of employment in construction. While 42% of wage-and-salary construction workers are 40 or older, 65% of self-employed workers are in that age group (chart 13c). The average age of self-employed workers is 44 years, older than for construction employment as a whole. Among wage-and-salary workers in construction, government employees are older than workers in private companies, with average ages of 45 and 37 years, respectively.
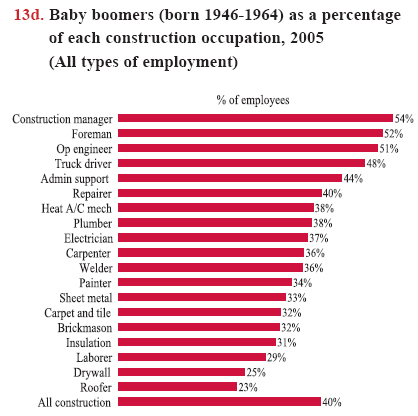
When all construction occupations are considered, construction managers are somewhat older than employees in other occupations. When managerial and administrative staff are included, the average age is 39 years for all construction employees. Baby boomers (those born between 1946 and 1964) account for a large percentage of most construction occupations, especially as construction managers, foremen, and operating engineers (chart 13d). The baby boomer cohort will be between 51 and 69 years old in 2015. Except for construction laborers, drywall installers, and roofers, most construction occupations will be significantly affected by the aging of baby boomers in the next decade. The exit of the baby boomer cohort from the labor force will drive up demand for skilled workers, which will, in turn, increase the need for worker safety and health training in construction (see chart book pages 29 and 30).
Download MS PowerPoint versions of Charts
1. Production workers are all workers, except managerial and administrative support staff – and include the self-employed.
2. The median is the midpoint; half of the workers are older and half are younger.
Note:
All charts - All charts include self-employed workers.
Chart 13a - Production workers are all workers, except managerial and administrative support staff – and include the self-employed.
Source:
All charts - U.S. Bureau of Labor Statistics, 2005 Current Population Survey. Calculations by CPWR Data Center.
Back to Table of Contents