
Noise Exposure and Hearing Protection Use Among Construction Workers in Washington State
Summary Statement
This 2004 University of Washington Department of Environmental and Occupational Health Sciences prospective study of noise exposure and hearing loss among a group of construction apprentices in nine different trades found that:
- Construction workers were exposed over 85 dBA in about 70% of work shifts using the NIOSH exposure standard. Even “quiet” trades like electricians had a substantial percentage of measured workshifts that exceeded 85 dBA.
- Construction workers wore hearing protection less than 20% of the time, on average, when exposure levels were over 85 dBA. Overall, less than one in five overexposed shifts was brought below 85 dBA by HPDs.
- Nearly half of workers reported “always” wearing HPDs on an annual questionnaire, but these workers actually used HPDs only about one-third of the time they were exposed above 85 dBA during measured workshifts.
September 2004
Department of Environmental and Occupational Health Sciences
The School of Public Health and Community Medicine - University of Washington
4225 Roosevelt Ave NE, Suite 100 - Seattle, WA 98105 - http://depts.washington.edu/envhlth/
NOISE EXPOSURE AND HEARING PROTECTION USE AMONG CONSTRUCTION WORKERS IN WASHINGTON STATE
Noah Seixas, PhD, CIH
Rick Neitzel, MS, CIH
September 2004
EXECUTIVE SUMMARY
From 1999-2004 the University of Washington Department of Environmental and Occupational Health Sciences conducted a prospective study of noise exposure and hearing loss on a group of construction apprentices in nine different trades. As part of this study, noise exposure levels were measured according to the WISHA Permissible Exposure Limit and the NIOSH Recommended Exposure Limit. This report focuses on the NIOSH noise levels, because the NIOSH standard is more sensitive to variable and intermittent noise, and therefore more accurately reflects the risk of hearing loss in construction workers. In addition to noise measurements, we assessed the use of hearing protection devices (HPDs) by construction workers. We found that:
- Construction workers were exposed over 85 dBA in about 70% of work shifts using the NIOSH exposure standard, and in about 30% of shifts using the less-protective WISHA exposure standard. Even “quiet” trades like electricians had a substantial percentage of measured workshifts that exceeded 85 dBA when measured using either standard.
- On average, construction workers achieved HPD attenuation levels that were greater than half of the labeled Noise Reduction Rating (NRR) for the earplug they used. However, variability between subjects was large, with some workers achieving more attenuation than the NRR, and some achieving almost none.
- Construction workers wore HPDs less than 20% of the time, on average, when exposure levels were over 85 dBA. As a result of this low use time, workers achieved an average of less than 3 dB of noise reduction in full-shift exposure levels through HPD use. Overall, less than one in five overexposed shifts was brought below 85 dBA by HPDs. However, the two trades with fairly high usage times gained enough protection to reduce their mean exposure levels below 85 dBA.
- Nearly half of workers reported “always” wearing HPDs on an annual questionnaire, but these workers actually used HPDs only about one-third of the time they were exposed above 85 dBA during measured workshifts.
This study shows that additional efforts at implementing noise controls and providing hearing loss prevention training to reduce noise exposure levels in construction are warranted. Additional information on this study is available at http://depts.washington.edu/occnoise/content/Noise_HPD.pdf.
BACKGROUND
Exposure to high noise (above 85 decibels, or dBA) is common in the construction industry, and hearing loss is prevalent in the building trades. However, little is known about the development of noise-induced hearing loss among younger workers just starting their careers in construction. Hearing conservation programs in construction, which are the best defense against noise-induced hearing loss from occupational noise, usually depend on workers’ use of hearing protection devices (HPDs) rather than noise controls. No previous studies have examined the effectiveness of HPD use in construction workers, although it is known that the amount of noise protection (attenuation) achieved by workers in the field is usually quite different than the laboratory-derived Noise Reduction Rating (NRR) labeled on HPDs sold in the US.
To address these issues, from 1999-2004 the University of Washington Department of Environmental and Occupational Health Sciences conducted a prospective study of noise exposure and hearing loss on a group of 393 construction apprentices. These apprentices were beginning their training programs in the following trades: carpenter, cement mason, electrician, ironworker, insulation worker, laborer, the masonry trades (including bricklayer, masonry restoration worker, and tilesetter), operating engineer, and sheet metal worker. The study was designed to evaluate the effects of noise exposure on the hearing of apprentices in their first few years of construction employment. This report summarizes the noise exposure and hearing protection use data collected as part of the five-year prospective study. The study was funded by the National Institute for Occupational Safety and Health (NIOSH), US Centers for Disease Control and Prevention, grant number R01 OH 03912.
METHODS
Noise Exposure Assessment
We collected 730 full-shift noise dosimetry measurements on construction workers. Noise levels were simultaneously measured according to two standards. The first was the Washington Industrial Safety and Health Administration (WISHA) Permissible Exposure Limit for noise, which is the legal standard with which Washington contractors must comply. The second was the more protective NIOSH Recommended Exposure Limit, which is a voluntary exposure guideline. Both standards specify an allowable full-shift average exposure level of 85 dBA, but the NIOSH standard measures noise in a way that is more sensitive to variable and intermittent noise levels, and therefore better reflects construction worker’s actual risk of noise- induced hearing loss. The results of this report focus primarily on the NIOSH levels, since they are a better measure of the actual exposure received by workers. However, data on the WISHA exposure levels are presented as well, to provide compliance information.
We measured noise levels on dozens of commercial construction sites in Western Washington with the assistance of many general contractors and subcontractors. In each of our measurements, workers wore datalogging dosimeters for a complete workshift. The dosimeters provided both WISHA and NIOSH average noise levels for each minute of each workshift, in addition to WISHA and NIOSH full-shift average exposure levels. While wearing the dosimeters, workers completed activity cards describing their tasks and tools. These cards listed a number of common activities for each trade, and allowed workers to report their activities during each minute of the workshift. By combining the measured one-minute noise levels with the reported tasks and tools, we were able to estimate exposure levels for specific tasks and tools, in addition to the full-shift average exposure levels. This report focuses on the full-shift average exposure levels; however, task- and tool-specific exposure levels for the most common tasks and tools are included in the Appendix by trade. Task-based assessment of noise exposure is attractive for the construction industry because it allows for estimation of noise levels associated with the range of different activities that a worker might perform. However, there is a large degree of variability in noise exposure between individuals doing the same task at different times, or on different sites. This variability makes the estimated exposure level for any specific individual highly imprecise. Therefore, the task-based estimates presented in the appendix should be used with caution. Also, the use of site-specific noise levels is always preferable to the use of levels measured across many different sites, such as those presented here.
Hearing Protection Device (HPD) Assessment
Several types of HPD data were collected on eight of the nine trades during the five-year study. No HPD use information was collected on laborers. The participating apprentices completed annual questionnaires in which they reported the percentage of their work time that was ‘noisy.’ ‘Noisy’ was defined as “noise levels high enough to require workers to raise their voice to talk to someone an arm’s length away.” The apprentices also reported how often they used HPDs (“always,” “sometimes,” or “rarely or never”) when they were in high noise. In addition to this questionnaire information, when workers wore dosimeters to measure their noise levels, they also recorded what type of HPD they wore, and when they wore it, on their activity card. HPDs should be used whenever noise levels exceed 85 dBA; therefore, we examined how often HPDs were used when levels were above 85 dBA. We also assessed the accuracy of the annual questionnaire responses for 115 workers by comparing these responses to the HPD use they reported during their dosimetry measurements.
To account for the well-known difference between laboratory-based attenuation ratings like the NRR and the attenuation achieved by actual workers, we made direct measurements with a FitCheck system on HPDs used by 44 construction workers at 6 different sites. The FitCheck system measured subjects’ audiometric hearing thresholds with and without use of earplugs; the difference between the two levels is the exact amount of attenuation, in dB, received by an individual using a specific protector. Measurements were made in five 1/3 octave bands, and these results were summed into a Personal Attenuation Rating (PAR) comparable to the NRR.
While this report focuses on trade-specific use of HPDs and measured HPD attenuation levels, we also assessed task- and tool-specific HPD use. The average percent of time that HPDs were used during exposures above 85 dBA is presented by trade in the Appendix.
RESULTS
Noise Exposure Assessment
We measured over 360,000 minutes (6,000 hours) of construction noise across 730 workshifts. Figure 1 shows the mean full-shift average NIOSH and WISHA exposure levels by trade and overall. The trades are ordered by descending mean NIOSH level. The number of measurements for each trade is shown in parentheses. Standard deviations, which are measures of the variability of the full-shift average levels, are indicated by the error bars.
The mean full-shift average NIOSH levels were always higher than the WISHA levels; again, this is due to the increased sensitivity of the NIOSH standard to intermittent and variable noise, and is a better representation of the actual risk of hearing loss in construction. Mean full- shift average NIOSH levels exceeded 85 dBA for all but one trade (insulation worker), while only one mean WISHA level (ironworker) was at or above 85 dBA. The large error bars show that, even though mean levels were below 85 dBA for some trades, all trades had at least some full- shift exposures that were very high. Even “quiet” trades like electrician and sheet metal worker had some full-shift exposure levels that exceeded 85 dBA. Overall, the mean full-shift average NIOSH level was 87.4 ± 5.8 dBA, and the mean full-shift WISHA level was 82.1 ± 5.7 dBA.
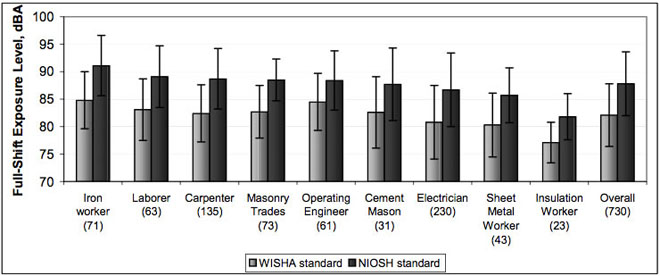
Figure 1. Full-shift average exposure levels by trade
Figure 2 shows the percentage of the 730 NIOSH and WISHA full-shift average levels that exceeded 85 dBA by trade and overall. This percentage is called the exceedance percent. The trades are ordered by descending NIOSH exceedance percent, and the number of measurements for each trade is shown in parentheses. Note that the order of NIOSH exceedance percentages is different than the order of full-shift NIOSH average levels in Figure 1, indicating that trades with the very highest average exposure levels don’t necessarily also have the highest percent of workshifts above 85 dBA. For all but one trade (insulation worker), more than 50% of full-shift average NIOSH exposures were above 85 dBA. The WISHA exceedance percentages were lower, but two trades (ironworker and operating engineer) had more than 45% of full-shift average WISHA levels above 85 dBA. Again, even “quiet” trades like electrician had a substantial percentage of overexposures. Overall, 67.4% of NIOSH and 29.5% of WISHA full- shift average levels exceeded 85 dBA.
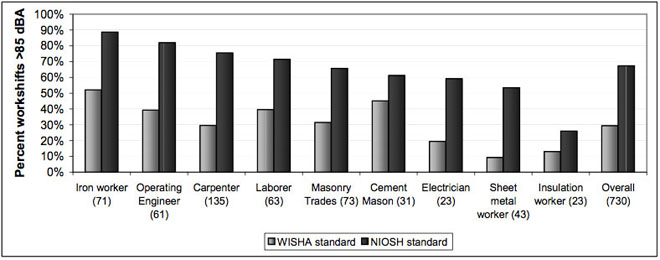
Figure 2. Full-shift average exceedance percentages
In addition to occupational noise, exposures to non-occupational noise were assessed, including everyday activities like commuting and less common events like concerts and riding snowmobiles. Our study found that, for most construction workers, non-occupational activities make little contribution to workers’ total (occupational plus non-occupational) annual noise dose. Only for a small fraction of workers who spend significant amounts of time in noisy activities, and who work in the quieter trades, would non-occupational noise significantly contribute to overall noise dose. The impact of firearms use on annual noise dose could not be assessed, but we found that people who shoot firearms are more likely to participate in other noisy activities.
Hearing Protection Device Assessment
Because the NIOSH standard is a better representation of the risk of noise-induced hearing loss from construction noise, the HPD use data below are presented in relation to NIOSH noise levels. Laborers are not shown because HPD use data were not collected on them.
Table 1 shows the percentage of minutes per shift with NIOSH exposure levels that exceeded 85 dBA, and the percent of those minutes during which HPDs were used. The trades are shown by descending percentage of minutes with NIOSH levels greater than 85 dBA. The 557 workshifts in this table are a subset of the 730 workshifts from Figure 1 for which both exposure levels and HPD use data were available. Overall, nearly one-third of monitored minutes exceeded 85 dBA, and therefore needed HPD use. However, HPDs were actually used less than 20% of this time. Operating engineers were the most noise-exposed trade, spending more than half of their time above 85 dBA on average. However, they also had the highest reported use of HPDs – nearly two-thirds of time they were exposed above 85 dBA. Conversely, ironworkers, who had the second-highest mean percent of time above 85 dBA, used HPDs less than 10% of the time they were overexposed. Sheet metal workers had one of the lowest mean percentages of minutes above 85 dBA, but had the second-highest use of HPDs above 85 dBA. In other words, like operating engineers, they were fairly good at wearing HPDs when they needed to. HPDs were used 16% of the total time monitored. Workers wore earplugs 95.5% of the time that HPDs were worn, and earmuffs the other 4.5% of time.
Table 1. HPD use per shift during minutes with NIOSH level >85 dBA by trade and overall
| Trade | Number of workshifts | Number of minutes | % minutes in shift >85 dBA | % minutes in shift >85 dBA when HPDs used | ||
|---|---|---|---|---|---|---|
| Mean | SD | Mean | SD | |||
| Overall | 557 | 274,468 | 28.7 | 19.2 | 17.1 | 34.9 |
| Operating Engineer | 33 | 17,079 | 49.0 | 30.9 | 59.2 | 49.0 |
| Ironworker | 37 | 18,894 | 38.8 | 17.4 | 8.7 | 24.9 |
| Carpenter | 81 | 39,027 | 33.0 | 14.1 | 22.0 | 37.2 |
| Cement Mason | 31 | 14,764 | 26.3 | 18.4 | 16.7 | 31.5 |
| Electrician | 230 | 114,827 | 26.3 | 17.4 | 4.5 | 17.9 |
| Masonry Trades | 73 | 34,437 | 25.5 | 18.5 | 25.3 | 40.5 |
| Sheet Metal Worker | 43 | 21,156 | 24.0 | 15.2 | 43.3 | 46.8 |
| Insulation Worker | 23 | 11,597 | 15.0 | 17.5 | 4.3 | 20.7 |
The exposure above 85 dBA and HPD use data from Table 1 3, with the number of full-shift measurements for each trade shown in parentheses. The trades in Figure 3 are shown in the same order as Table 1, by descending percentage of minutes with NIOSH levels greater than 85 dBA. Note that HPD use above 85 dBA varies widely by trade, and does not correlate well with the percentage of minutes exceeding 85 dBA.
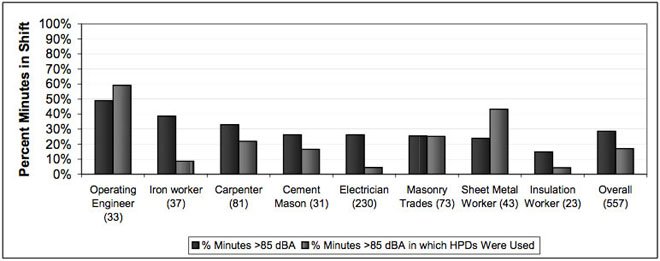
Figure 3. Exposure and HPD use above 85 dBA by trade and overall
We compared the results of HPD use reported by 115 subjects on annual questionnaires to HPD use reported by the same subjects on activity cards during dosimetry. Workers reported using HPDs more frequently on questionnaires than during dosimetry minutes where noise levels exceeded 85 dBA. Nearly half (50 of 115) of workers reported “always” wearing HPDs on thequestionnaire, but these same workers actually only used HPDs one-third of the time that noise levels exceeded 85 dBA. Workers who reported “sometimes” wearing HPDs on the questionnaire actually used HPDs only around 10% of the time that noise levels exceeded 85 dBA, and workers who reported “rarely or never” wearing HPDs on annual questionnaires alsonever reported wearing HPDs during dosimetry. Overall, the groups reporting “always,” “sometimes,” or “rarely or never” wearing HPDs were all exposed above 85 dBA for about 25% of their total work time. Sheet metal workers who reported “sometimes” using HPDs on the questionnaire actually wore them 100% of the time above 85 dBA. Conversely, ironworkers and insulation workers who reported “always” using HPDs on the questionnaire never wore them above 85 dBA. The trades with the highest percentage of workers reporting they “rarely or never” used HPDs were insulation worker and cement mason. The trades with workers who most often reported “always” using HPDs were operating engineer, sheet metal worker, and masonry worker. These data suggest that occasionally asking workers how often they wear HPDs is not an adequate HPD use assessment method, and that direct observation of worker HPD use, or more frequent worker self-reporting, is needed.
Table 2 shows the Personal Attenuation Rating (PAR) levels measured on a group of 44 construction workers from four trades (carpenter, cement mason, ironworker, and operating engineer) using the FitCheck system. A total of seven different earplug models were tested. However, cince some models had only one or two attenuation measurements, they were grouped into three categories for comparison. Workers achieved more than half of the adjusted NRR (the labeled NRR revised slightly to reflect the test frequencies used in this study) on the earplugs tested for all three groups, and the mean binaural (two-ear) PAR was 19.5 dB. However, attenuation variability was very high. There was no difference between the four trades.
Table 2. Binaural (two-ear) Personal Attenuation Ratings measured on various earplugs
| Type of Earplug | Adjusted NRR (dB) | Number of tests | Mean (dB) | SD (dB) |
|---|---|---|---|---|
| Overall | 29.2 | 42 | 19.5 | 9.1 |
| Howard Leight Max-Lite | 29 | 26 | 20.4 | 9.4 |
| Moldex plugs* | 31 | 10 | 17.6 | 9.1 |
| Other plugs** | 27.3 | 6 | 18.9 | 8.8 |
*Moldex plugs: Pura-Fit 6800, SparkPlug;
**Other plugs: 3M 1100, 3M 1270, DePlug 77200, E-A-R Classic
To account for the fact that the protection offered by an HPD is a combination of both the attenuation of the HPD and the time the HPD is used, HPD-adjusted full-shift exposure levels, were calculated for the 557 full-shift average NIOSH exposure levels from Table 1. These HPD- adjusted levels were calculated by assuming that workers in all 557 workshifts achieved the mean binaural PAR we measured in the field (about 20 dB) during the periods in which they reported wearing HPDs. The one-minute noise levels associated with these minutes in which HPDs were used were then lowered by 20 dB, and a new full-shift exposure level was calculated using the levels lowered by 20 dB for minutes in which HPDs were used, and the original levels for the minutes in which HPDs were not used. The resulting HPD-adjusted full-shift exposure level could then be compared to the unadjusted full-shift level to assess the effect of HPD use.
Table 3 provides full-shift NIOSH Time-Weighted Average (TWA) unadjusted and HPD-adjusted exposure levels, as well as the difference between the two levels. Mean and standard deviation levels are shown by trade and overall. The trades are ordered by descending mean HDP-adjusted NIOSH TWA level. The overall reduction in full-shift average NIOSH exposure levels from HPD use was less than 3 dB, resulting from a combination of the reasonably high assumed attenuation of 20 dB and very low HPD use times. Only two trades (operating engineer and sheet metal work) achieved more than 6 dB exposure reduction on average. Note that the highest-exposed trades by unadjusted exposure level are the not the same as the highest-exposed trades by HPD-adjusted exposure level. Three trades (operating engineer, insulation worker, and sheet metal worker) had mean HPD-adjusted exposure levels below 85 dBA; however, insulation workers were below 85 dBA even without accounting for HPD use.
Table 3. HPD-adjusted vs. unadjusted NIOSH full-shift TWA exposure levels
| Trade | Number of work shifts | Unadjusted NIOSH TWA (dBA) | HPD-adjusted NIOSH TWA (dBA) | Difference (unadjusted - HPD-adjusted) (dBA) | |||
|---|---|---|---|---|---|---|---|
| Mean | SD | Mean | SD | Mean | SD | ||
| Overall | 557 | 87.4 | 5.7 | 84.8 | 7.4 | 2.7 | 6.0 |
| Ironworker | 37 | 90.7 | 5.5 | 89.5 | 6.3 | 1.2 | 4.1 |
| Carpenter | 81 | 89.3 | 4.5 | 86.2 | 6.9 | 3.1 | 6.2 |
| Electrician | 230 | 86.7 | 5.5 | 86.2 | 6.2 | 0.5 | 2.5 |
| Cement Mason | 31 | 87.7 | 5.6 | 85.0 | 7.8 | 2.7 | 5.9 |
| Masonry Trades | 73 | 88.5 | 6.7 | 84.4 | 7.0 | 4.1 | 7.0 |
| Insulation Worker | 23 | 81.8 | 3.8 | 81.1 | 4.2 | 0.7 | 3.4 |
| Sheet Metal Worker | 43 | 85.7 | 4.2 | 78.8 | 8.0 | 6.8 | 8.4 |
| Operating Engineer | 33 | 88.1 | 6.0 | 77.3 | 9.0 | 10.9 | 9.2 |
The HPD-adjusted NIOSH exposure levels in Table 3 are a better estimate of the actual exposures received by construction workers than the unadjusted levels for workers using HPDs. The results of the monitored operating engineers and sheet metal workers demonstrate that workers can achieve sufficient protection from noise if they have high HPD use times. Unfortunately, the low use times seen in most other trades indicates that workers need more training and guidance on when and for how long HPDs need to be worn.
Figure 4 illustrates the difference between the percentage of unadjusted and HPD- adjusted NIOSH TWA exposures above 85 dBA. Percentages are shown by trade and overall, and the number of measurements by trade is shown in parentheses. As in Table 3, the trades are ordered by descending mean HPD-adjusted NIOSH TWA level. HPD use resulted in dramatic reductions (greater than 50%) in overexposure situations for two trades (operating engineers and sheet metal workers), but produced minimal changes in overexposures for most other trades (for example, less than 7% overexposure reduction for ironworkers and electricians). Only about one in five overexposures overall were brought below 85 dBA by use of HPDs. Clearly, HPD use has the potential to provide adequate protection against high noise exposure, but only in cases where workers consistently wear HPDs during their entire exposure to high levels of noise.
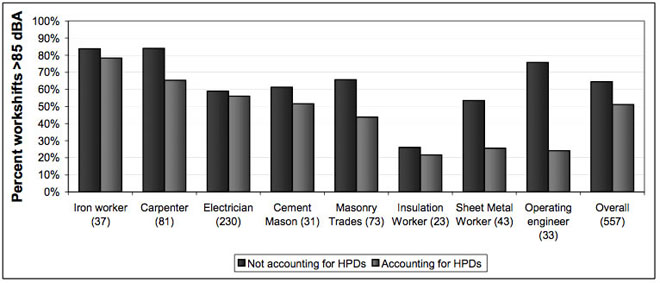
Figure 4. Percentage of shifts above 85 dBA with and without consideration of HPD use
RECOMMENDATIONS
Based on the full-shift average exposure levels measured in this study, we can make recommendations for the HPD Noise Reduction Rating necessary to protect most workers from being overexposed. These recommendations are presented in Table 4. Note that the NRRs in Table 4 assume that HPDs are worn 100% of the time that workers are exposed above 85 dBA, and that workers will achieve 50% of the labeled NRR for the HPD they wear. These NRRs are intended to protect against the 95th percentile full-shift average exposure level measured during this study. In other words, for the very highest 5% of exposures, a higher NRR may be needed. The highest NRR available is 33 dB; however, note that none of the needed NRR levels shown below are higher than 24 dB. In almost all cases, assuming that the workers are properly trained and know how to wear their HPD correctly, providing construction workers with an HPD with an NRR of more of 33 dB will give workers too much protection. This is called overattenuation. Overattenuation can make workers feel socially isolated, can make communication difficult, and often results in workers being resistant to using HPDs.
Table 4. HPD NRR levels needed to prevent full-shift average exposures >85 dBA
| Trade | NRR Needed |
|---|---|
| Sheetmetal worker | 12 |
| Insulation worker | 12 |
| Electrician | 12 |
| Carpenter | 14 |
| Cement mason | 14 |
| Ironworker | 18 |
| Masonry trades | 20 |
| Laborer | 24 |
| Operating engineer | 24 |
The low HPD use times measured in this study are probably due to a combination of a lack of adequate worker education, low availability of appropriate HPDs, overattenuation, and perceived barriers to use. These factors can be overcome through the following actions:
- Better hearing loss prevention training, covering when and where workers might be overexposed to noise, and what workers can do to reduce their own exposures.
- Additional training on the selection, use, and proper fit of HPDs.
- Provision of at least two different types of HPD (preferably one earmuff and one earplug) at convenient locations on each jobsite, so that workers can select an HPD of their preference. HPDs must be provided free to overexposed workers.
- Provision of HPDs with the appropriate amount of attenuation. Overattenuation can block desired sounds and prevent communication, while too little attenuation can result in an overexposure situation despite the use of HPDs.
- Posting of signs around areas or operations where HPDs are required
- Strict enforcement of HPD use during high noise exposures.
More information on the WISHA requirements for a Hearing Loss Prevention Program can be found online at http://www.lni.wa.gov/Safety/Topics/AtoZ/NoiseHearing/default.asp.
CONCLUSIONS
This study found that:
- Construction workers were exposed over 85 dBA in about 70% of work shifts using the NIOSH exposure standard, and in about 30% of shifts using the less-protective WISHA exposure standard. Overall, the mean full-shift average NIOSH exposure level was 87.4 ± 5.8 dBA, and the mean full-shift WISHA level was 82.1 ± 5.7 dBA. All but one trade (insulation worker) had a mean full-shift average NIOSH exposure level above 85 dBA, while only one trade (ironworker) had a mean full-shift average WISHA exposure level of 85 dBA or more. Even “quiet” trades like electricians had a substantial percentage of measured workshifts that exceeded 85 dBA when measured using either standard.
- On average, construction workers were able to achieve attenuation that was greater than half of the labeled Noise Reduction Rating (NRR) for the earplug they used. However, variability between subjects was very large: some workers achieved even more attenuation than the NRR, while some achieved almost none. Proper training on HPD fit and use can help insure that all subjects receive adequate attenuation from their HPD.
- Although construction workers can attain good noise exposure attenuation using hearing protection devices, HPDs were worn less than 20% of the time when exposure levels were over 85 dBA. As a result of this low use time, workers achieved an average of less than 3 dB of noise reduction in a full-shift exposure. Overall, less than one in five shifts was brought down to safe levels (below 85 dBA) through the use of HPDs. However, the two trades with fairly high usage times gained enough protection to reduce their mean exposure levels below the NIOSH REL.
- Workers were far more likely to report HPD use during high noise exposure on annual questionnaires than they reported using HPDs during dosimetry measurements. Nearly half of workers reported “always” wearing HPDs on the questionnaire, but they actually wore them only one-third of the time they were exposed above 85 dBA. Reliance on occasional self-reported HPD use is not an adequate strategy for auditing HPD use, and more frequent reporting – or, even better, direct observation – of HPD use is needed.
This study demonstrated that the exposure reduction afforded to construction workers by their hearing protection is currently small, and that workers remain at high risk of hearing loss despite the industry’s previous efforts aimed at getting workers to use hearing protection. Additional hearing loss prevention efforts – especially implementing noise controls and providing additional hearing loss prevention training – are needed to reduce the risk of noise- induced hearing loss among construction workers.
ADDITIONAL RESOURCES
- University of Washington Trade-Specific Construction Noise Pamphlets and Brochures http://depts.washington.edu/occnoise/
- University of Washington Construction Noise and Hearing Loss Reports http://www.lhsfna.org/index.cfm/occupational-safety-and-health/noise/cncp-neitzel/
- Best Practices Guide for Noise Control in Construction http://www.lhsfna.org/index.cfm/occupational-safety-and-health/noise/noise/
- NIOSH Hearing Protector Selector http://www2a.cdc.gov/hp-devices/hp_srchpg01.asp
- WISHA Noise Reduction Ideas Bank http://wisha-training.lni.wa.gov/training/presentations/STSFinal5-10-05.ppt
- Build It Smart Construction Hearing Loss Prevention Training http://builditsmart.org/hearing/training.ppt
- Excel spreadsheet for combining task durations and levels to estimate full-shift exposure http://www.hse.gov.uk/noise/calculator.htm
APPENDIX: TASK- AND TOOL-SPECIFIC AVERAGE NOISE LEVELS AND HPD USE BY TRADE
Note: For all trades, “NA” means data not available, and “% Time HPDs Worn When Needed” means the percentage of time HPDs were worn when exposure levels exceeded 85 dBA.
Carpenters
| TASK | Average Noise Level for each task event (dBA) | % Time HPDs Worn When Needed |
|---|---|---|
| Operating work vehicle | 80.1 | 0% |
| Break, rest, lunch, cleanup | 87.8 | 28% |
| Shop work | 88.8 | 27% |
| Interior finish | 89.4 | 24% |
| Manual material handling | 89.4 | 36% |
| Layout | 90.5 | 14% |
| Wood framing | 91.0 | 30% |
| Building forms | 92.9 | 62% |
| Stripping forms | 94.8 | NA |
| Welding | 94.9 | NA |
| "Other" tasks | 95.3 | 52% |
| TOOL | Average Noise Level for each tool event (dBA) | % Time HPDs Worn When Needed |
|---|---|---|
| No tool | 89.1 | 38% |
| Other hand power tool | 90.1 | 11% |
| Powder actuated tool | 90.7 | 100% |
| Stationary power tool | 91.3 | 3% |
| Hammer, mallet, sledge, nailgun | 91.6 | 48% |
| Chopsaw | 92.0 | 85% |
| Hand power saw | 92.3 | 38% |
| Screw gun, drill motor | 92.5 | 48% |
| "Other" tools | 93.1 | 0% |
| Welding and cutting equipment | 94.9 | NA |
| Rotohammer | 95.1 | 53% |
Cement Masons
| TASK | Average Noise Level for each task event (dBA) | % Time HPDs Worn When Needed |
|---|---|---|
| Floor leveling | 70.4 | 0% |
| Break, rest, lunch, cleanup | 83.3 | 0% |
| Finishing concrete | 84.4 | 0% |
| Setting forms | 86.5 | 0% |
| Manual material handling | 86.5 | 7% |
| Placing concrete | 87.8 | 68% |
| Repairing concrete | 88.9 | 5% |
| Patching concrete | 92.6 | 6% |
| "Other" tasks | 93.1 | 21% |
| Grinding | 95.2 | 11% |
| TOOL | Average Noise Level for each tool event (dBA) | % Time HPDs Worn When Needed |
|---|---|---|
| "Other" tools | 87.2 | 0% |
| Other hand powered tool | 90.8 | 30% |
| No tool | 91.2 | 2% |
| Chipping gun | 94.6 | 33% |
| Hammer, mallet, sledge | 94.7 | 2% |
| Hand power saw | 96.6 | 100% |
Electricians
| TASK | Average Noise Level for each task event (dBA) | % Time HPDs Worn When Needed |
|---|---|---|
| Operating work vehicle | 79.2 | 0% |
| Sheet metal work | 81.6 | NA |
| Metal material handling | 86.5 | 1% |
| Panel wiring, installing fixtures | 87.0 | 66% |
| Break, rest, lunch, cleanup | 87.0 | 7% |
| "Other" tasks | 90.5 | 12% |
| Installing slab conduit | 91.0 | 15% |
| Installing wall conduit | 91.1 | 18% |
| Installing cable tray | 91.8 | 0% |
| Pulling wire | 95.6 | 2% |
| Installing trench conduit | 95.8 | 0% |
| TOOL | Average Noise Level for each tool event (dBA) | % Time HPDs Worn When Needed |
|---|---|---|
| Other hand power tool | 84.4 | 0% |
| Screw gun, drill motor | 86.3 | 9% |
| No tool | 86.6 | 9% |
| "Other" tools | 87.1 | 100% |
| Hand power saw | 88.0 | 0% |
| Rotohammer | 89.2 | 39% |
| Chopsaw | 90.7 | 0% |
| Hammer, mallet, sledge | 91.8 | 0% |
| Chipping gun | 94.2 | NA |
| Powder actuated tool | 103.0 | NA |
Insulation Workers
| TASK | Average Noise Level for each task event (dBA) | % Time HPDs Worn When Needed |
|---|---|---|
| Sheet metal work | 77.8 | 0% |
| Applying insulation by hand | 83.0 | 6% |
| Break, rest, lunch, cleanup | 83.3 | 0% |
| "Other" tasks | 83.4 | 56% |
| Manual material handling | 84.6 | 0% |
| TOOL | Average Noise Level for each tool even (dBA) | % Time HPDs Worn When Needed |
|---|---|---|
| Staple gun, stapler | 79.4 | 0% |
| Manlift, lift equipment | 81.4 | 0% |
| No tool | 82.8 | 27% |
| Other hand powered tool | 84.4 | 0% |
| Hammer, mallet, sledge | 84.8 | 0% |
| Screw gun, drill motor | 85.1 | 0% |
| "Other" tools | 85.3 | 0% |
| Hand power saw | 89.3 | 0% |
| Welding, cutting equipment | 93.2 | 0% |
Ironworkers
| TASK | Average Noise Level for each task event (dBA) | % Time HPDs Worn When Needed |
|---|---|---|
| Operating forklift | 87.1 | NA |
| Setting forms | 87.9 | NA |
| Operating work vehicle | 88.5 | 58% |
| Erecting Iron | 91.8 | 6% |
| Grinding | 91.9 | 0% |
| Rigging | 93.6 | 0% |
| Bolt up | 93.7 | 53% |
| Manual material handling | 94.3 | 0% |
| "Other" tasks | 94.7 | 0% |
| Tying and placing rebar | 95.5 | 0% |
| Break, rest, lunch, cleanup | 95.6 | 0% |
| Welding and burning | 98.4 | 6% |
| Laying metal deck | 99.6 | 75% |
| TOOL | Average Noise Level for each tool event (dBA) | % Time HPDs Worn When Needed |
|---|---|---|
| Chipping gun, scaler | 89.7 | 0% |
| Rattle gun | 92.1 | 0% |
| Welding, cutting equipment | 94.0 | 4% |
| Hammer, mallet, sledge | 94.3 | 26% |
| "Other" tools | 94.9 | 0% |
| Hand power saw | 95.0 | NA |
| No tool | 96.7 | 10% |
| Screw gun, drill motor | 97.4 | 0% |
| Chopsaw | 98.3 | 29% |
Laborers (Note: no HPD use data colledted)
| TASK | Average Noise Level for each task event (dBA) |
|---|---|
| Layout | 80.1 |
| Manual material handling | 82.7 |
| Interior finish | 85.2 |
| Operating forklift | 85.3 |
| Finishing concrete | 85.3 |
| Grouting | 86.1 |
| Wood framing | 86.5 |
| Floor leveling | 87.5 |
| Placing concrete | 91.5 |
| Stripping forms | 91.7 |
| Building forms | 92.1 |
| Break, rest, lunch, cleanup | 92.3 |
| Rigging | 92.6 |
| "Other" tasks | 95.4 |
| Demolition | 99.3 |
| Clipping concrete | 102.9 |
| TOOL | Average Noise Level for each tool event (dBA) |
|---|---|
| Screw gun, drill motor | 85.8 |
| Hand power saw | 87.9 |
| Stationary power tool | 88.2 |
| Chopsaw | 88.2 |
| Hammer, mallet, sledge | 90.2 |
| "Other" tools | 91.8 |
| No tool | 92.8 |
| Rotohammer | 95.8 |
| Rattle gun | 98.4 |
| Clipping gun | 103.0 |
Masonry Trades (including bricklayers, masonry restoration workers, and tilesetters)
| TASK | Average Noise Level for each task event (dBA) | % Time HPDs Worn When Needed |
|---|---|---|
| Bricking, blocking, tiling | 90.2 | 32% |
| Break, rest, lunch, cleanup | 86.4 | 27% |
| Forklift operation | 88.5 | 100% |
| Grinding | 97.0 | 49% |
| Grouting, tending, mortaring | 91.4 | 9% |
| Manual material handling | 88.4 | 14% |
| "Other" task | 94.4 | 58% |
| Pointing, cleaning, caulking | 91.6 | 72% |
| Weatherproofing | 84.2 | 0% |
| Work vehicle operation | 96.3 | 71% |
| TOOL | Average Noise Level for each tool event (dBA) | % Time HPDs Worn When Needed |
|---|---|---|
| Hammer, mallet, sledge | 89.1 | 13% |
| Hand power saw | 96.9 | 63% |
| No tool reported | 87.9 | 42% |
| Other hand power tool | 96.9 | 17% |
| "Other" tool | 94.7 | 39% |
| Powder actuated tool | 88.5 | 18% |
| Rotohammer | 96.6 | 66% |
| Screw gun, drill motor | 90.6 | 12% |
| Stationary power tool | 97.8 | 62% |
| Welding, cutting equipment | 87.1 | 0% |
Operating Engineers
| TASK | Average Noise Level for each task event (dBA) | % Time HPDs Worn When Needed |
|---|---|---|
| Break, rest, lunch, cleanup | 85.7 | 42% |
| Rigging | 86.6 | NA |
| "Other" tasks | 86.9 | 52% |
| Layout | 89.3 | NA |
| Grade Checking | 89.6 | 0% |
| Welding | 91.2 | NA |
| TOOL | Average Noise Level for each tool event (dBA) | % Time HPDs Worn When Needed |
|---|---|---|
| General equipment | 85.4 | 100% |
| Grader | 86.4 | 100% |
| Tower crane | 87.0 | 0% |
| Mobile crane | 87.9 | 100% |
| Compactor, roller | 88.2 | NA |
| Backhoe | 89.3 | NA |
| Forklift | 89.4 | 67% |
| Excavator | 90.0 | 48% |
| Welding, cutting equipment | 91.2 | NA |
| Loader | 93.0 | 100% |
| Manlift | 98.1 | NA |
| Scraper | 99.1 | 100% |
| Bulldozer | 100.2 | 100% |
Sheet Metal Workers
| TASK | Average Noise Level for each task event (dBA) | % Time HPDs Worn When Needed |
|---|---|---|
| Break, rest, lunch, cleanup | 81.0 | 7% |
| Operating work vehicle | 82.6 | 0% |
| "Other" tasks | 83.6 | 66% |
| Maintaining metal products | 86.1 | 86% |
| Fabricating metal products | 87.8 | 93% |
| Installing metal products | 88.2 | 21% |
| Manual material handling | 90.2 | 83% |
| TOOL | Average Noise Level for each tool event (dBA) | % Time HPDs Worn When Needed |
|---|---|---|
| Hand power saw | 83.8 | 100% |
| Rotary, squaring shears | 84.6 | 3% |
| Other hand power tool | 84.7 | 4% |
| Welding, cutting equipment | 84.8 | 100% |
| Rotohammer | 85.5 | 12% |
| Stationary power tool | 86.0 | 100% |
| None reported | 87.4 | 74% |
| Screw gun, drill motor | 88.0 | 25% |
| "Other" tools | 88.4 | 88% |
| Hammer, mallet, sledge | 90.9 | 39% |