
Summary Statement
A multifaceted study of occupational safety culture and habits in the Irish construction industry.
2002
One of the main objectives of this study was to investigate which factors are associated with compliance with safety procedures and requirements. Can the sites be differentiated by how well the ratings of the management system correlate with safety compliance? What association do safety behaviors and attitudes have with either management factors or compliance? The first step in this analysis was to establish how the many variables that were measured in the observation of compliance and in the safety management interviews related to each other. Once these main factors were established, it was then possible to investigate the correlation between the different types of variables. Only the main significant relationships are reported here. Many statistical analyses were carried out to explore a wide range of possible relationships between variables. The vast majority of these were not statistically significant and are not reported here, primarily for reasons of space.
The first step taken was to check for any pattern of relationships among the different variables of the observational study. A factor analysis technique is useful here, as it will allow us to discover if some variables tend to correlate better with themselves than with some others, so that they form identifiable groups. Three groups of related variables were found in the study when considering the compliance items (see table 20 below).| Factor 1 of noncompliance |
| ladders not tied |
| unguarded openings |
| unsafe storage of materials |
| missing boards on scaffolds (not toeboards) |
| trapped boards on scaffolds |
| missing toeboards on scaffolds |
| missing guardrails on scaffolds |
| Factor 2 of noncompliance |
| not external use of head PPE |
| not internal use of head PPE |
| not safe use of ladders |
| not wearing of viz vest |
| rubbish on scaffolds (lifts) |
| Factor 3 of noncompliance |
| rubbish on access routes |
| no defined plant routes |
| unsafe storage of materials |
The first factor includes a range of items mostly related to working at height (ladders not tied, unguarded openings, and the condition of scaffolds) but also includes storage of materials. The second factor is mainly concerned with safe behavior (use of personal protective equipment, use of ladders, and visibility vests). The third factor concerns access routes and interference by rubbish and unsafe storage.
Of the three factors, only the first one shows significant relationships with other variables in the research. In order to reduce the size of the report, only relationships for this factor will be described below.
Correlation indexes were calculated between Compliance-Factor 1, the fall prevention measure in the observational research (table 13 page 32) and the overall safety performance when all observed items are averaged together. Correlation between the three groups are all significant, with R= .86 for the overall safety performance, and R= .98 for the measure of falls prevention [see table 21 below]. These high levels of correlation are indicative that this factor of compliance can be used as a representative one for evaluating compliance with safety on site. Consequently it will be named as "Factor of noncompliance with safety."
| Correlation Coefficients between factors | |||
| Noncompliance | Overall | Fall | |
| Noncompliance | 1.0000
P= . |
.8602 P= .000 |
.9780
P= .000 |
| Overall Safety Performance | .8602
P= .000 |
1.0000 P= . |
.8169 P= .000 |
| Fall Prevention Performance | .9780
P= .000 |
.8169 P= .000 |
1.0000
P= . |
A similar procedure of factor analysis was used for the management survey. It was found that two factors accounted for the main findings at the managerial level. The factors and their variables can be seen in table 22 below. Although these factors have a non-significant correlation with each other, the level of correlation obtained (R= .36, p= .146) is not negligible. The small number of sites makes it more difficult to reach a significant result.
| Factor 1: Management System |
| Quality of the communication |
| Philosophy of the company |
| Training of operatives |
| Training of managers |
| Commitment with cooperation |
| Plan of action |
| Quality of cooperation |
| Frequency of audits |
| Factor 2: Effectiveness of the management system |
| Effectiveness of audits to redirect organizational action |
| Effectiveness of hazard reporting to redirect organizational action |
R= .3572 (p= .146) |
The first factor is a general factor including diverse aspects of the safety management system (communication, training, cooperation, planning, audits, safety philosophy). Factor 2 contains two items both reflecting how effective was the response to either audits or reports of hazards.
Outliers, extreme cases and highly untypical results in management and compliance factors were examined. Two sites had to be removed from further analysis due to these anomalous data. Removal of site 8 was based on previous observation of a particular management system that could be guaranteeing compliance but could not be explained by the management variables used in our research. Site number 9 was removed because of its extreme values, but also because some of those values were related to single items (1 ladder = 100% noncompliance; 1 opening = 100% noncompliance) seen on site. Site 9 was not believed to give a reliable indication of compliance.
Correlation indexes for each management factor against the noncompliance factor for the 16 sites were calculated (see columns 2, 3 and 4 in table 23). Effectiveness of the management system (Management-Factor 2) correlates significantly with the level of noncompliance found on site (r = -.66; p= .005). Management system (Management-Factor 1) reached a moderately low correlation which was not significant but had a positive tendency in the predicted direction (r = -.27; p= .31).
Another significant relationship found in the study concerns the presence of a Safety representative on site (see column 5 in table 23). In comparison to other safety related roles, those sites with safety representatives show significant lower levels of noncompliance (r = -.78; p= .000). That relationship is even bigger than the one found between Effectiveness of the management system and Noncompliance. There is a modest relationship between the general management system factor and the presence of a safety representative on site but this is just short of statistically significance (r = .49; p= .054).
View table 23
Furthermore, workers' preferred behavior when facing risky situations was also correlated with safety compliance and the management system factors (see columns 6 to 9 in table 23). It was found that no behavior relates significantly with either the management system or with compliance levels. On the other hand, the presence of the safety representative correlates significantly with the behavior of reporting and continuing work. When a safety representative is present on site, behaviors of reporting are enhanced (r = .50), while behaviors of continuing working are minimized (r = -.48).
Figure 19 provides a graphical summary of these significant findings (and includes the near significant relationship between the general safety management factor and the presence of a safety representative). It should be noted that these are bivariate relationships -i.e. correlation between each pair of variables assesses independently of each other. However, in the real world, these relationships are not independent. For example, the correlation of 0.79 between the presence or absence of a Safety representative on site and Non-compliance with safety is probably not independent of the relationship between the Safety representative variable and Effectiveness of the management system (Factor 2) and Non-compliance with safety (r = -.66).
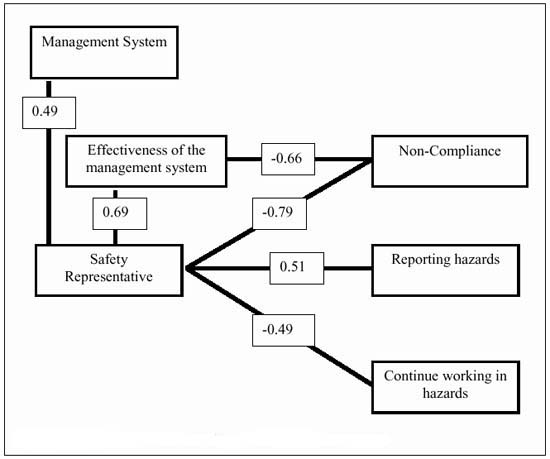
Figure 19: A model of bivariate significant relationships in this research
In order to examine the underlying structure of these relationships these variables were entered into a multiple regression equation. This parcels out the correlation between each pair of variables taking into account the relationships between the other variables within the other variables within the equation which may overlap. In this equation the only two significant variables, Effectiveness of the management system and Safety representative on site, were entered into the equation with Noncompliance with safety being the dependent variable. In other words, this was the strongest test of hypothesis concerning which variables predict or are associated with noncompliance with safety. The outcome of this demonstrated that only one variable -the presence or absence of a safety representative-was significantly related to compliance with safety. The presence of a safety representative is strongly associated with better safety compliance.
Summary
Factor analysis identified a general factor of safety compliance with two smaller factors (the latter two had no significant associations with any other variables). The management interviews generated a general factor relating to the safety management system and a more specific factor related to the effectiveness of the system in responding to audits and hazards. Figure 19 illustrates the significant relationships, which have been found following the removal of two untypical sites from the analysis. The strongest relationship with the main safety compliance factor is with the presence or absence of a safety representative. A safety representative on site is associated with better compliance. The only other factor that is associated with compliance is the second safety management factor - Effectiveness of response to audits and hazard reports. The general Safety management factor is not significantly associated with safety compliance, but does have a modest relationship with the presence of a safety representative (this is just short of statistical significance). The presence of a safety representative is the only factor which is significantly related to safety behaviors - safety representatives are associated with a greater likelihood of reporting risky situations and a lower likelihood of simply continuing working in such situations. The presence of a safety representative is also strongly related to the effectiveness of response to audits and reported hazards. This pattern of relationships suggests that safety representatives are the most important influence on the association between effectiveness of response to audits and hazards and safety compliance. To otherwise conclude that the influence of the safety representative is masked by the management system would be an erroneous one. When a regression analysis is carried out using management variables and safety representation, only the presence of the safety representative remains as predictive variable. This result will favor the conclusion that the relationship between Effectiveness of response to audits and hazard reports (management-Factor 2) and safety compliance is modulated by the presence of the safety representative in site.
Back to Contents