
Summary Statement
A broad collection of tables and charts covering health and safety in the U.S. construction industry, as well as considerable economic and training data.
2007
Section 49: Workers’ Compensation in Construction and Other Industries
Workers' compensation programs vary among the states. With no nationwide standard, documenting spending, benefits, and other features of workers' compensation is difficult. However, the available data show that the costs associated with work-related injuries and illnesses make the construction industry one of the most expensive of all U.S. industries.
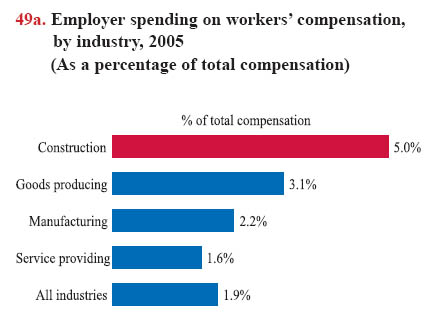
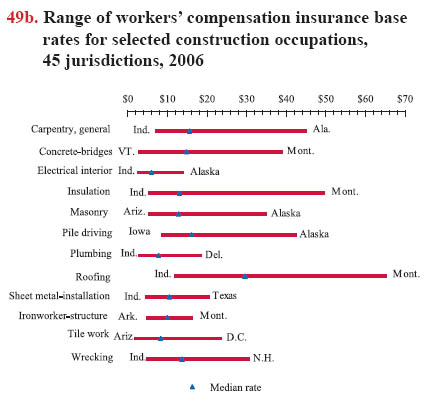
Employers in construction spend more on workers' compensation than employers in any other industry. In 2005, 5% of employer costs in construction were spent on workers' compensation (chart 49a); more than double the costs for manufacturing employers, and nearly three times the average cost for employers in all industries. (Employer costs consist of workers' compensation premiums, except for self-insured companies, which may make direct payments or set funds aside to cover potential losses or to meet self-insurance requirements.) In 2005, construction workers received workers’ compensation benefits in slightly greater numbers than workers in all industries nationwide. 1Workers' compensation insurance rates in construction vary widely among jurisdictions as well as occupations. In 2006, the workers' compensation insurance rate per $100 of payroll for roofing (all kinds) was $64.88 in Montana and $12.00 in Indiana, while the rate for insulation work was $25.92 and $5.64 in the two states, respectively (chart 49b). These data published by the magazine ENR (Engineering News Record) are compiled from state rate manuals.
In attempts to control costs, the workers' compensation system has been revised and reformed repeatedly. Over the past two decades such changes have resulted in tightened fee schedules, limits on physician choice, eligibility restrictions, and lowered benefits.2 In some states, workers whose disability resulted from hazardous workplace exposures are required to prove that the workplace was the primary source of the disability. Pursuing such claims places a costly burden on workers, forcing them to spend money and time on health care and legal consultations with uncertain prospects for reimbursement. Requiring such proof may discourage workers from pursuing these claims at all, ultimately reducing the number of workers who qualify for workers' compensation benefits.
In other cost-cutting efforts, some states have "carved out" alternative programs as another choice in providing workers' compensation insurance. With this approach, management and labor can create a more efficient, non-adversarial climate for handling workers' compensation cases and claims administration. The program uses an agreed-upon list of health care providers, a labor-management safety committee, a light-duty/modified-job return-to-work program, and a separate dispute resolution system. Ten states have either passed laws or revised regulations to allow contractors signatory to collective bargaining agreements to enter into a negotiated workers' compensation program with the union.3 Fifteen states have permissive, partial or total allowances for the creation of these programs, but these states do not have laws or regulations specific to a program.4 For example, Rhode Island's labor code reads that "[a]ny employer may enter into an agreement with his or her employees" and that the program must have the approval of the director and the chief judge of the workers' compensation court. Legislators in the 35 remaining states have varying degrees of interest in carve-out programs.
Nationwide, construction compensation insurance rates appear to have dropped in recent years, however medical and indemnity costs continue to soar in many regions. Annually, workrelated injuries in construction cost $1.36 billion (2002 dollars) for medical care alone. Overall, for all construction workers, 46% of total medical expenses for work-related injuries were paid by workers' compensation (chart 49c). For injured Hispanic construction workers, only 27% of medical costs were paid by workers' compensation, much less than the 50% paid for white, non- Hispanics. The rest was paid by workers and their families or by other public or private sources, subsidizing workers' compensation medical coverage by at least $734 million per year in construction. 5 It has been estimated that workers' compensation failed to cover roughly $8 billion to $23 billion (1999 dollars) in annual medical costs for all industries, based on comparisons with illness and injury incidence reported in epidemiological studies.6
49c. Sources of payment for work-related injuries in construction, 1996-2002
| Source | All construction | Hispanic | White, Non-Hispanic | Total Construction |
| Percent | Percent | Percent | Sum (in millions) |
|
| Out-of-pocket | 8.7% | 23.0% | 5.9% | $118.7 |
| Workers' compensation | 46..2% | 26.8% | 49.5% | $630.4 |
| Private insurance | 31.8% | 45.7% | 29.9% | $433.9 |
| Medicare | 0.2% | 0.0% | 0.2% | $2.7 |
| Medicaid | 0.4% | 0.1% | 0.5% | $5.5 |
| Other sources | 12.2% | 4.1% | 12.9% | $166.5 |
| Total Expenditure per injured worker per year | $1694.6 (100%) | $1,896.6 (100%) | $1,687.4 (100%) | |
| Total expenditures in construction (in millions) |
$290.6 (21.3%) | $914.1 (67.1%) | $1,364.4 (100%) |
Download MS PowerPoint versions of Charts
1. U.S. Census Bureau, Current Population Survey, 2006 March Supplement. Calculations by CPWR Data Center.
2. Amy Widman. 2006. Workers' Compensation: A Cautionary Tale. The Center for Justice and Democracy, http://centerjd.org/lib/Workers'Comp(National).pdf (Accessed November 2007); Martha T. McCluskey. 1998. The Illusion of Efficiency in Workers' Compensation 'Reform.' Rutgers Law Review, 50(657):714.
3. The 10 states with legislative authority are: California, Florida, Hawaii, Massachusetts, Maryland, Maine, Kentucky, Minnesota, New York, and Pennsylvania (William Gregory, Ulico Insurance Group, personal communication, October 2007).
4. Those with permissive, partial or total allowance are: Alabama, Colorado, Connecticut, Delaware, Georgia, Indiana, Missouri, Mississippi, Nebraska, Oklahoma, Rhode Island, South Dakota, Utah, Wisconsin, and West Virginia (William Gregory, Ulico Insurance Group, personal communication, October 2007).
5. Xiuwen Dong, Knut Ringen, Yurong Men, and Alissa Fujimoto. 2007. Medical Costs and Sources of Payment for Work-Related Injuries among Hispanic Construction Workers. Journal of Occupational and Environmental Medicine, 49(12):1367-1375.
6. J. Paul Leigh and John A. Robbins. 2004. Occupational Disease and Workers' Compensation: Coverage, Costs, and Consequences. The Milbank Quarterly, 82(4), 689-721.
Note:
Chart 49a - Data cover the private sector only. Employer costs are workers' compensation premiums for firms that buy insurance or, for self insured employers, administrative expenses plus payments to workers, their survivors, and health care providers.
Chart 49b - Rates per $100 of payroll, were in effect September 9, 2006. Listings do not include Maine and Nevada. The median is the midpoint: half the jurisdictions in the survey charge more and half charge less. For instance, for plumbing, the rate of $6.26 in Mississippi is the median. (The listing does not include all categories for the 45 jurisdictions.)
Chart 49c - "All construction" column represents the average for per injured worker per year during the study period and includes workers in other races and ethnicities (e.g., black). "Total Construction" column represents the weighted sum for all construction and includes workers in other races and ethnicities (e.g., black). "Other sources" includes TRICARE, CHAMPVA, VA, and other federal and state or local public sources, and sources unknown. Totals may not add to 100% due to rounding.
Source:
Chart 49a - U.S. Bureau of Labor Statistics, 2005 National Compensation Survey – Compensation Cost Trends, http://www.bls.gov/ncs/ect/ (Accessed November 2007).
Chart 49b - Pam Hunter. 2006. Workers' Comp Steadies. ENR (Engineering News-Record), 257(12):32-33.
Chart 49c - Xiuwen Dong, Knut Ringen, Yurong Men, and Alissa Fujimoto. 2007. Medical Costs and Sources of Payment for Work-Related Injuries among Hispanic Construction Workers. Journal of Occupational and Environmental Medicine, 49(12):1367-1375. Table 5, based on data from the Medical Expenditure Panel Survey, 1996-2002.
Back to Table of Contents