
Summary Statement
A broad collection of tables and charts covering health and safety in the U.S. construction industry, as well as considerable economic and training data.
2007
Section 40: Musculoskeletal Disorders in Construction and Other Industries
Work-related musculoskeletal disorders (WMSD) are injuries of the muscles, tendons, joints, and nerves caused or aggravated by work. Examples of WMSDs are joint sprains, muscle strains such as back or neck strain, inflamed tendons (called “tendonitis”) such as tennis elbow or rotator cuff syndrome, carpal tunnel syndrome, and herniated discs of the neck or lower back. Workers are at risk of developing WMSDs if they are exposed to a combination of physical force and repetitive motion, awkward or static body postures, heavy lifting of materials, contact stress, vibration, or extreme temperatures.1 A worker with a WMSD may face days away from work as well as chronic health problems.
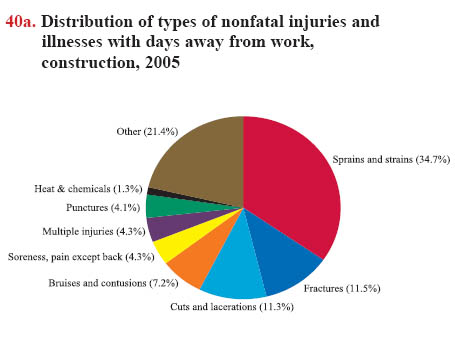
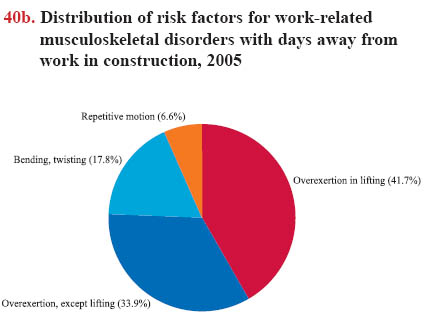
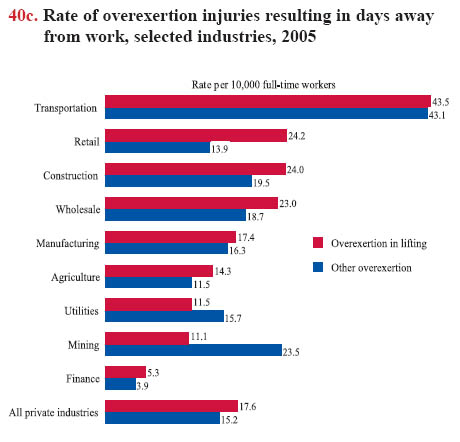
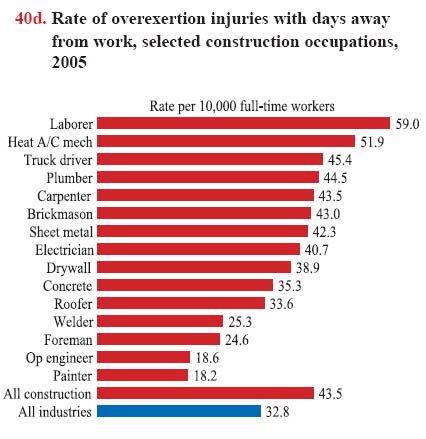
The physically demanding nature of construction work helps explain why strains and sprains are the most common type of injury resulting in days away from work in construction. In 2005, nearly 35% of all nonfatal injuries and illnesses in the construction industry resulting in days away from work were due to sprains and strains (chart 40a). Cross-sectional studies also have reported a high prevalence of WMSDs among construction workers.2Overexertion is the leading cause of WMSDs among construction workers. In 2005, overexertion when lifting caused 42% of the WMSDs with days away from work in construction. Other types of overexertion, such as pushing, pulling, and carrying, caused an additional 34% of WMSDs (chart 40b). The rate of overexertion injuries in construction is exceeded only by the rate in the transportation industry (chart 40c). In general, construction workers have higher rates of overexertion injuries with days away from work than the rate for all workers combined, but the rates vary widely among construction occupations (chart 40d).
Ergonomic solutions may help to reduce overexertion and, therefore, the risk of WMSDs. The construction industry has been slower to embrace these solutions than other industries. For example, many factories have reduced the weight of materials that are lifted by workers to less than 50 pounds. In contrast, loads weighing 80 pounds or more are commonly handled by workers at construction sites. Workers may not even pause to consider the risk of performing heavy lifting or carrying tasks, until they have suffered an injury. In reality, 80-pound loads should be the exception, not the rule. While a well-conditioned male may be able to safely lift an 80-pound load on occasion, the Liberty Mutual Manual Materials Handling Tables3 indicate less than 13% of men, and even fewer women, can do so repeatedly without increased risk of sustaining a WMSD. Redesigning jobs to lighten loads and eliminate repeated heavy lifting can help reduce cases of WMSDs caused by overexertion in construction.
Download MS PowerPoint versions of Charts
1. Musculoskeletal Disorders and the Workplace: Low Back and Upper Extremities. 2001. Panel on Musculoskeletal Disorders and the Workplace, Commission on Behavioral and Social Sciences and Education, National Research Council and Institute of Medicine. National Academy Press, Washington, D.C.
2. Göran Engholm and Eva Holmström. 2005. Dose-Response Associations between Musculoskeletal Disorders and Physical and Psychosocial Factors among Construction Workers. Scandinavian Journal of Work, Environment, and Health, 31(2):57-67.
3. Liberty Mutual Manual Materials Handling Tables, http://libertymmhtables.libertymutual.com/CM_LMTablesWeb/taskSelection.do?action=initTaskSelection (Accessed November 2007).
Note:
All charts - Data cover the private sector only and exclude the self-employed.
Chart 40a - Total may not add up to 100% due to rounding.
Source:
Chart 40a - U.S. Bureau of Labor Statistics, 2005 Survey of Occupational Injuries and Illnesses, Table R49, www.bls.gov/iif/oshcdnew.htm (Accessed November 2007).
Chart 40b - U.S. Bureau of Labor Statistics, 2005 Survey of Occupational Injuries and Illnesses, Table R64, www.bls.gov/iif/oshcdnew.htm (Accessed November 2007).
Chart 40c - U.S. Bureau of Labor Statistics, 2005 Survey of Occupational Injuries and Illnesses, Table R8, www.bls.gov/iif/oshcdnew.htm (Accessed November 2007).
Chart 40d - U.S. Bureau of Labor Statistics, 2005 Survey of Occupational Injuries and Illnesses, 2005 Current Population Survey. Calculations by CPWR Data Center.
Back to Table of Contents