
Summary Statement
A broad collection of tables and charts covering health and safety in the U.S. construction industry, as well as considerable economic and training data.
2007
Section 3: Payroll and Nonemployer (without Payroll) Establishments in the Construction Industry
The construction industry consists almost entirely of small establishments. In 2002, of the 710,307 establishments with payroll, about 79% had fewer than 10 employees (chart 3a). The largest payroll establishments in the industry, which have 500 or more employees, were well under 1% of the total, although they employed 8.4% of the industry's payroll employees. Payroll establishments were less than 26% of all construction establishments in 2002, but produced more than 91% of the dollar value of business done in the construction industry.
The U.S. Census Bureau's definition of "establishment" for nonemployer (known as "without payroll," see Glossary) is one that has no paid employees, has annual business receipts of $1,000 or more ($1 or more in the construction industry), and is subject to federal income taxes. The Census Bureau excludes establishments from this category if they have receipts above a predetermined cutoff of $1 million for corporations and partnerships and $2 million for service-type industries, assuming that they have paid employees. (For sole proprietorships, the Census Bureau's cutoff varies greatly depending upon industrial classification.)Each distinct business income tax return filed by a nonemployer business is counted as an establishment. Nonemployer businesses may operate from a home address or a separate physical location. Nonemployers are typically self-employed individuals and they are not surveyed in the Economic Census. Instead, administrative data are compiled from the annual business income tax returns filed with the Internal Revenue Service (IRS) and maintained in the Census Bureau's Business Register. The nonemployer statistics have been released as an annual data series since 1998, separate from the Economic Census reports.
The Census Bureau counted 2.07 million nonemployer establishments in construction in 2002, a 9.6% growth from 1.89 million in 1997. About 92% of nonemployer establishments in construction are sole proprietorships or self-employed (see chart book page 20), and the rest are small corporations (5.5%) and partnerships (2.6%) without paid employees. The dollar value produced by nonemployer establishments totaled $115.3 billion, accounting for 8.7% of the total value produced in the construction industry.
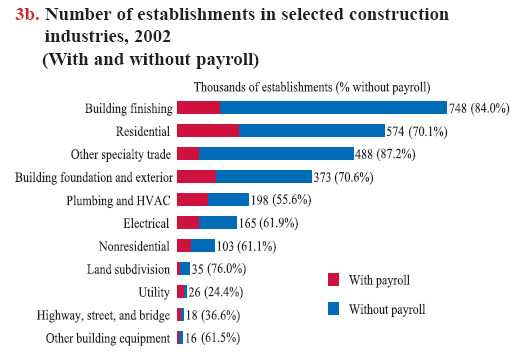
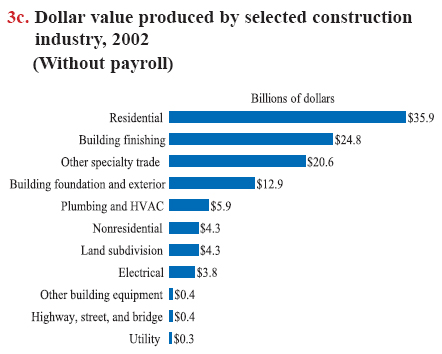
Many specialty trade contractors (NAICS 238) have no paid employees. For instance, in 2002, 84% of 748,100 building finishing contractors (NAICS 2383) were nonemployer establishments. In residential construction (NAICS 2361), about 70% of 574,487 establishments had no paid employees (chart 3b) and produced almost $36 billion in 2002 (chart 3c).
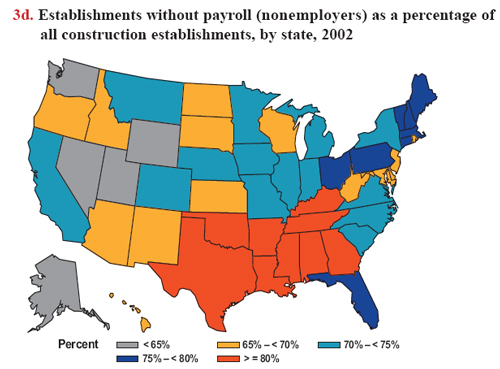
The proportion of nonemployer establishments varies by state. In 2002, establishments without payroll made up 80% or more of all construction establishments in the following nine states (in decreasing order): Tennessee (at 86%), Texas, Mississippi, Arkansas, Kentucky, Oklahoma, Louisiana, Alabama, and Georgia (chart 3d).
3a. Number and percentage of construction establishments and employees, by establishment size, 2002 (Payroll establishments)
| Establishment size (number of employees) | Number of establishments | % of all establishments | Total number of employees | % of all employees |
| 1 to 9 | 562,457 | 79.19% | 1,756,859 | 24.42% |
| 10 to 19 | 78,917 | 11.11% | 1,046,853 | 14.55% |
| 20 to 99 | 60,274 | 8.49% | 2,316,454 | 32.20% |
| 100 to 499 | 8,074 | 1.14% | 1,465,900 | 20.38% |
| 500 or more | 585 | 0.08% | 607,004 | 8.44% |
| Total | 710,307 | 100.00% | 7,193,069 | 100.00% |
Download MS PowerPoint versions of Charts
Note: All charts - Because some classifications have changed with the adoption of the 2002 North American Industry Classification System (NAICS), numbers provided cannot be directly compared with charts in The Construction Chart Book, Third Edition, which used the 1997 NAICS system.
Chart 3a - Data covers the private sector only. Figures may not add up to totals because of rounding. In 2002, payroll establishments totaled 710,307, with 7.2 million employees.
Chart 3b - Number for each category is a combination of establishments with and without payroll. Percent in parentheses for each category represents the percentage "without payroll" (or nonemployer) establishments. Data are matched at the four- or five-digit NAICS level.
Chart 3d - Total of 2,071,317 nonemployer establishments, ranged from 57% to 86% by state.
Source:
Chart 3a - U.S. Census Bureau, 2002 Economic Census, Construction Subject Series, Table 4, October 2005 (EC02-23SG-1), http://www.census.gov/prod/ec02/ec0223sg1t.pdf (Accessed November 2007).
Chart 3b - U.S. Census Bureau, 2002 Economic Census, Summary Statistics, http://www.census.gov/econ/census02/data/us/US000.HTM (Accessed November 2007) for payroll. U.S. Census Bureau, 2002 Economic Census, Core Business Statistics Series, April 2005 (NS02-00A-1), http://www.census.gov/prod/ec02/ns0200a01.pdf (Accessed November 2007) for nonemployer.
Chart 3c - U.S. Census Bureau, Nonemployer statistics, http://www.census.gov/epcd/nonemployer/ (Accessed November 2007).
Chart 3d - U.S. Census Bureau, 2002 Economic Census, Geographic Area Series, Construction, http://www.census.gov/econ/census02/guide/EC02_23.HTM (Accessed November 2007) for payroll. U.S. Census Bureau, Nonemployer Statistics, http://www.census.gov/epcd/nonemployer/ (Accessed November 2007) for nonemployer.
Back to Table of Contents