
Summary Statement
A broad collection of tables and charts covering health and safety in the U.S. construction industry, as well as considerable economic and training data.
2007
Section 37: Fatal and Nonfatal Injuries from Falls in Construction
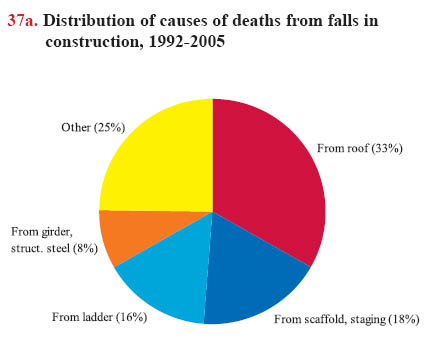
Falls are the leading cause of fatal injuries and the second most common cause of nonfatal injuries in construction. In 2005, falls caused 396 of 1,243 work-related deaths from injuries (32%),1 and 36,360 nonfatal injuries – 23% of the total – resulting in days away from work.2 In the period 1992-2005, on average, falls caused about 363 of all work-related deaths among construction workers annually.1 About one-third of the fatal falls were from roofs and 18% were from scaffolding or staging (chart 37a). In 2005, about 97% of fatal falls in construction were falls to a lower level, while about 3% were other types of falls, including falls to the same level.
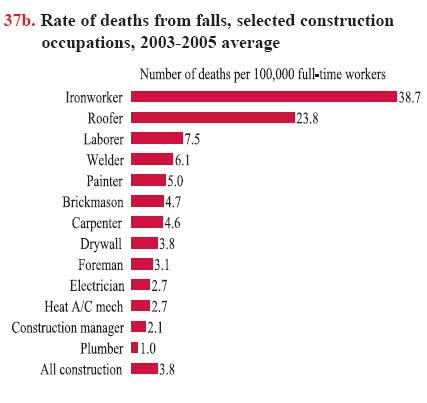
About 20% of deaths coded as fatal falls by the U.S. Bureau of Labor Statistics were actually from collapses, when the surface a worker was standing on collapsed or tipped over (an aerial lift, for example). From 2003 to 2005, 61% of fatal falls from suspended scaffolds and 53% of falls from aerial lifts were caused by collapse of the scaffold or lift.3 These data point to the need for determining the root causes of falls and for developing safety measures specifically aimed at preventing collapses of scaffolds and lifts. Clearly, precautions put in place to prevent falls do not necessarily prevent such collapses.Some construction occupations have much higher rates of deaths from falls than others. For instance, more ironworkers are killed from falls (38.7 per 100,000 full-time workers) than workers in any other construction occupation. The rate of workrelated deaths from falls among ironworkers is 10 times higher than the construction average, and among roofers, about six times higher (chart 37b).4
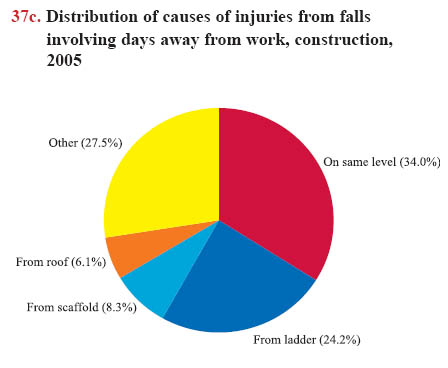
Unlike falls resulting in death, the most common types of nonfatal falls in construction were falls to the same level (34%) and falls from ladders (24%; chart 37c). Although the rate of nonfatal falls has been decreasing in recent years, construction workers in 2005 experienced almost twice the rate of such falls as workers in all industries on average.2 In construction, 60% of nonfatal falls were to a lower level (or 21,750 out of 36,360) compared with natural resources and mining (where 43% of nonfatal falls were to a lower level) and manufacturing (29%). For all industries, falls to a lower level are, on average, 31% of all nonfatal falls.5
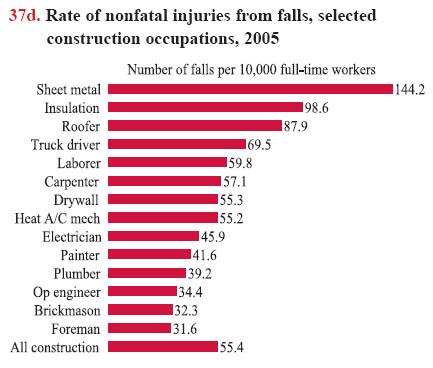
Among construction occupations, in 2005, sheet metal workers had the highest rate of nonfatal work-related injuries from falls at 144.2 per 10,000 full-time workers, followed by insulation workers with a rate of 98.6 per 10,000 full-time workers (chart 37d). Further interventions are needed to reduce deaths and injuries from falls in construction, particularly in these highrisk occupations.
Download MS PowerPoint versions of Charts
1. U.S. Bureau of Labor Statistics, 1992-2005 Census of Fatal Occupational Injuries. Calculations by CPWR Data Center.
2. U.S. Bureau of Labor Statistics, 2005 Survey of Occupational Injuries and Illnesses, Table R75, http://www.bls.gov/iif/oshwc/osh/case/ostb1731.pdf (Accessed November 2007).
3. U.S. Bureau of Labor Statistics, 2003-2005 Census of Fatal Occupational Injuries. Calculations by Michael McCann, CPWR.
4. Because many construction workers work part-time in construction, safety and health statistics are defined in terms of full-time equivalents to allow comparisons with other industries. Full-time work is defined as 2,000 hours worked per year.
5. U.S. Bureau of Labor Statistics, 2005 Survey of Occupational Injuries and Illnesses, Table R64, http://www.bls.gov/iif/oshwc/osh/case/ostb1720.pdf (Accessed November 2007).
Note:
Chart 37a - "Other" fatal falls includes falls through existing floor openings, from nonmoving vehicles, from aerial lifts, etc. In 1992-2005, there was a total of 5,081 work-related deaths from falls.
Chart 37b - Falls caused 1,209 deaths in construction in 2003-2005.
Charts 37b and 37d - Full-time work is defined as 2,000 hours worked per year.
Chart 37c - "Other" causes include jump to a lower level; fall from floor, dock, or ground level; fall from non-moving vehicle; and fall down stairs or steps.
Charts 37c and 37d - Based on 36,360 nonfatal falls. Data cover the private industry only and exclude the self-employed.
Source: Charts 37a and 37b - U.S. Bureau of Labor Statistics, 1992-2005 Census of Fatal Occupational Injuries and 1992-2005 Current Population Survey. Calculations by CPWR Data Center.
Chart 37c - U.S. Bureau of Labor Statistics, 2005 Survey of Occupational Injuries and Illnesses, Table R64, http://www.bls.gov/iif/oshwc/osh/case/ostb1720.pdf (Accessed November 2007).
Chart 37d - U.S. Bureau of Labor Statistics, 2005 Survey of Occupational Injuries and Illnesses, Table R75, http://www.bls.gov/iif/oshwc/osh/case/ostb1731.pdf (Accessed November 2007). Calculations by CPWR Data Center.
Back to Table of Contents