
Summary Statement
A broad collection of tables and charts covering health and safety in the U.S. construction industry, as well as considerable economic and training data.
2007
Section 23: Wage Estimates in Construction by Industry and Standard Occupational Classification
The Occupational Employment Statistics (OES) program, a cooperative effort of the U.S. Bureau of Labor Statistics (BLS) and state workforce agencies, provides employment and wage estimates for part-time and full-time workers in more than 800 occupations by industry and geographic divisions. Over a period of three years, the OES surveys 1.2 million establishments employing more than 70% of the wage and salary workers of the United States.
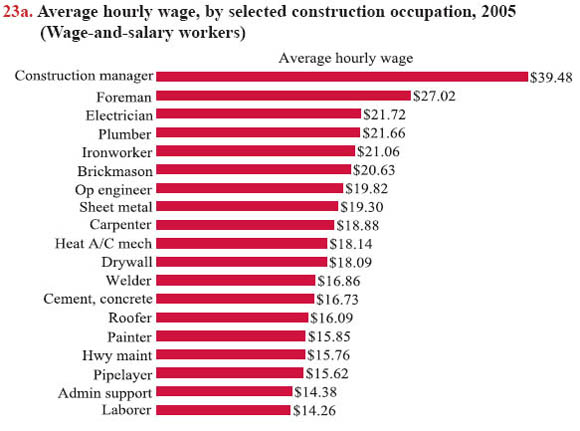
Geographic estimates are available for the entire nation, as well as for individual states and metropolitan areas.1 Wage estimates are based on the survey data collected for the reference months of May or November and are adjusted to the prices of the reporting year with the national Employment Cost Index (see chart book page 22). For instance, if wage data are collected in 2003 and 2004 for the 2005 report, the data are adjusted to 2005 prices. The OES collects data only from nonfarm establishments, and does not cover the self-employed, owners and partners in unincorporated firms, household workers, or people who do not receive salaries for their work in a family business.OES data show that wage rates vary among occupations and industries (charts 23a and 23b). For example, a painter, on average, earned 27% less than a plumber and 11% more than a construction laborer, although workers employed with painting and wall covering contractors made less than any other construction sector. Even within the same occupation, wage rates differed by industry sector (chart 23c). However, the wage differential is mainly attributed to occupation rather than industry sector.
The OES survey coded occupations using the 2000 Standard Occupational Classification (SOC) system starting in 1999, and coded industries using the North American Industry Classification System (NAICS) starting in 2002. As a result of changes in coding systems, estimates in 2005 are not directly comparable with OES estimates prior to 2002.
Another BLS survey, the National Compensation Survey, provides wage information, but does not provide the general wage profiles for a large number of occupations and locations that are used on this page. Instead, the survey is designed to integrate data from separate BLS compensation surveys and to provide earnings data by worker characteristics such as age/race/ sex, and establishment characteristics such as size and geographic area. The survey also provides information that can help set worker pay levels. Wage rates also can be estimated based on self-reported data from the Current Population Survey (see chart book pages 9, 10, and 24). Because of unique survey methodologies and estimating methods used by each data collection system, wage rates reported on this page may differ from the wage estimates shown on other chart book pages.
23b. Hourly and annual wage, by construction industry, 2005
(Average and median; wage-and-salary workers)
| Hourly Wage | Annual Wage | |||
| # | Industry | Average | Median | Average |
| 236100 | Residential building construction | $19.82 | $16.40 | $41,230 |
| 236200 | Nonresidential building construction | $22.34 | $19.40 | $46,460 |
| 237100 | Utility system construction | $19.16 | $16.42 | $39,850 |
| 237130 | Power and communication line and related structures construction | $19.44 | $16.78 | $40,440 |
| 237200 | Land subdivision | $24.38 | $18.38 | $50,720 |
| 237300 | Highway, street, and bridge construction | $19.72 | $17.25 | $41,010 |
| 237900 | Other heavy and civil engineering construction | $19.32 | $16.44 | $40,180 |
| 238100 | Foundation, structure, and building exterior contractors | $18.15 | $15.86 | $37,750 |
| 238110 | Poured concrete foundation and structure contractors | $17.42 | $15.07 | $36,240 |
| 238140 | Masonry contractors | $18.59 | $16.84 | $38,660 |
| 238160 | Roofing contractors | $17.31 | $15.02 | $36,010 |
| 238200 | Building equipment contractors | $20.67 | $18.21 | $43,000 |
| 238210 | Electrical contractors | $21.04 | $18.58 | $43,770 |
| 238220 | Plumbing, heating, and air-conditioning contractors | $20.14 | $17.67 | $41,890 |
| 238300 | Building finish contractors | $18.36 | $16.00 | $38,190 |
| 238310 | Drywall and insulation contractors | $19.28 | $17.08 | $40,100 |
| 238320 | Painting and wall covering contractors | $16.75 | $14.60 | $34,480 |
| 238900 | Other specialty trade contractors | $17.91 | $15.44 | $37,250 |
23c. Hourly wage by selected construction industry and occupation, 2005
(Average and median; wage-and-salary workers)
| Construction of Buildings | Heavy and Civil Engineering Construction | Specialty Trade Contractors | |||||
| # | Industry/occupation | Average | Median | Average | Median | Average | Median |
| 00-0000 | Industry total | $20.93 | $17.53 | $19.88 | $16.86 | $19.20 | $16.69 |
| 11-9021 | Construction manager | $38.54 | $33.98 | $39.94 | $35.79 | $40.60 | $35.06 |
| 43-0000 | Office and administrative support | $14.75 | $13.86 | $15.16 | $13.99 | $14.04 | $13.09 |
| 47-0000 | Construction and extraction | $18.54 | $16.76 |
$18.32 | $16.42 | $18.58 | $16.68 |
| 47-1011 | Foreman/Manager | $26.92 | $25.17 | $26.52 | $25.03 | $27.22 | $25.02 |
| 47-2031 | Carpenter | $18.82 | $17.41 | $19.95 | $18.31 | $18.87 | $17.17 |
| 47-2061 | Construction Laborer | $14.15 | $12.66 | $15.07 | $12.75 | $13.87 | $12.17 |
| 47-2073 | Operating engineer & other equipment op | $20.13 |
$18.55 | $20.22 | $18.64 | $19.37 | $17.75 |
| 47-2111 | Electrician | $21.07 | $19.84 | $22.77 | $22.22 | $21.73 | $20.02 |
| 47-2141 | Painter, construction and maintenance | $16.12 | $15.18 | $16.13 | $14.64 | $15.81 | $14.46 |
| 47-2152 | Plumber, pipefitter, and steamfitter | $21.80 | $20.41 | $21.43 | $20.03 | $21.66 | $20.18 |
| 47-2211 | Sheet Metal worker | $17.18 | $14.83 | $21.25 | $19.19 | $19.39 | $17.60 |
| 47-3012 | Helper-carpenter | $11.25 | $10.69 | $11.26 | $10.75 | $11.03 | $10.53 |
| 49-0000 | Installation, maintenance, and repair | $17.51 | $16.47 | $18.31 | $17.07 | $18.32 | $17.12 |
| 53-0000 | Transportation and material moving | $15.14 |
$13.85 | $15.95 | $14.55 | $15.20 | $13.97 |
Download MS PowerPoint version of Chart 23a
Download PDF version of Chart 23b
Download PDF version of Chart 23c
1. For state data, see http://www.bls.gov/oes/current/oessrcst.htm (Accessed November 2007) and for data on metropolitan areas, see http://www.bls.gov/oes/current/oessrcma.htm (Accessed November 2007).
Note:
Charts 23b and 23c - The median is the midpoint; half of the reported wages are larger and half are smaller.
Source:
Chart 23a - U.S. Bureau of Labor Statistics, May 2005 National Occupational Employment and Wage Estimates.
Charts 23b and 23c - U.S. Bureau of Labor Statistics, May 2005 National Industry-Specific Occupational Employment and Wage Estimates.
Back to Table of Contents