
Summary Statement
A broad collection of tables and charts covering health and safety in the U.S. construction industry, as well as considerable economic and training data.
2007
Section 21: Contingent and Alternative Employment and Job Tenure in Construction and Other Industries
The construction industry, following national economic trends, employs a growing number of contingent workers and makes greater use of non-traditional employment arrangements. The increasing number of workers engaged in both contingent and alternative employment arrangements raises a number of public policy issues about job security, wage and benefit levels, and safety and health at worksites.1
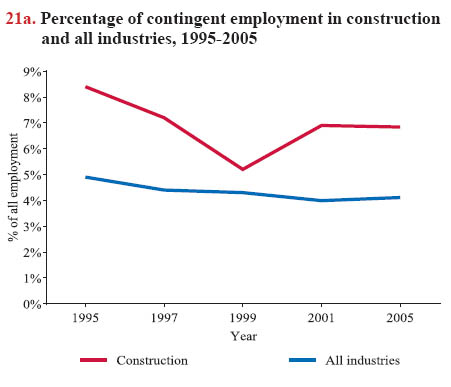
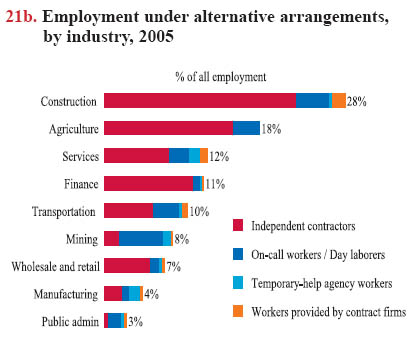
Contingent workers, as defined by the U.S. Bureau of Labor Statistics (BLS), are workers who do not have an implicit or explicit contract for ongoing employment and do not expect their jobs to last.2 Since February 1995, the BLS has periodically collected data on this and other nontraditional employment in the Current Population Survey (CPS) supplements. About 703,000 construction workers had contingent jobs at the time of the survey in February 2005, making up 12% of the total contingent workforce and 7% of construction employment.3 The number of contingent workers in construction increased by 33% between 2001 and 2005, although the overall percentage slightly declined during this period due to the expansion of overall construction employment (chart 21a). The number of contingent workers in construction could be much smaller than expected because some construction workers, when surveyed by the BLS, may report they have a contract for their current employment, no matter how long the employment can last. Thus, the BLS does not count them as "contingent workers."4In addition to reporting on contingent work, the same BLS survey collects data on alternative employment arrangements, which include independent contractors, on-call workers, day laborers, workers paid by temporary help agencies, and workers whose services are provided through contract firms to only one customer at that customer's worksite.5 About 2.9 million construction workers fell into one of the four types of alternative arrangements in February 2005, nearly 80% of whom were independent contractors6 and 14% were on-call workers and day laborers. The probability of working in an alternative arrangement ranked highest in construction compared with any industry (chart 21b). (A worker may be in both a contingent and an alternative work arrangement.)
Characteristics of contingent construction workers differ from those of the construction workforce overall. Rates of contingent work are higher among younger workers; the average age of contingent construction workers was 35 compared with 39 years for the total construction workforce. Hispanic workers are more likely to hold a contingent job; about 44% of contingent construction workers were Hispanic, a rate almost double that (23%) of all construction employment (see chart book pages 15 and 16). Among construction day laborers and on-call workers, nearly one-half (48%) were Hispanic.
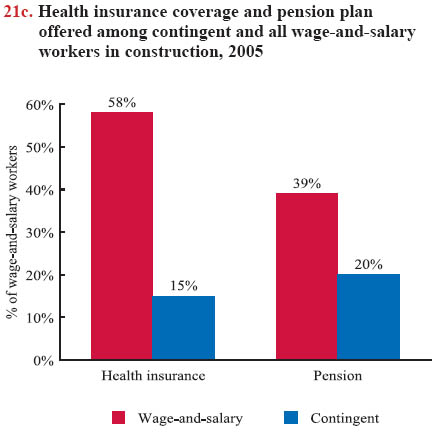
Contingent construction workers are less likely to have employment-based health insurance and pension plans than other wage-and-salary construction workers (see chart book pages 26 and 27). About 15% of contingent workers had health insurance through their employment, compared with 58% of their wage-and-salary construction counterparts. Also, only 20% of contingent construction workers are eligible for employer-sponsored pension plans, compared with 37% of wage-and-salary construction workers on average (chart 21c).
Although some construction workers may prefer contingent employment, many would choose a permanent job if one were available. Among on-call workers and day laborers (see Glossary), about 40% said that on-call or day laborer was the only job they could find, and 11% said they hoped their current job would lead to permanent employment.
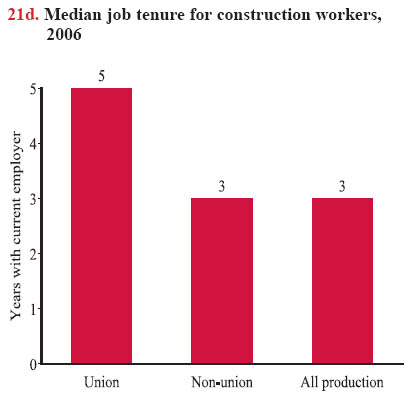
The construction industry's higher rates of contingent and alternative employment are associated with lower job tenure than other industries. In 2006, the median wage and salary worker had worked for their employer for four years, but the median construction employee had worked for their employer for three years.7 Construction workers who are union members have longer job tenure than other construction workers. In 2006, the union members had worked for their employer for a median of five years, two years longer than non-union construction workers (chart 21d). Average job tenure was higher for both groups as some employees had very long tenure with their employer: 6.8 years for union members and 4.4 years for nonunion workers. Union members reported longer stays with one employer, but such workers are also older compared with non-union employees. Information on job tenure is derived from supplemental questions in the February 2006 Current Population Survey.
Download MS PowerPoint versions of Charts
1. National Institute for Occupational Safety and Health (NIOSH). 2002. The Changing Organization of Work and the Safety and Health of Working People: Knowledge of Gaps and Research Directions. DHHS (NIOSH) Publication No. 2002–116, http://www.cdc.gov/niosh/docs/2002-116/pdfs/2002-116.pdf (Accessed November 2007).
2. U.S. Bureau of Labor Statistics: "Contingent workers (Estimate 3) - Workers who do not expect their jobs to last. Wage-and-salary workers are included even if they already had held the job for more than 1 year and expect to hold the job for at least an additional year. The self-employed and independent contractors are included if they expect their employment to last for an additional year or less and they had been self-employed or independent contractors for 1 year or less."
3. U.S. Bureau of Labor Statistics, February 2005 Current Population Survey (CPS) Contingent Worker Supplement. Calculations by CPWR Data Center.
4. Under their definition of "contingent workers," the BLS cannot capture the large contingent workforce in the construction industry.
5. Temporary help agency workers and workers provided by contract firms have an industry classification based on the place to which they were assigned.
6. "Independent contractor" is defined differently from self-employed. See Glossary.
7. U.S. Bureau of Labor Statistics, Employee Tenure in 2006, Table 5, http://www.bls.gov/news.release/tenure.nr0.htm (Accessed November 2007).
Note:
Chart 21a - Based on the survey in February of each year. No data collection for 2003.
Chart 21d - The median is the midpoint; half the workers have a longer job tenure and half have a shorter one.
Source:
Chart 21a - 1995-2001 data from: Steven Hipple, Contingent Work in the Late-1990s, Monthly Labor Review, pp.3-23, March 2001; 2005 data from: February 2005 Current Population Survey (CPS) Contingent Worker Supplement. Calculations by CPWR Data Center.
Charts 21b and 21c - U.S. Bureau of Labor Statistics, February 2005 Current Population Survey (CPS) Contingent Worker Supplement. Calculations by CPWR Data Center.
Chart 21d - U.S. Bureau of Labor Statistics, February 2006 Current Population Survey (CPS) Job Tenure Supplement. Calculations by CPWR Data Center.
Back to Table of Contents