
Health and Safety Hazards in Construction: Recognition, Control and Free Resources from CPWR
Summary Statement
This presentation highlights the health and safety hazards in construction related to recognition and control, and offers access to free materials in an effort to reduce and eliminate these hazards.
July 2018

OH&S Webinar, June 20, 2018
Bruce Lippy, Ph.D., CIH, CSP, FAIHA
Director of Safety Research
CPWR is a nonprofit established by North America’s Building Trades Unions
- Research, training and service to improve safety and health in construction industry
- National consortium with over 50 organizations
- http://www.cpwr.com
CPWR is funded by NIOSH, NIEHS and DOE
*My comments are my own and don’t reflect policies or positions of NIOSH, NIEHS or DOE
 Construction is different
- Decentralized and fragmented with mixed crafts
- Highly cyclical
- No fixed worksites
- Changing environmental conditions
- Extended hours in good weather
- Travelers
Construction is dominated by small employers and a diverse workforce
- 90% have <20 employees
- About 80% have <10 employees
- 30% of workers are Hispanic
- 14% are employed by temp agencies

Sources: U.S Census Bureau; CPWR Construction Chart Book 5th Edition;
CPWR 2nd Quarter 2015 Quarterly Data Report
Topics we will cover:
- Fatality and injury data for the construction industry
- Major hazards on construction sites
- Managing and controlling construction hazards
- Taking advantage of free CPWR resources
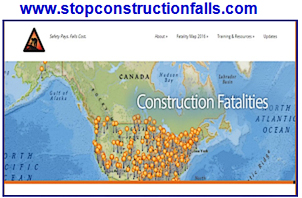
Topic One: Overview of fatalities and injuries in construction
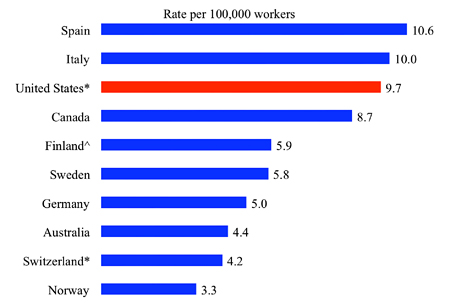
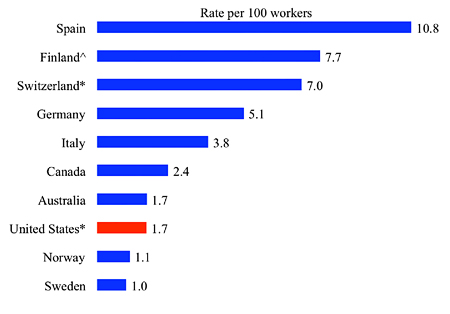
Rate of deaths from injuries in construction, selected countries, 2008
Rate of nonfatal injuries in construction, 2008. Why is the U.S. so low?
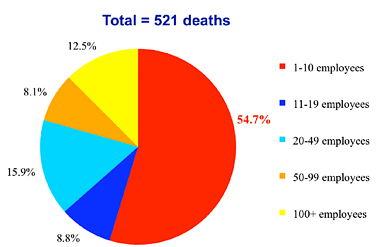
Distribution of construction employment and work-related deaths from injuries, by establishment size, 2010.
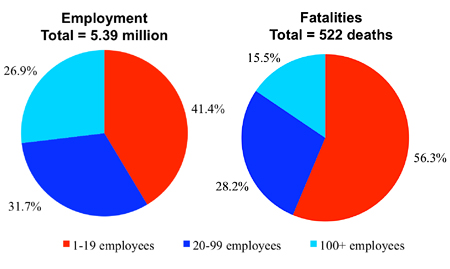
What is this saying?
Small firms represent a disproportionate percentage of construction fatalities (2015)
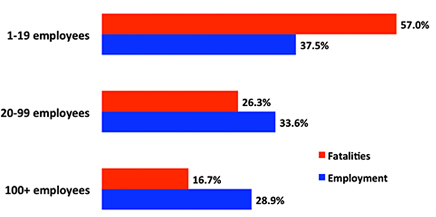
CPWR The Chart Book 2018
Distribution of fatal injuries in construction, by event, 2011-2013 total
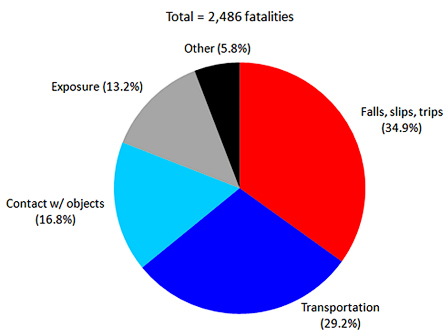
Source: U.S. Bureau of Labor Statistics, 2011-2013 Census of Fatal Occupational Injuries.
Numbers are from the online CFOI database.
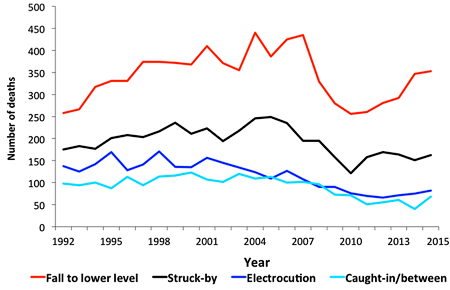
Leading causes of work-related deaths, construction, 1992-2015
Understanding the pattern of construction employment in the US is critical for interpreting S&H data, (BLS data 2003-2016)
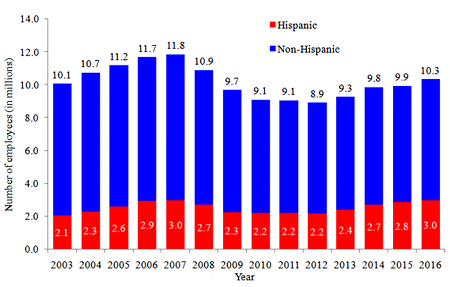
Source: U.S. Bureau of Labor Statistics, 2003-2016 Current Population Survey.
Calculations by the authors.
See any pattern in fatalities? (BLS)
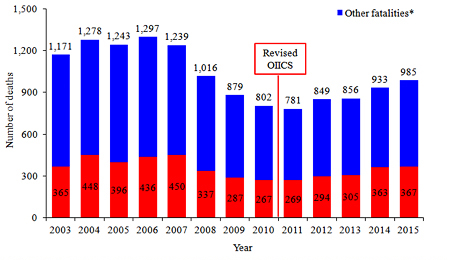
Note: In 2011, the CFOI switched to OIICS version 2.01 which categorizes slips, trips, and falls together.
In previous years, slips and trips were categorized elsewhere.
* Other fatalities are fatalities from all causes except falls.
Source: U.S. Bureau of Labor Statistics, 2003-2015 Census of Fatal Occupational Injuries.
Numbers were from the online CFOI database.
Number of fatal work injuries-
Construction had the most fatalities in 2016, although not the highest rate
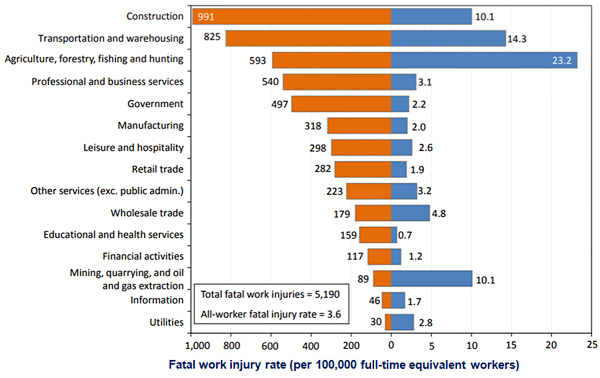
U.S. BLS, Current Population Survey, Census of Fatal Occupational Injuries, 2017.
The 10 occupations with highest fatal injury counts accounted for 39% of all fatal injuries in 2016
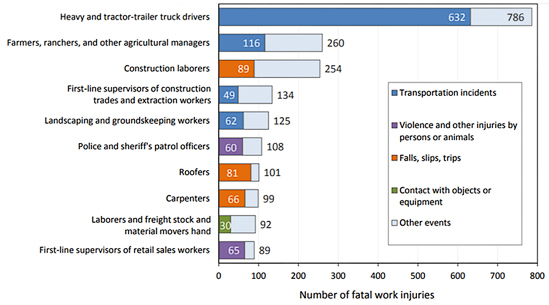
U.S. BLS, Current Population Survey, Census of Fatal Occupational Injuries, 2017.
Rate of fatalities in construction has gone down dramatically for Hispanic workers (1992-2010)
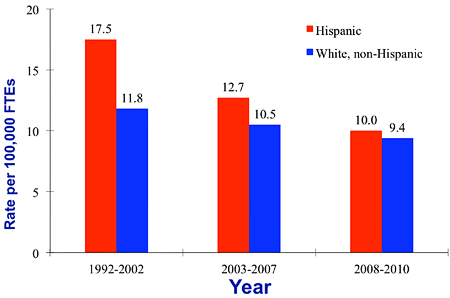
Except for the recent rate of fatFal falls to a lower level (2011-2015, BLS)
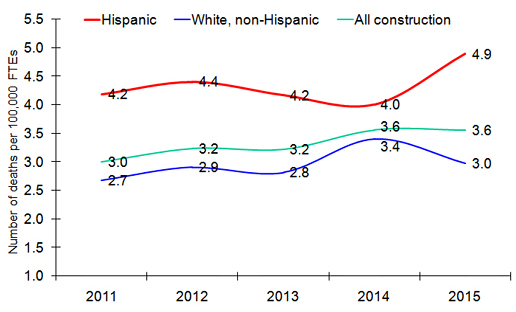
Source: Numbers were obtained from the BLS through special requests. Numbers of FTEs were estimated using the Current Population Survey. Calculations by the authors. The views expressed here do not necessarily reflect the views of the BLS.
Latino crew at the leading edge
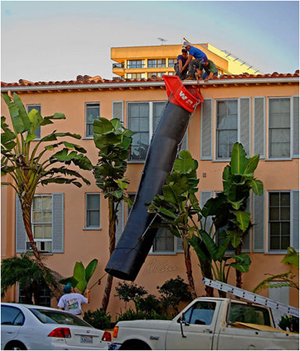

Photos courtesy of Robert Carr
Topic Two: Major Hazards on Construction Jobs
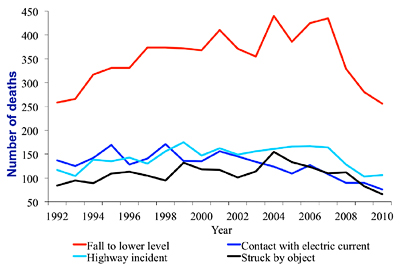
Leading causes of work-related deaths, construction, 1992-2010
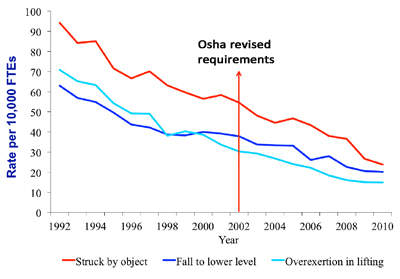
Rate of leading causes of nonfatal injuries resulting in days away from work in construction, 1992-2010 (Private wage-and-salary workers)
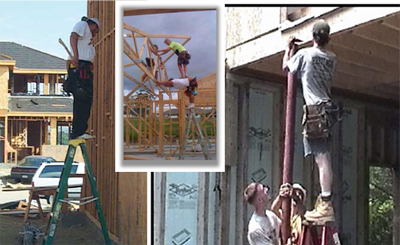
Falls
Fatal falls, slips, trips in construction, by height of fall, 2011-2013 total
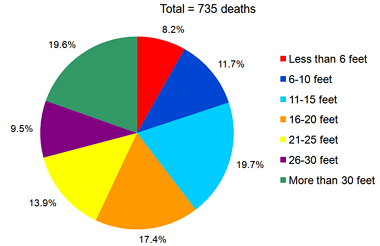
Note: 133 deaths without height information were excluded.
Source: These numbers were calculated by the authors with restricted access to BLS CFOI microdata. The views expressed here do not necessarily reflect the views of the BLS.
Distribution of fatalities from falls in construction, by establishment size, 2008-2010 total
Rate of fatalities from falls, selected construction occupations, 2008-2010 average (All employment)
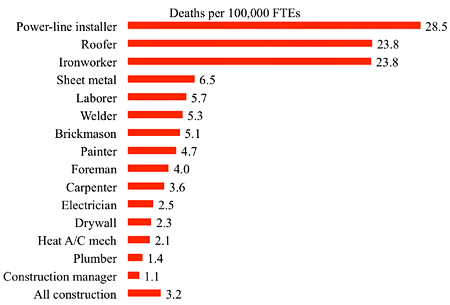
*This research was conducted with restricted access to Bureau of Labor Statistics (BLS) data.
The views expressed here do not necessarily reflect the views of the BLS.
Over half of fatal falls to a lower level in construction were from roofs and ladders, 2011-2015 (BLS)
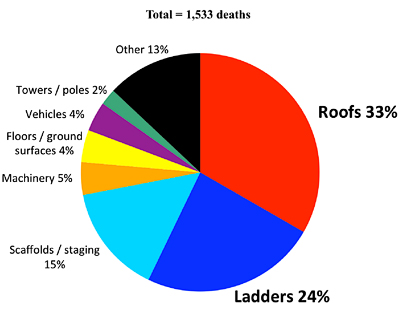
Source: Numbers were obtained from the BLS through special requests. Calculations by the authors.
Number of fatal falls to a lower level, selected construction subsectors, 2011-2015
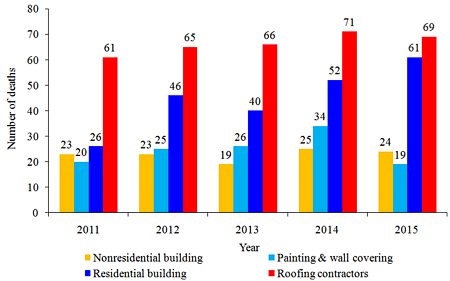
Source: Numbers were obtained from the BLS through special requests. Calculations by the authors. The views expressed here do not necessarily reflect the views of the BLS.
What are "struck-by" hazards?
- 37,000 people go to emergency rooms from nail gun injuries every year
- The hazards are similar to those of firearms
- Sequential-trip triggers could prevent 65 percent of injuries
What is wrong with this picture?
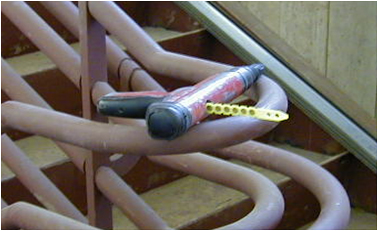
Photo courtesy Laborers-AGC
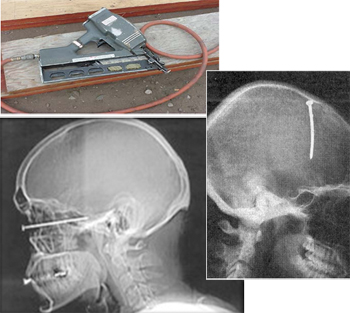
Pneumatic nailers have been made safer
- Penetration checks must be made
- All proper PPE must be worn
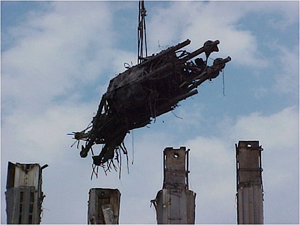
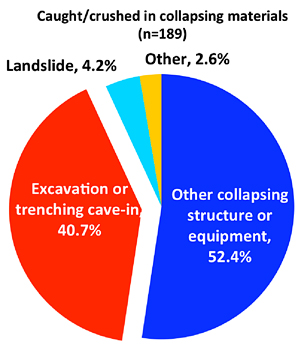
Trenching cave-ins represent 40% of caught-in/between fatalities (2011-2015)

Dedicated to Patrick Walters-
One of over 50 workers who needlessly
die in trenching and excavation each year
What do we know about the 542 “Patricks” who died in excavations from 1992 to 2001?
- Average age was 38
- Nearly half of their companies had less than 10 employees
- Nearly all were employed by private companies
- Cave-ins accounted for 76% of the deaths
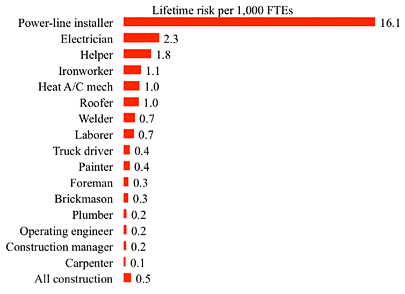
Lifetime risk of electrocution deaths in construction, selected construction occupations (All employment)
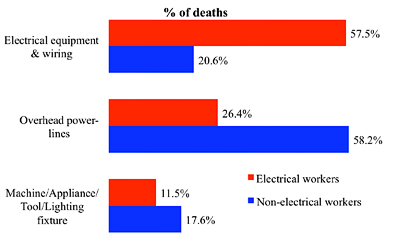
Major causes of electrocution deaths in construction, electrical workers vs. non-electrical workers, 2008-2010 total (All employment)
Topic Three: Managing and Controlling Hazards
on Construction Jobs
Prevention through Design (PtD) promotes safety, but is not used much by smaller firms (average of 2012 and 2015)
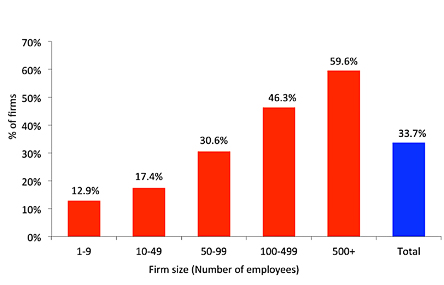
Source: Dodge Data & Analytics, 2012 and 2015 Construction Safety Management Survey. Calculations by the authors.
CPWR’s Construction Solutions allows you to
select a line of work and specific tasks to learn the hazards
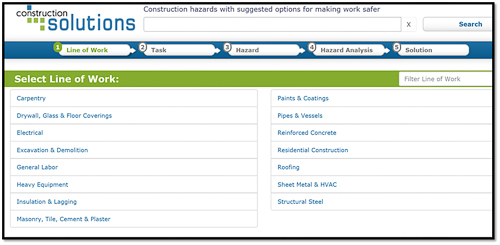
http://www.cpwrconstructionsolutions.org/
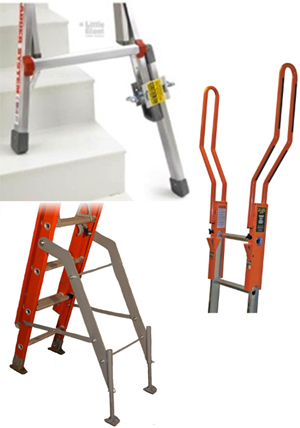
The hierarchy of controls needs to be considered

Here is why PPE is at the bottom:
NIOSH FACE reports, fatal falls in construction, by Personal Fall Arrest System (PFAS) status, 1982-2014
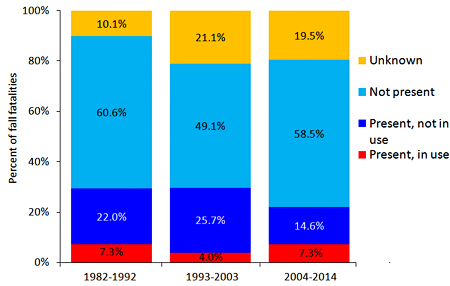
Source: Dong XS, Largay JA, Choi SD, Wang X, Cain CT, Romano N. 2017. Accident Analysis & Prevention, 102:136-143.
Frequency of general safety and health training, average of 2012 and 2015
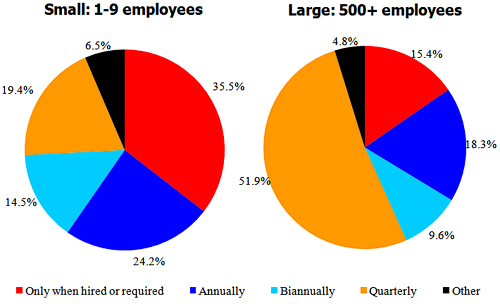
Source: Dodge Data & Analytics, 2012 and 2015 Construction
Safety Management Survey. Calculations by the authors.
Topic Four: Taking advantage of free CPWR resources
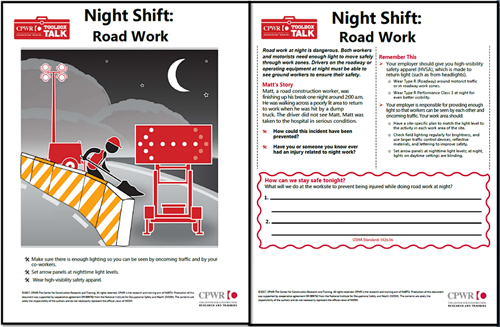
We worked with NIOSH to publish a series of toolbox talks(in English and Spanish)

Our toolbox talks feature case studies and graphics
Our safety climate tools are widely used
Both versions focus on 8 leading indicators and have their own activities and ideas
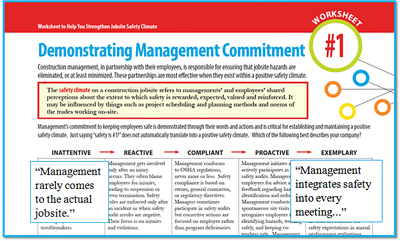
- Demonstrating Management Commitment
- Aligning and Integrating Safety as a Value
- Ensuring Accountability at All Levels
- Improving Supervisory Leadership
- Empowering and Involving Workers
- Improving Communication
- Training at All Levels
- Encouraging Owner/Client Involvement
Our Safety Climate Workbook contains worksheets that allow you to rate your program from inattentive to exemplary
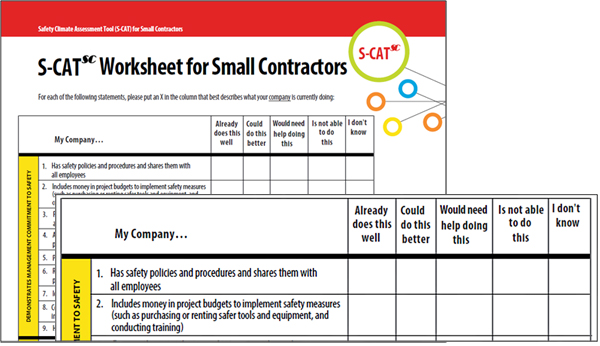
The Small Contractor version allows you to quickly assess on paper or online your company’s activities and where you need help
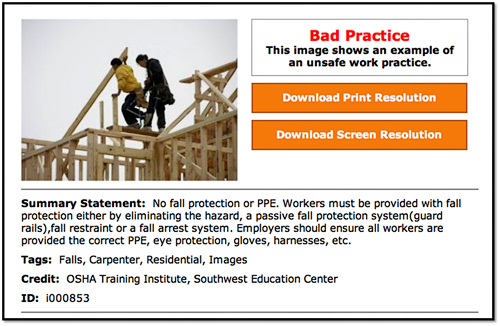
Our Hazard Alerts are in paper and digital form in English & Spanish

Our electronic Library of Construction Occupational Safety and Health (eLCOSH.org) is focused on practitioners and trainers

eLCOSH has over a thousand images for your use
We maintain an inventory that currently contains 580 commercial construction nanomaterials

Check out our other online resources & new safety and health network


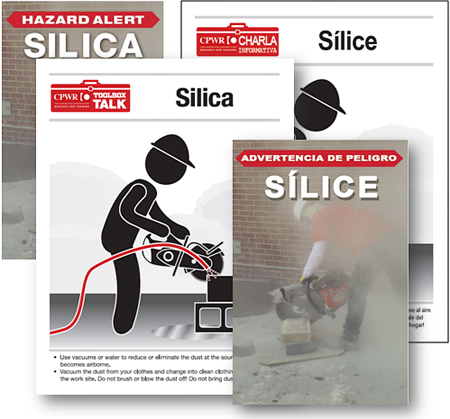
Our silica resources help contractors comply (www.silica-safe.org)

We have lots of silica resources in English and Spanish at www.cpwr.com
Questions?
Contact Bruce Lippy
blippy@cpwr.com