
Summary Statement
This is the 24th edition of the AFL-CIO Health and Safety Division's Death on the Job annual review. It reports on several key trends. Latino workers continue to be at increased risk of job fatalities. The fatality rate among Latino workers increased in 2013 to 3.9 per 100,000 workers, up from a rate of 3.7 per 100,000 in 2012. At the same time, the number and rate of fatalities for all other races declined or stayed the same. Contractors accounted for 16% of all worker fatalities in 2013, or 749 deaths. Construction and extraction workers accounted for half of these deaths. Thirty-five percent of contract workers who died in the construction industry were actually contracted to another industry when they died. Temporary workers and other contract workers often work in dangerous jobs, with no safety and health protections or training. Nearly 3.8 million work-related injuries and illnesses were reported in 2013. Musculoskeletal disorders caused by ergonomic hazards accounted for 33.5% of all serious injuries in 2013. Workplace violence continues to be the second leading cause of job fatities in the United States (after transportation incidents), responsible for 773 worker deaths and 26,520 lost-time injuries in 2013. Women workers suffered 70% of the lost-time injuries related to workplace violence.
2015
A National And State-By-State Profile of Worker Safety and Health in the United States
CONTENTS
I.Executive SummaryII.The State of Workers' Safety and Health
- Job Fatalities, Injuries and Illnesses
- OSHA Enforcement and Coverage
- Regulatory Action
- Key Issues in Safety and Health: Status and Progress
- Mine Safety and Health
- Job Safety Budget
- Safety and Health Legislation
- What Needs to Be Done
III. National Safety and Health Overview
- Charts and Graphs:
- Workplace Fatalities (Employment-Based), 1970-2007
- Workplace Fatalities (Hours-Based), 2006-2013
- Rate of Fatal Work Injuries (Employment-Based), 1992-2007
- Rate of Fatal Work Injuries (Hours-Based), 2006-2013
- Workplace Fatality Rates by Industry Sector, 1970-2002
- Workplace Fatality Rates by Industry Sector (Employment-Based), 2003-2007
- Workplace Fatality Rates by Industry Sector (Hours-Based), 2007-2013
- Occupational Fatalities by Industry, 2013
- Selected Occupations with High Fatality Rates, 2013
- Distribution of Fatal Injury Events by Gender, 2013
- Profile of Workplace Homicides, 2013
- Fatal Work Injuries by Race, 1993-2013
- Number of Fatal Occupational Injuries to Hispanic and Latino Workers, 1995-2013
- Rate of Fatal Occupational Injuries to Hispanic and Latino Workers (Employment-Based), 1995-2013
- Rate of Fatal Occupational Injuries to Hispanic and Latino Workers (Hours-Based), 2006–2013
- Profile of Hispanic and Latino Worker Fatalities, 2013
- Profile of Foreign-Born Worker Fatalities, 2013
- Workplace Injury and Illness Incidence Rates, Private Sector, 1972–2013
- Workplace Injury and Illness Rates by Industry Sector, 1973–2002
- Workplace Injury and Illness Rates by Industry Sector, 2003–2013
- Rate of Injuries and Illnesses in Selected Industries for State and Local Government, and Private Industry, 2013
- Rate of Injuries and Illnesses Requiring Days Away from Work in Selected Industries for State and Local Government, and Private Industry, 2013
- Industries with the Highest Total Injury and Illness Rates, 2013
- Nonfatal Occupational Injuries and Illnesses with Days Away from Work by Event or Exposure, 2013
- Hispanic and Latino Worker Injuries and Illnesses with Days Away from Work, 1995–2013
- Workplace Injuries and Illnesses to Women Involving Days Away from Work, Private Industry, 2013
- Workplace Injuries and Illnesses to Men Involving Days Away from Work, Private Industry, 2013
- Workplace Violence Events Leading to Days Away from Work, Private Industry, 2013
- Estimated and Reported Cases of MSDs, Private Industry, 1993–2013
- Occupations with the Highest Numbers of MSDs, 2013
- Highest Incidence Rates of MSDs by Industry, 2013
- Highest Number of MSDs by Industry, 2013
- True Toll of Workplace Injuries and Illnesses, 2013
- Federal OSHA Inspection/Enforcement Activity, FY 2008–2014
- Federal and State Plan OSHA Inspection/ Enforcement Activity, FY 2014
- Number of Federal OSHA Inspections by 2-digit NAICS Code, FY 2013─2014
- Number of State Plan OSHA Inspections by 2-digit NAICS Code, FY 2013─2014
- Average Total Penalty Per OSHA Fatality Inspection, FY 2007–2014
- Significant OSHA Enforcement Cases in FY 2014
- Largest OSHA Enforcement Cases
- Disposition of Federal OSHA 11(c) Whistleblower Complaints, FY 2005–2014
- Disposition of State Plan OSHA 11(c) Whistleblower Complaints, FY 2009–2014
- Major OSHA Health and Safety Standards Since 1971
- Delays in OSHA Standards Impact on Workers
- Permissible Exposure Limits Comparison
- Federal OSHA Budget and Personnel, FY 1979–2015
- Federal OSHA Safety and Health Compliance Staffing, 1975–2014
- Federal OSHA Safety and Health Compliance Officers Per Million Workers, 1974–2014
- Job Safety and Health Appropriations, FY 2006–2016
- Funding for OSHA Worker Safety Training Programs vs. Employer Compliance Assistance Programs, FY 2001–2016
- Number of Establishments and Employees Covered Per OSHA Staff, 1975–2013
- Map of State and Local Employees Lacking OSHA Coverage, 2013
- Profiles of Mine Safety and Health, 2005–2013
- Coal and Metal/Nonmetal Mining Fatality Comparisons, 2002–2014
- Coal Mining Fatalities by State, 2001–2014
- Metal and Nonmetal Mining Fatalities by State, 2001–2014
- MSHA Impact Inspections, 2014
- MSHA Discrimination Complaints and Temporary Reinstatements Filed on Behalf of Miners, 2003–2014
IV. State Comparisons
- Charts and Graphs:
- Years Needed for OSHA to Inspect All Jobsites
- OSHA Inspectors Compared with ILO Benchmark
- Profile of Workplace Safety and Health in the United States
- State-by-State OSHA Fatality Investigations, FY 2014
- Workplace Safety and Health Statistics by State, 2008–2013
- Workplace Fatalities by State, 1995–2013
- Fatalities by State and Event or Exposure, 2013
- Number and Rate of Injuries and Illnesses by State for All Industries, Private Industry, State and Local Government, 2013
- Hispanic or Latino Worker Fatalities by State, 1996–2013
- Foreign-Born Worker Fatalities by State, 1996–2013
V. State Profiles
VI. Sources and Methodology for State Profiles
EXECUTIVE SUMMARY
This 2015 edition of Death on the Job: The Toll of Neglect marks the 24th year the AFL-CIO has produced a report on the state of safety and health protections for America’s workers.
More than 510,000 workers now can say their lives have been saved since the passage of the Occupational Safety and Health Act of 1970, which promised workers in this country the right to a safe job. Since that time, workplace safety and health conditions have improved, but too many workers remain at serious risk of injury, illness or death. Many preventable workplace disasters do not make the headlines, and kill and disable thousands of workers each year.
The High Toll of Job Injuries, Illnesses and Deaths
In 2013, 4,585 workers were killed on the job in the United States, and an estimated 50,000 died from occupational diseases, resulting in a loss of 150 workers each day from hazardous working conditions.
Nearly 3.8 million work-related injuries and illnesses were reported, but many injuries are not reported. The true toll is likely two to three times greater, or 7.6 million to 11.4 million injuries each year.
Over the past four years, the job fatality rate has declined slightly each year, with a rate of 3.3 deaths per 100,000 workers in 2013 compared with a rate of 3.6 per 100,000 workers in 2010.
North Dakota had the highest fatality rate in the nation (14.9 per 100,000 workers), followed by Wyoming (9.5), West Virginia (8.6), Alaska (7.9) and New Mexico (6.7). The lowest state fatality rate (1.6 per 100,000 workers) was reported for Hawaii, followed by Washington (1.7), Connecticut and Massachusetts (1.8), and New York and Rhode Island (2.1).
North Dakota continues to stand out as an exceptionally dangerous and deadly place to work. For the third year in a row, North Dakota had the highest job fatality rate in the nation. The state’s job fatality rate of 14.9 per 100,000 was more than four times the national average. North Dakota’s fatality rate and number of deaths have more than doubled since 2007. Fifty-six workers were killed in North Dakota in 2013. The fatality rate in the mining and oil and gas extraction sector in North Dakota was an alarming 84.7 per 100,000, nearly seven times the national fatality rate of 12.4 per 100,000 in this industry; and the construction sector fatality rate in North Dakota was 44.1 per 100,000, more than four times the national fatality rate of 9.7 per 100,000 for construction.
Latino workers continue to be at increased risk of job fatalities. The fatality rate among Latino workers increased in 2013 to 3.9 per 100,000 workers, up from a rate of 3.7 per 100,000 in 2012. At the same time, the number and rate of fatalities for all other races declined or stayed the same. There were 817 Latino workers killed on the job in 2013, up from 748 deaths in 2012. Sixty-six percent of the fatalities (542 deaths) in 2013 were among workers born outside the United States. There was a sharp increase in Latino deaths among grounds maintenance workers. Specifically, deaths related to tree trimming and pruning doubled among Latino workers since 2012, and 87% of the landscaping deaths among Latino workers were immigrants.
Contractors accounted for 16% of all worker fatalities in 2013, or 749 deaths. Construction and extraction workers accounted for half of these deaths. Thirty-five percent of contract workers who died in the construction industry were actually contracted to another industry when they died. Temporary workers and other contract workers often work in dangerous jobs, with no safety and health protections or training.
Nearly 3.8 million work-related injuries and illnesses were reported in 2013. Due to widespread underreporting of workplace injuries and illnesses, this number understates the problem. The true toll is estimated to be 7.6 million to 11.4 million injuries and illnesses each year. Musculoskeletal disorders caused by ergonomic hazards accounted for 33.5% of all serious injuries in 2013.
Workplace violence continues to be the second leading cause of job fatalities in the United States (after transportation incidents), responsible for 773 worker deaths and 26,520 lost-time injuries in 2013. Women workers suffered 70% of the lost-time injuries related to workplace violence.
The cost of job injuries and illnesses is enormous—estimated at $250 billion to $360 billion a year.
Job Safety Oversight and Enforcement
The federal Occupational Safety and Health Administration (OSHA) and the state OSHA plans have a total of 1,882 inspectors (847 federal and 1,035 state inspectors) to inspect the 8 million workplaces under the OSH Act’s jurisdiction. This means there are enough inspectors for federal OSHA to inspect workplaces once every 140 years, on average, and for state OSHA plans to inspect workplaces once every 91 years.
The current level of federal and state OSHA inspectors provides one inspector for every 71,695 workers.
OSHA penalties have increased under the Obama administration, but still are too low to deter violations. The average penalty for a serious violation of the law in FY 2014 was $1,972 for federal OSHA and $1,043 for the state plans.
Penalties for worker deaths continue to be minimal. For FY 2014, the median penalty in fatality cases investigated by federal OSHA was $5,050, and for the OSHA state plans the median penalty was $4,438.
Criminal penalties under the OSHA law are weak. They are limited to cases in which a willful violation results in a worker death, resulting in misdemeanors. Since 1970, only 88 cases have been prosecuted, with defendants serving a total of 100 months in jail. During this time there were more than 390,000 worker deaths.
Both OSHA and MSHA have stepped up enforcement, particularly for employers who have a history of serious, repeated and willful violations, and strengthened whistleblower programs to protect workers who report job injuries or hazards from retaliation.
OSHA has launched special initiatives to address the hazards faced by Latino, immigrant and temporary workers, all of whom are at high risk of injury and death.
Regulatory Action
After eight years of neglect and inaction under the Bush administration, progress in issuing new needed protections under the Obama administration has been slow and disappointing. The Office of Management and Budget (OMB) has blocked and delayed important rules. Since 2009, only four major final OSHA safety and health standards have been issued.
In 2013, this de facto regulatory freeze began to thaw. The proposed tougher silica rule that had been blocked by OMB for two-and-one-half years was released. When finalized, this new rule will prevent 700 deaths and 1,600 cases of silica-related disease each year.
In April 2014, the Mine Safety and Health Administration (MSHA) issued an important final standard to reduce coal miners’ exposure to respirable dust to help finally end black lung disease.
But many rules are long overdue, including OSHA rules on confined space entry in construction, beryllium, combustible dust and infectious diseases, and MSHA’s rule on proximity detection for mobile mining equipment.
The Republican majority in Congress is trying to stop all new protections and prevent these important measures from becoming law. It is critical that the Obama administration finalize the OSHA silica standard and other key rules as soon as possible so the president can veto any legislation designed to delay or overturn these measures.
Much Work Remains to Be Done
Very simply, workers need more job safety and health protection.
Funding and staffing at both job safety agencies should be increased to provide for enhanced oversight of worksites and timely and effective enforcement.
Ergonomic hazards, infectious diseases, chemical exposures and workplace violence pose serious and growing risks to workers, but are largely unregulated. Enhanced protections, mandatory standards and greater oversight are sorely needed to protect workers from these threats.
The serious safety and health problems and increased risk of fatalities and injuries faced by Latino and immigrant workers must be given increased attention.
The escalating fatalities and injuries in the oil and gas extraction industry demand intensive and comprehensive intervention. Without action, the workplace fatality crisis in this industry will only get worse as production intensifies and expands.
The widespread problem of injury underreporting must be addressed, and employer policies and practices that discourage the reporting of injuries through discipline or other means must be prohibited.
Thousands of workers still face retaliation by their employers each year for raising job safety concerns or reporting injuries—fired or harassed simply because they want a safe place to work. The OSH Act’s whistleblower and anti-retaliation provisions are too weak to provide adequate protection to workers who try to exercise their legal rights, and must be strengthened.
The job safety laws need to be strengthened.
The Occupational Safety and Health Act is now more than 40 years old and is out of date. Congress should pass the Protecting America’s Workers Act to extend the law’s coverage to workers currently excluded, strengthen civil and criminal penalties for violations, enhance anti-discrimination protections, and strengthen the rights of workers, unions and victims.
Improvements in the Mine Safety and Health Act are needed to give MSHA more authority to enhance enforcement against repeated violators and to shut down dangerous mines.
The nation must renew the commitment to protect workers from injury, disease and death and make this a high priority. We must demand that employers meet their responsibilities to protect workers and hold them accountable if they put workers in danger. Only then can the promise of safe jobs for all of America’s workers be fulfilled.
THE STATE OF WORKERS’ SAFETY AND HEALTH
This 2015 edition of Death on the Job: The Toll of Neglect marks the 24th year the AFL-CIO has produced a report on the state of safety and health protections for America’s workers. This report includes state-by-state profiles of workers’ safety and health and features state and national information on workplace fatalities, injuries, illnesses, the number and frequency of workplace inspections, penalties, funding, staffing and public employee coverage under the Occupational Safety and Health Act (OSH Act). It also includes information on the state of mine safety and health.
More than four decades ago, in 1970, Congress enacted the Occupational Safety and Health Act promising workers in this country the right to a safe job. More than 510,000 workers now can say their lives have been saved since the passage of the OSH Act1. Since that time, workplace safety and health conditions have improved. But too many workers remain at serious risk of injury, illness or death as chemical plant and oil rig explosions, major fires, mine disasters and other preventable workplace tragedies continue to occur. But many other workplace disasters do not make the headlines and kill and disable thousands of workers each year.
In 2013, 4,585 workers lost their lives on the job as a result of traumatic injuries, according to final fatality data from the Bureau of Labor Statistics (BLS). Each day in this country, an average of 13 workers die because of job injuries—women and men who go to work never to return home to their families and loved ones. This does not include those workers who die from occupational diseases, estimated to be 50,000 each year—an average of 137 deaths each day. Chronic occupational diseases receive less attention, because most are not detected for years after workers are exposed to toxic chemicals and occupational illnesses often are misdiagnosed and poorly tracked.
In 2013, nearly 3.8 million workers across all industries, including state and local government, had work-related injuries and illnesses that were reported by employers, with 3 million injuries and illnesses reported in private industry. Due to limitations in the current injury reporting system and widespread underreporting of workplace injuries, this number understates the problem. The true toll is estimated to be two to three times greater—or 7.6 million to 11.4 million injuries and illnesses a year.
The cost of these injuries and illnesses is enormous—estimated at $250 billion to $360 billion a year.
Since taking office in 2009, the Obama administration has increased the job safety budget, stepped up enforcement and moved forward on several much-needed standards, including rules on cranes and derricks, coal dust and injury reporting. Important new rules to protect workers from silica—expected to save hundreds of lives and prevent thousands of cases of disabling disease each year—and other hazards are expected soon.
But the Republican majority in Congress is trying to stop all new protections and prevent these important measures from becoming law. Since the election of a Republican majority in the House of Representatives in 2010, and in the Senate and House in 2014, progress on safety and health has been threatened. Special interest groups and Republicans have launched an all-out assault on regulations and science, replacing facts with rhetoric unsupported by evidence, and have targeted key OSHA and MSHA rules. These attacks have slowed progress to improve workplace safety and health, and have squeezed agencies’ budgets.
Workers in the United States need more safety and health protection, not less. More than four decades after the passage of the OSH Act, there is much more work to be done.
1Calculated based on changes in annual fatality rates and employment since 1970. Fatality rate data for 1970 to 1991 is from National Safety Council Accident Facts, 1994. Fatality rate data for 1992 to 2013 is from the Bureau of Labor Statistics, Census of Fatal Occupational Injuries. Annual employment data is from the Bureau of Labor Statistics Current Population Survey.
JOB FATALITIES, INJURIES AND ILLNESSES
On average, 13 workers were fatally injured and more than 10,411 workers were injured or made ill each day of 2013. These statistics do not include deaths from chronic occupational diseases, which claim the lives of an estimated 50,000 workers each year.
Job Fatalities
According to final fatality data from the BLS, there were 4,585 workplace deaths due to traumatic injuries in 2012, about the same as the 4,628 deaths reported in 2012.2 The rate of fatal job injuries in 2013 was 3.3 per 100,000 workers, a slight decrease from the rate of 3.4 per 100,000 workers reported in 2012.
State Fatality Comparisons
For the third year in a row, North Dakota held the rank for the worst job fatality rate of any state, based on 2013 data. In 2013, its fatality rate of 14.9 per 100,000 workers is one of the highest ever recorded for North Dakota, followed by Wyoming (9.5), West Virginia (8.6), Alaska (7.9) and New Mexico (6.7).
The lowest state fatality rate (1.6 per 100,000 workers) was reported for Hawaii, followed by Washington (1.7), Connecticut and Massachusetts (1.8), and New York and Rhode Island (2.1).
Nineteen states saw an increase in either the rate and/or the number of fatalities between 2012 and 2013. Notably, 35 additional workers were killed in Arizona, 30 in Illinois, 30 in Missouri, 21 in Florida and 21 in California in 2013. One catastrophic event in 2013 claimed the lives of 19 firefighters in Arizona.3
In 2013, a number of states experienced significant increases in fatality rates from their 2012 rates. Idaho experienced a 61% increase, followed by Arizona (52%), New Mexico (40%), Missouri (30%), Massachusetts (29%) and West Virginia (25%).
Among all of the states, North Dakota continues to stand out as an exceptionally dangerous and deadly place to work. In 2013, 56 workers were killed on the job in North Dakota. For the third year in a row, the state had the highest fatality rate in the nation. The state’s job fatality rate in 2013 of 14.9/100,000 was more than four times the national average. Workplace deaths in the state have been increasing. The 2013 fatality rate and number of deaths have more than doubled since 2007 when the job fatality rate was 7.0/100,000, and the number of workers killed on the job was 25. In recent years, the increase in job deaths has accelerated, with 30 deaths in 2010, 44 deaths in 2011 and 65 deaths in 2012. This year is the first decrease in North Dakota job fatalities since 2009.
Not surprisingly, the oil and gas industry in North Dakota has been a major source of these fatalities. In 2013, 11 worker deaths were reported in the oil and gas extraction industries. Construction and extraction occupations accounted for 16 deaths, one-third of the job-related fatalities in the state. The fatality rate in the mining and oil and gas extraction sector in North Dakota was an alarming 84.7/100,000, nearly seven times the national fatality rate of 12.4/100,000 in this industry.4 The fatality rate in construction was 44.1/100,000, more than four times the national construction fatality rate of 9.7/100,000.
Industry, Occupation and Event Comparisons
The construction sector had the largest number of fatal work injuries (828) in 2013 followed by transportation and warehousing (733) and agriculture, forestry, fishing and hunting (500). Industry sectors with the highest fatality rates were agriculture, forestry, fishing and hunting (23.2 per 100,000); transportation and warehousing (14.0); and mining, quarrying and oil and gas extraction (12.4).
The number of deaths in construction increased in 2013, after years of decline with 806 deaths in 2012; the fatality rate decreased from 9.9 in 2012 to 9.7 in 2013. In manufacturing, the number of fatalities was 312, less than 2012. The 2013 fatality rate in manufacturing also decreased since 2012, to 2.1 per 100,000 workers. Fatalities in the mining industry decreased from 181 deaths in 2012 to 155 in 2013; and the rate is lower at 12.4 per 100,000 workers. Within the mining industry in 2013, BLS reported 112 deaths in oil and gas extraction—a decrease from the previous year’s all-time high of 142. According to separate statistics reported by the Mine Safety and Health Administration (MSHA), in 2013 there were 16 deaths in coal mining and 28 deaths in metal and nonmetal mining.
Transportation and material moving occupations had the highest number of fatalities with 1,255 deaths, followed by construction and extraction occupations with 845 fatal injuries. The occupations at greatest risk of experiencing work-related fatalities were the same as the previous year: Logging workers (91.3 per 100,000); fishers and related fishing workers (75.0 per 100,000); and aircraft pilots and flight engineers (50.6 per 100,000).
Transportation incidents, in particular roadway crashes, continue to be the leading cause of workplace deaths, responsible for 1,865 or 41% of all fatalities in 2013. Roadway incidents involving motorized land vehicles accounted for 24% of the fatal work injury total (1,099).
The number of fatalities from falls, slips or trips increased, with 724 fatal falls reported in 2013, compared with 704 fatal falls reported in 2012.
In 2013, male workers were at greater risk of death on the job than female workers, with a fatality rate of 5.4 per 100,000 workers, compared with a rate of 0.5 per 100,000 among women. Men accounted for 93% of job fatalities (4,265) and women accounted for 7% (319). For men, the leading causes were roadway incidents (24%), falls (16%) and contact with objects and equipment (16%).
For women, the leading causes of death were roadway incidents (28%), homicide (21%) and falls (12%). Homicides in the workplace continue to be a disproportionate cause of death for women (21%) compared with men (8%). Notably, women worker fatalities due to roadway incidents increased in 2013 and is now greater than the proportion of male workplace fatalities: In 2013, roadways incidents were responsible for 28% of female deaths and 24% of male deaths, compared with 22% of female deaths and 25% of male deaths in 2012. In 2013, roadway incidents were the leading cause of death for women in the workplace.
In response to concerns about the safety and health risks associated with contract work, for the past three years BLS has reported fatalities that involve workers employed as contractors. In 2013, there were 749 fatalities among contract workers, an increase from 715 contractor deaths reported in 2012. Construction and extraction workers accounted for about half of the deaths among contract workers, with 371 fatalities reported among these workers. Falls were the biggest cause of contractor deaths (242), followed by contact with objects and equipment (196) and transportation incidents (149). Thirty-five percent of contract workers who died in the construction industry actually were contracted to another industry when the fatal injury occurred. Eighty-five percent of contract worker fatalities were wage and salary workers, not self- employed.
The job fatality rate for all self-employed workers—a group that lacks OSHA coverage— continues to remain high at 11.8. In 2012, it was 12.8.
Workplace Violence Fatalities
Workplace violence continues to be the second-leading cause of job fatalities in the United States, with 773 deaths caused by assaults and violent acts reported in 2013, accounting for 17% of all traumatic injury workplace deaths. This compares with 765 deaths related to workplace violence in 2012.
Homicide once again was a major cause of death with 404 deaths reported in 2013, a decrease from the 475 homicides reported in 2012. However, work-related suicides are on the rise: There were 282 workplace suicides in 2013, compared with 250 in 2011 and 249 in 2012. Toxic work environments that include workplace bullying and increased work pressures most likely have contributed to this growing problem.
Workplace homicide was the second leading cause of job death among women workers in 2013, accounting for 21% of their work-related fatalities (66 out of 319 deaths).
Black workers were at greatest risk of workplace homicide in 2013, experiencing 25% of all such deaths (100 out of 404), while representing only 10% of total employment (hours worked). Among white workers, 188 homicides were reported (47% of all homicides), and among Latino workers there were 67 deaths from homicide (17%). For black workers, homicides were responsible for 23% of work-related deaths (100 out of 439 deaths), compared with 6% among white workers (188 out of 3,125 deaths) and 8% among Latino workers (67 out of 817 deaths).
The leading source of death from workplace homicide was assault by an assailant or suspect (211 deaths), and co-workers were responsible for 74 homicide deaths in 2013. Firearms were the primary weapon involved in workplace homicides, causing 323 workplace deaths.
The leading occupations for workplace homicide were supervisors of sales workers (46 deaths), retail sales workers (43 deaths) and motor vehicle operators (37 deaths). Retail trade was the industry with the largest number of workplace homicides in 2013 (95 deaths), followed by accommodation and food services (69 deaths), local government (39 deaths), and transportation and warehousing (36 deaths—taxi service accounted for 25 of these deaths).
Hispanic or Latino and Immigrant Worker Fatalities
In 2013, Latino workers continued to be at increased risk of dying on the job, with a job fatality rate that is 18% greater than the overall job fatality rate of 3.3 per 100,000 workers.
In 2013, 817 Latino workers died on the job, an increase from 748 in 2012. The fatality rate for Latino workers also increased to 3.9 per 100,000 workers from 3.7 in 2012. At the same time, the number and rate of fatalities for other races declined or stayed the same from 2012 to 2013.
Since 2001, when the rate of Latino worker fatalities reached an all-time high of 6.0 deaths per 100,000 workers, there has been a decline in work-related deaths among Latinos, and the job fatality rate among Latino workers has been reduced by 35%. At the same time, the overall job fatality rate has declined by 23%. Hopefully, the recent increase in Latino worker deaths does not represent the beginning of a long-term trend.
In 2013, 66% of the fatalities (542 deaths) among Latino workers were among workers born outside of the United States. The states with the greatest number of Latino worker fatalities were California (194), Texas (192) and Florida (68). In California, particularly, almost half of all worker deaths were among Latinos. The number of Latino fatalities is one of the highest the state has ever seen. A 42% increase in Latino worker deaths in one year is alarming. Seventy-one percent of Latino workers who died on the job in California were immigrant workers. In Texas, immigrant workers now constitute 70% of Latino deaths, compared with 53% in 2012.
The construction industry was responsible for the greatest number of Latino worker deaths (241), followed by administrative and support and waste management and remediation services (116), and transportation and warehousing (83).
Events or exposures responsible for deaths of Latino workers were similar to the causes for all workers, with transportation incidents the leading event (267 deaths), followed by deaths from falls (179), contact with equipment (169) and violence (107). Deaths due to violence against Latino workers increased from 82 deaths the previous year: 32 of these violent deaths were work-related suicides, 20 among immigrants. The number of suicides among Latino workers in 2013 increased 146% since the previous year, and Latino immigrant work-related suicides increased more than 200%, both returning to their 2011 levels.
In 2013, there was a sharp increase in Latino deaths among grounds maintenance workers: 70 Latino workers died in these occupations compared with 41 in 2012. Specifically, deaths among tree trimmers and pruners doubled (to 33) among Latino workers since 2012 and 71 landscaping services deaths among Latinos were reported, of whom 60 were immigrants. The month of April saw the greatest increase in Latino worker deaths (79%), and workers who were killed by trees, logs and limbs also increased.
The number of Latinos who died on the job in 2013 in support activities for oil and gas operations have increased more than threefold since 2009, increasing each year: seven in 2009, 11 in 2010, 14 in 2011, 23 in 2012 and 24 in 2013. The trend of increasing numbers of Latino deaths was also true for the entire oil and gas industry: 23 Latino deaths in 2009, 25 in 2010, 30 in 2011, 36 in 2012 and 39 in 2013.
Fatalities among all foreign-born or immigrant workers continue to be a serious problem. In 2013, there were 879 workplace deaths reported among immigrant workers, an increase from the 824 deaths in 2012.
The four states with the greatest number of foreign-born worker fatalities in 2013 were California (176), Texas (134), Florida (74) and New York (60). Of the foreign-born workers who were injured fatally at work in 2013, 62% were Latino; 16% were white; 14% were Asian, Native Hawaiian or Pacific Islander; and 6% were black or African American. Of the foreign- born workers who were injured fatally at work in 2013, 41% were from Mexico.
The largest number of immigrant worker deaths was reported in the construction industry, at 217 out of 879 total deaths. Thirty-two percent of the foreign-born worker deaths resulted from transportation incidents, 21% from violent acts, 20% from falls, slips and trips, and 19% from contact with objects and equipment.
Job Injuries and Illnesses
In 2013, as in 2012, 3 million injuries and illnesses were reported in private-sector workplaces. The Bureau of Labor Statistics (BLS) survey also included data on work-related injuries and illnesses among state and local government workers: An additional 746,000 state and local government workers nationwide were injured or made sick in 2013, for a total of nearly 3.8 million reported work-related injuries and illnesses.
The national injury and illness rate for the private sector in 2013 was 3.3 per 100 workers, a decline from the rate reported by BLS for 2012 (3.4). The rate in 2013 for all industries, including state and local government workers, was higher at 3.5 per 100 workers, but a decline from 3.7 in 2012. The injury and illness rate in 2013 for state government workers was 3.9 per 100 workers and 5.7 for local government workers. The combined rate for state and local government employees of 5.2 remains statistically significantly higher than the rate in the private industry.
The health care and social assistance industry accounted for the greatest percentage (20.9%) of the nonfatal workplace injuries and illnesses in private industry in 2013, followed by manufacturing (15.9%) and retail trade (14.6%). Workers in the construction industry experienced 6.8% of all private-sector injuries and illnesses in 2013.
The industry with the highest rate of nonfatal workplace injuries and illnesses continues to be nursing and residential care facilities (state government, 13.7 per 100 workers), followed by pet and pet supplies (private industry, 11.8), police protection (local government, 11.5), fire protection (local government, 11.2), veterinary services (private industry, 11.0) and skiing facilities (private industry, 10.1).
Thirty-one percent of all cases of injuries and illnesses involving days away from work, job transfer or restriction in private industry occurred in the trade, transportation and utilities industry, followed by education and health services at 19%, manufacturing at 17% and construction at 8%. Occupations in private industry with the highest number of injuries involving days away from work were laborers and freight, stock and material hand movers; heavy and tractor-trailer truck drivers; nursing assistants; retail salespersons; production workers; light truck or delivery service drivers; stock clerks and order fillers; maintenance repair workers; and janitors and cleaners.
Women workers suffered 38% of lost-time injuries reported (350,510 out of 917,090 cases) in 2013—the same proportion as the previous year. The total number of cases increased.
The leading industries for injuries and illnesses among women were nursing and residential care facilities, hospitals, and food services and drinking places. Nursing, psychiatric and home health aides experienced the greatest number of injuries. Overexertion was the major cause of these injuries, and the major injury type was sprains, strains and tears. All of these characteristics of lost-time injuries among women workers have been consistent over the past several years.
Among men, 562,790 cases resulting in days away from work were reported in 2013, accounting for 62% of total lost-time injuries. Specialty trade contracting, truck transportation, and food services and drinking places reported the largest number of injuries. Among men, driver/sales workers and truck drivers, laborers and material movers, and maintenance and repair workers were the leading occupations for lost-time injuries. For men, overexertion was the leading cause of injury, and sprains, strains and tears was the leading type of injury.
For all workers, overexertion and bodily reaction (including lifting and repetitive motion) was the leading exposure resulting in injury, responsible for 35% of all lost-time injury cases in private industry, followed by falls, slips and trips (25%), contact with objects (25%) and transportation incidents (5%).
In 2013, there were 38,500 lost-time injuries reported in private-sector workplaces resulting from violence, with 26,520 of these being injuries caused by a person. Women were at much greater risk of injuries from workplace violence, experiencing 70% of such injuries (18,570 out of 26,520 cases), an increase from the previous year. Workers in the health care industry were particularly affected, with nursing and residential care facilities experiencing the greatest number of injuries from violence, followed by hospitals, social assistance and ambulatory health care services. Nursing, psychiatric and home health aides, registered nurses, and personal care aides were the occupations at greatest risk of injuries from violence, and patients were responsible for 52% of reported injuries related to violence.
The median number of days away from work for lost-time injury cases in private industry was eight days in 2013, with 29% of all days away from work cases resulting in 31 or more days away from work.
Musculoskeletal Disorders
For 2013, BLS reported 307,640 musculoskeletal disorder (MSD) cases resulting in days away from work in the private sector, the first decrease since 2009. MSDs accounted for 33.5% of all injuries and illnesses involving days away from work, and remain the largest category of injury and illness.
The occupations reporting the highest number of MSDs involving days away from work in 2013 were nursing assistants (22,000); laborers and freight, stock, and material movers, handlers (21,080); heavy and tractor-trailer truck drivers (15,730); and janitors and cleaners (14,390). The median number of days away from work for MSDs in 2013 was 11 days.
Industries with the highest incidence rates of musculoskeletal disorders involving days away from work in 2013 were air transportation (195.9 per 10,000 workers), couriers and messengers (118.7), nursing and residential care facilities (88.4); warehousing and storage (87.9); fishing, hunting and trapping (75.9); truck transportation (75.4); and waste management and remediation services (72.4).
In 2013, the MSD incidence rate across all industries in the United States was 35.5 per 10,000 workers, equal to the rate in 2012.
It is important to recognize the numbers and rates of MSDs reported by BLS represent only a part of the total MSD problem. The BLS MSD data are limited to cases involving one or more days away from work, the cases for which BLS collects detailed reports. Similar detailed reports are not collected for injuries and illnesses that do not involve lost work time or those that result in job transfer or restriction but not in time lost from work. Based on the percentage of days away from work cases involving MSDs (33.5%) in 2013, there were an estimated 215,348 MSDs that resulted in restricted activity or job transfer, 522,988 MSD cases that resulted in days away from work, restricted activity or job transfer, and a total of 1,015,212 MSDs reported by private- sector employers.
Moreover, these figures do not include injuries suffered by public-sector workers or postal workers, nor do they reflect the underreporting of MSDs by employers. Based on studies and experience, OSHA has estimated that MSDs are understated by at least a factor of two—that is, for every MSD reported, there is another work-related MSD that is not recorded or reported.5 However, a study that examined undercounting of injuries and illnesses found that underreporting is even greater, with two additional injuries occurring for every injury that is reported.6
Reported Cases Understate Problem
In recent years there has been increased attention to and concern about the accuracy and completeness of the injury and illness data reported by employers that form the basis for the BLS Annual Survey on Occupational Injuries and Illnesses (SOII). While government statistics show that occupational injury and illness are declining, numerous studies have shown government counts of occupational injury and illness are underestimated by as much as 69%.7 published in the April 2006 Journal of Occupational and Environmental Medicine that examined injury and illness reporting in Michigan made similar findings.8 The study compared injuries and illnesses reported in five different databases—the BLS Annual Survey, the OSHA Annual Survey, the Michigan Bureau of Workers’ Compensation, the Michigan Occupational Disease reports and the OSHA Integrated Management Information System. It found that during the years 1999, 2000 and 2001, the BLS Annual Survey, which is based upon employers’ OSHA logs, captured approximately 33% of injuries and 31% of illnesses reported in the various databases in the state of Michigan.
A similar study published in 2008 comparing the injuries reported to state workers’ compensation systems with those reported to the Bureau of Labor Statistics Annual Survey in six states for the years 1998–2001 found similar results.9 The study, which examined reporting in Minnesota, New Mexico, Oregon, Washington, West Virginia and Wisconsin, found the BLS survey captured 50% to 75% of the injuries and illnesses that occurred, missing half to a quarter of the injuries and illnesses that occurred in these states. As with the Michigan study, more injuries and illnesses were reported to the state workers’ compensation systems than to the BLS survey.
As a follow-up to these findings, BLS funded additional research to examine the subject of undercounting and underreporting of work-related injuries and illnesses. The results of this research were published in a special issue of the American Journal of Industrial Medicine in October 2014. The research studies focused on injury reporting in three states—California, Massachusetts and Washington. The studies used different methodologies, but all examined data reported to different systems (e.g., BLS SOII, state workers’ compensation, and health care facility data). Each of the studies found that the BLS SOII significantly undercounted the injuries that occurred.
The study of California injury and illnesses which examined data from the BLS SOII and state workers’ compensation found that the BLS survey captured 42.4% to 49.0% of work-related injuries and illnesses involving at least four days away from work. Workers’ compensation reporting was more complete, capturing 76.9% to 77.6% of such injuries.10
A study of work-related amputations in Massachusetts found that the BLS SOII undercounted amputations by 48%. Further analysis of the data found that a number of amputations were reported in SOII as a different type of injury. But 24% of amputations were not reported at all.11
A study of injury and illness reporting in Washington State found similar problems with differences in injury classification between the BLS survey and state workers compensation system. An examination of injury cases that were reported to both BLS and workers compensation found that the workers’ compensation system identified 94% more amputations than the number of amputation injuries identified using BLS coding. But for musculoskeletal disorders (MSD), the researchers found that BLS coding identified 34% more MSD cases than those identified in the workers’ compensation system.12
These studies and others have identified a number of factors that contribute to the undercount of workplace injuries and illnesses in the United States. The BLS survey excludes many categories of workers (self-employed individuals; farms with fewer than 11 employees; employers regulated by other federal safety and health laws; federal government agencies; and private household workers). This results in the exclusion of more than one in six workers from the BLS Annual Survey.13 As recent studies have documented, there also are problems with the classification of injuries, which may lead to an underestimate of a particular type of injury (e.g. amputations). A lack of knowledge or confusion by employers of what injuries are required to be reported on the OSHA 300 injury log, which also may lead to underreporting.
But in addition to these problems, there also are incentives and disincentives that impact the reporting of injuries by employers and workers.
For employers these incentives or disincentives may include:
- Concern about increased workers' compensation costs for increased reports of injuries;
- Fear of being denied government contracts due to high injury rates;
- Concern about being targeted by OSHA for inspection if a high injury rate is reported; and
- The promise of monetary bonuses for low injury rates.
There also are significant incentives and disincentives that impact the reporting of injuries and illnesses by workers. Many employers have implemented programs that provide financial rewards or prizes to individual workers or groups of workers for having no injuries or a low injury rate. Other employers have implemented programs or policies that discipline workers for having an injury, regardless of the cause of the injury. Discipline can include warnings, suspension or even termination. Other employers conduct drug testing on all workers who report an injury. All of these policies and practices can suppress the reporting of injuries by workers.
Foreign-born workers face additional barriers to reporting injuries. They may not know how or to whom to report the injury. Undocumented workers may fear being fired, harassed or being reported to the U.S. Immigration and Customs Enforcement (ICE) agency.
The problem of injury and illness reporting has been the subject of a number of government reviews and investigations. In 2008, the House Education and Labor Committee held an oversight hearing to explore the extent, causes and impact of injury underreporting. In conjunction with the hearing, the committee released a report—“Hidden Tragedy: Underreporting of Workplace Injuries and Illnesses”—that documented the widespread problem of underreporting.14
In October 2009, the U.S. Government Accountability Office (GAO) released a report on an in- depth evaluation on injury and illness reporting and employer injury recordkeeping practices.15 The study found OSHA’s procedures to audit the accuracy of employer injury records were deficient, and that in many workplaces there were significant pressures on workers not to report injuries. As part of the review, GAO conducted a survey of more than 1,000 occupational physicians and other occupational health professionals. Sixty-seven percent of those surveyed reported they had observed fear among workers of disciplinary action for reporting injuries. Fifty-three percent of the health practitioners reported pressure from company officials to downplay the seriousness of injuries and illnesses, and more than one-third had been asked by employers or workers not to provide needed medical treatment to keep the injury from being recorded.
In 2012, GAO released another report that examined safety incentive programs—“Workplace Safety and Health: Better OSHA Guidance Needed on Safety Incentive Programs.”16 Based on a survey conducted in conjunction with the study, GAO estimated that three-quarters of U.S. manufacturers had safety incentive programs or other workplace policies that could affect workers’ reporting of injuries and illnesses. Demerit systems were the most prevalent, reported by 69% of manufacturing firms, followed by post-incident drug testing (56% of firms), rate- based incentive programs (22% of firms) and behavior-based programs (14% of firms). Many employers had more than one kind of program or policy in place.
As discussed later in this report, OSHA also has been addressing the issue of injury reporting through its whistleblower program, issuing policy guidance on the types of employer safety incentive and disincentive policies and practices that could constitute illegal retaliation under Section 11(c) and other whistleblower statutes, and stepping up enforcement under these laws. However, enforcement under 11(c) only addresses individual cases of retaliation, not more systematic practices by employers. Unions have urged OSHA to adopt specific prohibitions on employer policies, practices and programs that discourage injury reporting through regulatory action. OSHA now is considering such action as part of the rulemaking on injury reporting.
Cost of Occupational Injuries and Deaths
The cost of occupational injuries and deaths in the United States is staggering, estimated at $250 billion to $360 billion a year, according to two recent studies.
The 2014 Workplace Safety Index, published by Liberty Mutual Insurance, estimated the cost of disabling workplace injuries to employers at $59.5 billion a year—more than $1 billion per week.17 This analysis, based on 2012 data, estimated direct costs to employers (medical and lost wage payments) of injuries resulting in cases involving six or more days of lost time. If indirect costs also are taken in account, the overall costs are much higher. Based on calculations used in its previous Safety Index, the Liberty Mutual data indicate businesses pay between $178 billion and $357 billion annually in direct and indirect (overtime, training and lost productivity) costs on workers’ compensation losses (indirect costs are estimated to be two to five times direct costs).18 It is important to note that Liberty Mutual bases its cost estimates on BLS injury data. Thus all of the problems of underreporting in the BLS system apply to the Liberty Mutual cost estimates as well.
A 2011 comprehensive study on the “Economic Burden of Occupational Injury and Illness in the United States” by J. Paul Leigh at the University of California, Davis found similar results. The study examined a broad range of data sources, including data from the BLS, Centers for Disease Control and Prevention, the National Council on Compensation Insurance and the Healthcare Cost and Utilization Project, to determine the cost of fatal and nonfatal occupational injuries and illnesses for 2007. This study estimated the medical and indirect (productivity) costs of workplace injuries and illnesses at $250 billion annually, more than the cost of cancer.19
A follow-up analysis by Leigh found that workers’ compensation covered only 21% of these costs, with 13% being born by private health insurance, 11% by the federal government and 5% by state and local governments. The majority of the costs—50 percent—was borne by workers and the family members.
A recent report by the Occupational Safety and Health Administration—“Adding Inequality to Injury: The Costs of Failing to Protect Workers on the Job”—outlined how work-related injuries have devastating impacts on workers and their families. According to the report, workers who are injured on the job suffer great economic loss. Even after receiving workers’ compensation benefits, injured workers’ incomes are, on average, nearly $31,000 lower over 10 years, had they not suffered an injury.20
One of the major contributors to the severe loss of income is the gross deficiencies and inequities in the workers’ compensation system, which continues to be governed by 50 different state laws. A 2015 multipart series by Pro Publica and National Public Radio (NPR) exposed the failure of the workers’ compensation system to provide fair and timely compensation for workers hurt on the job.21 The series—“Insult to Injury: America’s Vanishing Worker Protections”—was based on a yearlong investigation which found that over the last decade there has been a systematic effort by insurers and employers to weaken workers’ compensation benefits for injured workers. Since 2003, legislators in 33 states have passed legislation reducing benefits or limiting eligibility. The benefits provided to workers vary widely across different states. For example, the maximum compensation for loss of an eye in Pennsylvania is $261,525, but only $27,280 in Alabama. In many states, employers have great control over medical decisions. Workers are not allowed to pick their own doctors, and employers can demand review by “independent medical examiners” picked by employers who can challenge medical determinations regarding the work- relatedness of the condition, the degree of disability and prescribed medical treatment. According to Pro Publica, all of these factors have contributed to the demolition of the workers’ compensation system and left injured workers and their families and society at large bearing the costs of their injuries.
22013 fatality data is from the BLS 2013 Census of Fatal Occupational Injuries, Final Release, April 22, 2015.
3The District of Columbia also saw a sharp increase in worker fatalities in 2013, when 25 workers died on the job, compared with 11 in 2012. One catastrophic shooting was responsible for 12 of the fatalities in 2013. Similarly, the job fatality rate for Washington, D.C., in 2013 was unusually high at 7.3, compared with 3.6 in 2012.
4Also as a comparison, the 2013 fatality rates for mining, oil and gas extraction in the other states for which BLS reports data were: Illinois (63.5), New Mexico (37.3), West Virginia (36.3), Kansas (28.2), Texas (11.2), Oklahoma (7.7) and Louisiana (6.6).
564 F.R. 65981 and 65 F.R. 68758.
6Rosenman, K.D., Kalush, A., Reilly, M.J., Gardiner, J.C., Reeves, M. and Luo, Z., “How Much Work-Related Injury and Illness is Missed by the Current National Surveillance System?,” Journal of Occupational and Environmental Medicine, Vol. 48, No. 4, pp. 357–367, April 2006.
7Leigh, J. P., Marcin, J.P. and Miller, T.R., “An Estimate of the U.S. Government’s Undercount of Nonfatal Occupational Injuries,” Journal of Occupational and Environmental Medicine, Vol. 46, No. 1, January 2004.
8Rosenman, op. cit.
9Boden, L.I. and A. Ozonoff, “Capture-Recapture Estimates of Nonfatal Workplace Injuries and Illnesses,” Annals of Epidemiology, Vol. 18, No. 6 (2008).
10Boden, L.I., “Capture-Recapture Estimates of the Undercount of Workplace Injuries and Illnesses: Sensitivity Analysis,” American Journal of Industrial Medicine, Vol. 57, No. 10 (2014).
11Davis, L, Grattan, K, Tak, S, Bullock, L, Ozonoff, A and Boden, L., “Use of Multiple Data Sources for Surveillance of Work-related Amputations in Massachusetts, Comparisons with Official Estimates and Implications for National Surveillance,” American Journal of Industrial Medicine, Vol. 57, No. 10, 2014.
12Wuellner, S. and Bonato, D, “Injury Classification Agreement in Linked Bureau of Labor Statistics and Workers’ Compensation Data,” American Journal of Industrial Medicine, Vol. 57, No. 10, 2014.
13Leigh, J. Paul, Marcin, J.P. and Miller, T.R., “An Estimate of the U.S. Government’s Undercount of Non-Fatal Occupational Injuries,” Journal of Occupational and Environmental Medicine, Vol. 46, No. 1, 2004.
14Majority Staff Report, House of Representatives, Committee on Education and Labor, “Hidden Tragedy: Underreporting of Workplace Injuries and Illnesses,” June 2008.
15“Workplace Safety and Health: Enhancing OSHA’s Records Audit Process Could Improve the Accuracy of Worker Injury and Illness Data,” GAO-10-10, Oct. 15, 2009, www.gao.gov/new.items/d1010.pdf.
16 Workplace Safety and Health: Better OSHA Guidance Needed on Safety Incentive Programs,” GAO-12-329, April 2012, www.gao.gov/assets/590/589961.pdf.
17 2014 Liberty Mutual Workplace Safety Index. Report available at: www.libertymutualgroup.com/omapps/ContentServer?c=cms_document&pagename=LMGResearchInstitute%2Fcm s_document%2FShowDoc&cid=1138365240689.
18 April 16, 2002, News Release, Liberty Mutual Research Institute for Safety.
19 Leigh, J. P., “Economic Burden of Occupational Injury and Illness in the United States,” The Milbank Quarterly, Vol. 89, No. 4, 2011.
OSHA ENFORCEMENT AND COVERAGE
When it comes to job safety enforcement and coverage, it is clear OSHA lacks sufficient resources to protect workers adequately. A combination of too few OSHA inspectors and low penalties makes the threat of an OSHA inspection hollow for too many employers. More than 8 million workers still are without OSHA coverage.Compliance Staffing and Inspections
The Obama administration has moved to enhance enforcement and increase the inspection staff. But OSHA’s resources remain inadequate to meet the challenge of ensuring safe working conditions for America’s workers. In FY 2015, there were at most 1,882 federal and state OSHA inspectors responsible for enforcing the law at more than 8 million workplaces, fewer than the previous year.22 In FY 2014, the 847 federal OSHA inspectors conducted 36,167 inspections (3,011 fewer than in FY 2013), and the 1,035 inspectors in state OSHA agencies combined conducted 47,217 inspections (3,407 fewer than in FY 2013). The federal government shutdown in October 2014 contributed to these reductions in inspection activity.
The majority of federal OSHA’s inspections were in the construction industry (50%), followed by manufacturing (22%), and transportation and warehousing (4%). The health care and social assistance sector, which accounted for 21% of private-sector work-related injuries and illnesses, and 16% of private-sector employment in 2013, received less than 3% of federal OSHA inspections in FY 2014.
In the OSHA state plans, the construction industry accounted for 41% of inspections and the manufacturing industry accounted for 16%. But the state plans, which cover both public- and private-sector workers, conducted more of their inspections in public administration (6%), administrative support and waste management (5%), retail trade (5%), and health care and social assistance (4%) than federal OSHA.
At its current staffing and inspection levels, it would take federal OSHA, on average, 140 years to inspect each workplace under its jurisdiction just once. In 10 states (Arkansas, California, Delaware, Florida, Georgia, Louisiana, Nebraska, South Dakota, Texas and West Virginia), it would take 150 years or more for OSHA to pay a single visit to each workplace. In 28 states, it would take between 100 and 149 years to visit each workplace once. Inspection frequency generally is better in states with OSHA-approved plans, yet still is far from satisfactory. In these states, it now would take the state OSHA plans a combined 91 years to inspect each worksite under state jurisdiction once.
The current level of federal and state OSHA inspectors provides one inspector for every 71,695 workers. This compares with the benchmark of one labor inspector for every 10,000 workers recommended by the International Labor Organization for industrialized countries.23 In the states of Arkansas, Delaware, Florida, Louisiana, Massachusetts, Missouri, Nebraska, Texas and West Virginia, the ratio of inspectors to employees is greater than 1 per 100,000 workers.
Federal OSHA’s ability to provide protection to workers has greatly diminished over the years. When the AFL-CIO issued its first Death on the Job: The Toll of Neglect report in 1992, federal OSHA could inspect workplaces under its jurisdiction once every 84 years, compared with once every 140 years at the present time. Since the passage of the OSH Act, the number of workplaces and number of workers under OSHA’s jurisdiction has nearly doubled, while at the same time the number of OSHA staff and OSHA inspectors has been reduced. In 1975, federal OSHA had a total of 2,435 staff (inspectors and all other OSHA staff) and 1,102 inspectors responsible for the safety and health of 67.8 million workers at more than 3.9 million establishments. In FY 2015, there were 2,224 federal OSHA staff responsible for the safety and health of 136 million workers at 8.8 million workplaces.
At the peak of federal OSHA staffing in 1980, there were 2,951 total staff and 1,469 federal OSHA inspectors (including supervisors). The ratio of OSHA inspectors per 1 million workers was 14.8. By 2014, there were only 986 federal OSHA inspectors (including supervisors), or 6.7 inspectors per 1 million workers.
Violations and Penalties
Penalties for significant violations of the law have increased under the Obama administration. In October 2010, OSHA announced a new penalty policy to more appropriately reflect the gravity of the violation and provide a greater deterrence. The new policy changed the formulas for calculating penalties to utilize more fully OSHA’s statutory authority for assessing penalties, (e.g., a $7,000 maximum penalty for serious violations and a maximum of $70,000 for willful and repeat violations), and to ensure deep discounts are not given for the most serious of violations.
The result of this change has been to double the average federal OSHA proposed penalty for serious violations. A violation is considered “serious” if it poses a substantial probability of death or serious physical harm to workers. In FY 2014, the average penalty for a serious violation for federal OSHA was $1,972, compared with an average penalty of $1,895 for such violations in FY 2013 and $2,156 in FY 2012. While an improvement, the average penalty for serious violations remains well below the $7,000 penalty for serious violations provided for in the OSH Act.
In the state OSHA plans, the average penalty for a serious violation remains low; in FY 2014 it was $1,043, similar to the average serious penalty of $1,011 in FY 2013. In FY 2014, Oregon had the lowest average penalty for serious violations at $364, while California continued to have the highest average penalty at $5,733 per serious violation.
The number of willful violations issued by federal OSHA increased from 316 in FY 2013 to 433 in FY 2014. The average penalty for willful violations increased from $39,509 per willful violation in FY 2013 to $40,358 in FY 2014. For repeat violations, the average penalty per violation increased from $6,272 in FY 2013 to $6,909 in FY 2014.
In the state OSHA plan states, in FY 2014, there were 152 willful violations issued, with an average penalty of $32,266 per violation, and 2,244 repeat violations, with an average penalty of $3,004 per violation.
OSHA enforcement in cases involving worker fatalities, while somewhat improved, remains too weak. According to OSHA inspection data, the average total penalty in a fatality case in FY 2014 was just $10,640 for federal and state OSHA plans combined. However, averages can distort the real picture of fatality penalties in situations in which large cases with very high penalties raise the averages substantially. Using median penalties that capture the point where half of the penalties are below and half the penalties are above the median provides a better picture of the typical penalties in cases involving worker deaths.
The median penalty per fatality investigation conducted in FY 2014 was $5,050 for federal OSHA and the median current penalty was $4,438 for the state OSHA plans combined, according to enforcement data provided by OSHA in March 2015. This compares with a median penalty of $5,600 for federal OSHA in FY 2013, and a median penalty of $6,100 in FY 2013 for the state OSHA plans. These data, both averages and median penalties, also include enforcement cases that still are under contest, and it is likely that after settlements and final resolution, these penalty levels will be much lower.
A state-by-state analysis of fatality investigations shows penalties in cases involving worker deaths vary widely from state to state. In FY 2014, Rhode Island had an average total penalty of $667 and a median initial and current penalties of zero dollars. Vermont had an average total penalty of $2,625 but a median initial penalty of zero dollars.24South Carolina had the next lowest median initial penalty for fatality investigations with $1,312 in penalties assessed, followed by Connecticut ($1,400), Oregon ($2,490), Washington ($2,600) and Oklahoma ($2,650). Hawaii had the highest median initial penalty ($29,178), followed by Minnesota ($25,825), California ($13,603) and Wyoming ($13,125).
The Obama administration has moved to strengthen OSHA enforcement, with an emphasis on the most serious violations and repeat violators. In FY 2014, there were 143 significant cases (classified by OSHA as those cases having total penalties of greater than $100,000) under federal OSHA’s jurisdiction, an increase from the 119 significant cases in FY 2013, but fewer than the 219 significant cases in FY 2012.
Enforcement Initiatives
In 2010 OSHA launched the Severe Violator Enforcement Program (SVEP) to focus on the most persistent and egregious violators. SVEP replaced the Bush administration’s Enhanced Enforcement Program (EEP), which had been criticized severely by the U.S. Department of Labor’s Office of Inspector General as deficient, particularly with respect to follow up of employers identified as needing enhanced oversight.25 SVEP focuses on employers who have a history of willful, repeated or failure to abate violations, particularly related to fatalities, major occupational safety and health hazards or underreporting of injuries or illnesses. The program provides for more frequent inspections, public notification and other measures at workplaces identified as severe violators, and provides for enhanced scrutiny of other establishments of the same employer.
As of Feb. 27, 2015, OSHA had logged 474 SVEP cases, of which 285 cases (60%) were in the construction industry. One hundred twenty-three (26%) of the SVEP cases were related to fatalities and 35 (8%) of SVEP cases resulted in egregious violations.26
A 2013 review conducted by OSHA found the program was working for many of the employers identified as severe violators. The review, which covered SVEP cases identified as of Sept. 30, 2011, and follow-up status as of February 2012, found that mandatory follow-up inspections were conducted and enhanced settlement provisions requiring measures beyond basic hazard abatement were being implemented.27
However, there were significant difficulties implementing the program in the construction industry, which accounts for the majority of SVEP cases. In particular, it was difficult to conduct follow-ups of construction employers. Only 25% of attempted follow-ups of SVEP construction employers were successful (17 out of 69 cases). OSHA found the primary reason was the small size and mobility of many of these employers. In addition, a number of these employers had gone out of business.
Another impediment to conducting follow-ups in the construction industry as well as in other industries was contests of violations. (Follow-up inspections are conducted only after a final order has been issued). OSHA found the overall contest rate of SVEP cases was 44%, compared with the national contest rate of 8% for the period studied. Until these contests were resolved, under the program no follow-up is possible.
In 2013, OSHA launched a Temporary Worker Initiative (TWI) to help prevent injuries and illnesses among temporary workers. The number of temporary workers—those employed by a staffing agency and supplied to a host employer—has grown and many of these workers may be at increased risk of injury. As part of the initiative, OSHA has issued a policy statement making clear that both staffing agencies and host employers have responsibility to comply with the law and regulations, although the assignment of these responsibilities may vary depending on the particular circumstances.28 OSHA has taken numerous enforcement actions for violations involving temporary workers, often holding both the staffing agency and the host employer responsible for the failure to comply.
OSHA also has broadened its corporate-wide enforcement efforts seeking to require correction of similar hazards and violations at multiple establishments of the inspected employer. While OSHA has utilized enterprise-wide abatement for many years through corporate-wide settlement agreements, in 2010 in an enforcement action against the U.S. Postal Service, OSHA sought an order from the Occupational Safety and Health Review Commission to require 350 locations of the USPS to correct electrical safety violations, based upon inspection findings at multiple locations. In 2013, USPS and OSHA reached a settlement agreement, under which the Postal Service revised its policies and procedures on electrical work, and enhanced training and personal protective equipment for this work. In 2012, OSHA filed a similar complaint against the DeMoulas Super Markets Inc., a New England-based grocery chain, seeking to protect employees from fall and laceration hazards at 60 of the company’s stores in Massachusetts and New Hampshire. And in 2015, following multiple inspections that identified significant safety violations at freight terminals operated by Central Transport LLC, OSHA filed a complaint seeking to have the employer remove defective forklifts from all of its locations nationwide.
Criminal Enforcement
Criminal enforcement under the Occupational Safety and Health Act has been rare. According to information provided by the Department of Labor (DOL), since the passage of the act in 1970, only 88 cases have been prosecuted under the act, with defendants serving a total of 100 months in jail. During this time, there were more than 390,000 workplace fatalities, according to National Safety Council and BLS data, about 20% of which were investigated by federal OSHA.29,30
By comparison, EPA reported in FY 2014 there were 271 criminal enforcement cases initiated under federal environmental laws and 187 defendants charged, resulting in 155 years of jail time and $63 million in fines and restitution—more cases, fines and jail time in one year than during OSHA’s entire history.31 The aggressive use of criminal penalties for enforcement of environmental laws and the real potential for jail time for corporate officials serve as a powerful deterrent.
The criminal penalty provisions of the OSH Act are woefully inadequate. Criminal enforcement is limited to those cases in which a willful violation results in a worker’s death or where false statements in required reporting are made. The maximum penalty is six months in jail, making these cases misdemeanors. Criminal penalties are not available in cases in which workers are endangered or seriously injured, but no death occurs. This is in contrast to federal environmental laws, where criminal penalties apply in cases where there is “knowing endangerment” and the law makes such violations felonies. As a result of the weak criminal penalties under the OSH Act, few cases are prosecuted by the Justice Department under the statute. Instead, in some instances DOJ will prosecute OSHA cases under other federal statutes with stronger criminal provisions if those laws have been violated.
In response to the OSH Act’s severe limitations, in 2005 the Justice Department launched a Worker Endangerment Initiative. This initiative focuses on companies who put workers in danger while violating environmental laws, and prosecutes such employers using the much tougher criminal provisions of environmental statutes. Under the initiative, the Justice Department has prosecuted McWane Inc., a major manufacturer of cast iron pipe, responsible for the deaths of several workers; Motiva Enterprises for negligently endangering workers in an explosion that killed one worker and caused major environmental releases; British Petroleum for a 2005 explosion at a Texas refinery that killed 15 workers; W.R. Grace for knowing endangerment of workers exposed to asbestos-contaminated vermiculite in Libby, Mont.; and Tyson Foods for exposing employees to hydrogen sulfide gas, which resulted in the poisoning of several workers at multiple facilities. These prosecutions have resulted in many convictions and significant jail time for defendants.32,33
Recently, the Department of Labor (DOL) has placed a greater emphasis on criminal enforcement, referring more cases for criminal prosecution to the Department of Justice and U.S. attorneys. In addition DOL has expanded assistance to local prosecutors in the investigation and prosecution of cases involving worker deaths and injuries. In FY 2014, DOL referred or assisted with the criminal prosecution of 27 cases involving worker deaths—the highest number of such cases in the agency’s history.
While this increased emphasis on criminal enforcement is most welcome, criminal prosecutions for worker safety violations still are very rare. As long as the criminal penalty provisions of the OSH Act remain so weak, there will be few criminal prosecutions for job safety violations, even those that result in worker deaths.
Voluntary Programs
Under the Bush administration, OSHA placed great emphasis on the expansion of its voluntary programs, particularly OSHA’s program of alliances and Voluntary Protection Programs (VPP). The resources devoted to these programs increased and the number of voluntary programs increased significantly. Under the Obama administration, the emphasis has changed to focus more on strengthening enforcement programs. Voluntary programs still are part of the OSHA program, but are viewed as supplemental to, not a replacement for, enforcement. In FY 2014, OSHA formed 25 new alliances, down from 33 in FY 2013. The total number of active alliances in FY 2014 is 348, up from 336 in FY 2013. In OSHA’s Voluntary Protection Program (VPP), 28 new VPP sites were approved in FY 2014, down from 66 in FY 2013, bringing the total number of federal OSHA VPP sites at the end of FY 2014 to 1,489.34
Coverage
The current OSHA law still does not cover 8 million state and local government employees in 25 states and the District of Columbia, although these workers encounter the same hazards as private-sector workers and in many states have a higher rate of injury than their private-sector counterparts.35
Similarly, millions who work in the transportation and agriculture industries and at Department of Energy contract facilities lack full protection under the OSH Act. These workers theoretically are covered by other laws, which in practice have failed to provide equivalent protection.
In 2013, there was major progress in extending OSHA coverage to flight attendants when the Federal Aviation Administration (FAA) rescinded a longstanding policy and ceded jurisdiction on a number of key safety and health issues to OSHA. Specifically, FAA issued a new policy that extended OSHA regulations and jurisdiction on hazard communication, bloodborne pathogens, hearing conservation, recordkeeping and access to employee exposure and medical records to cabin crews.36
This policy action was the culmination of decades of efforts by the flight attendant unions to secure OSHA protections for flight attendants. It finally was implemented in response to the FAA Modernization and Reform Act of 2012 (PL 112-95).
Whistleblower Protection
Under the Obama administration, the Department of Labor has made the protection of a “worker’s voice” a priority initiative. As part of this effort, OSHA has undertaken a major effort to strengthen the Whistleblower Protection Program to protect workers who raise job safety issues and exercise other rights from employer retaliation.
In addition to enforcing the anti-discrimination provisions under section 11(c) of the Occupational Safety and Health Act, OSHA has the responsibility to enforce the whistleblower provisions of 21 other statutes, ranging from the Federal Rail Safety Act to the Sarbanes-Oxley finance law. A number of these laws deal with safety and health matters, but others do not. Many of these are relatively new statutes that have been assigned to OSHA for whistleblower enforcement without any accompanying increase in resources.
To strengthen anti-retaliation protections, in 2012 the Obama administration elevated the whistleblower program, creating a new separate Directorate of Whistleblower Protection Programs (WPP) at OSHA. (Previously, the program had been part of OSHA’s enforcement directorate.) This new office is charged with overseeing and coordinating whistleblower policy and enforcement and reports directly to the OSHA assistant secretary’s office. To improve the timeliness and consistency of case handling, the agency updated and revised its investigators’ manual and has trained staff on policies and procedures.
In December 2012, OSHA announced the formation of a new Whistleblower Protection Advisory Committee (WPAC) composed of representatives from labor, management and the public. The new committee is charged with overseeing and providing advice and guidance to OSHA on its whistleblower protection program.
OSHA also has created a separate budget line item for the whistleblower program that allows the amount of resources dedicated to this effort to be easily ascertained. For FY 2015, the budget for the program is $17.5 million, with 135 staff assigned, representing a modest increase over previous years. For FY 2016, the Obama administration has requested a $5.1 million increase and 22 more positions. The whistleblower program is one of the few OSHA programs that has received increases in funding during the last two budget cycles.
While the whistleblower program enforces the anti-retaliation provisions of 22 statutes, the OSHA 11(c) program is responsible for the majority of cases. In FY 2014, 57% of the cases received (1,751 out of 3,095) were 11(c) complaints. Large numbers of whistleblower cases also were filed under the Surface Transportation Act (470), the Federal Rail Safety Act (352) and the Sarbanes-Oxley Act (126).
In the last several years, the number of whistleblower complaints received by the agency has grown significantly, from 2,160 complaints in FY 2009 to 3,095 complaints received in FY 2014. While some of this increase is a result of the new statutes assigned to the program, the majority of the increase has been in the number of 11(c) cases filed under the OSH Act. From FY 2009 to FY 2014, the number of 11(c) cases received increased by 38%, from 1,267 cases to 1,751 cases.37 It is not clear whether this represents an increase in workplace discrimination for safety and health activities or an increase in filing due to enhanced outreach on worker rights by the Obama administration.
As a result of the increase in the number of filed cases, the backlog in cases has grown, and is a serious problem. Overall, the case backlog has increased from 1,247 cases in FY 2009 to 2,341 in FY 2014. For OSHA 11(c) cases, the number of backlogged or pending cases has grown from 663 to 1,267 during the same time period. Similarly, the amount of time for cases to be resolved also has increased, from an average of 151 days for all cases in FY 2009 to 355 days in FY 2014. For OSHA 11(c) cases, the average time cases were pending similarly increased from 138 days in FY 2009 to 352 days in FY 2014. This increase in time to resolve cases is particularly problematic under the OSH Act and those other statutes where there is no opportunity for preliminary reinstatement for workers while the case is being resolved, nor a separate right of action for the complainant to pursue the case on his or her own if the secretary fails or declines to act. Other whistleblower statutes provide for these rights. During this time, workers are left in limbo with no recourse or redress for discriminatory actions.
Under the Obama administration, OSHA has stepped up its enforcement actions under the Whistleblower Protection Program. In FY 2014, 809 retaliation cases were determined to be meritorious, with a total of $35.8 million in remedies (back pay, damages, etc.) secured, compared with 450 merit cases and $13.2 million in damages in FY 2009. The biggest awards were for cases brought under the Sarbanes-Oxley Act and the Federal Rail Safety Act, which in FY 2014 had average damages of $598,068 and $67,125 per case. For the 11(c) program, damage awards were much smaller. In FY 2014, there were 483 meritorious 11(c) cases, with damages averaging $7,346 per case.
OSHA also has been addressing the issue of injury reporting through its whistleblower program, in particular programs and policies that retaliate against workers or discourage workers from reporting injuries. In recent years there has been a growth in employers’ use of such programs in a wide range of industries.
Under OSHA regulations, reporting work-related injuries is a protected activity, and employers are prohibited from retaliating against workers who report injuries. The Federal Rail Safety Act, for which OSHA enforces the whistleblower provisions, also includes specific provisions that prohibit retaliation against workers who report injuries.
OSHA whistleblower enforcement data confirms that retaliation against workers who report job injuries is a significant problem. In FY 2014, 473 out of 3,149 discrimination cases processed involved retaliation for injury reporting. OSHA 11(c) cases accounted for 243 of these claims, of which 55 (23%) were found to have merit. Claims under the Federal Rail Safety Act accounted for 220 of the injury reporting retaliation cases, of which 61 cases (28%) were deemed meritorious.
To address the problems of retaliation related to injury reporting, OSHA issued a policy memorandum in March 2012 to provide guidance to the field.38 The memo outlines the types of employer safety incentive and disincentive policies and practices that could constitute illegal retaliation under section 11(c) and other whistleblower statutes, and the steps that investigators should take in responding to complaints of employer retaliation for injury reporting.
The memo does not expand current rights or protections, but reaffirms that reporting an injury is a protected activity and employer actions that interfere with or discourage the reporting of injuries are illegal. This policy memo has been very helpful to workers and unions in addressing employer practices that discourage workers from reporting injuries.
Over the past several years, in response to a growing number of worker anti-retaliation claims, OSHA has taken a number of actions to enforce against retaliation for reporting injuries. In a number of high-profile cases in the rail industry, including cases at Burlington Northern Santa Fe (BNSF) Railway, Union Pacific and Metro-North Railroad, OSHA has taken aggressive action, ordering reinstatement of workers and the cessation of injury discipline policies, and seeking punitive damages.
Action also has been taken against other employers under 11(c) of the OSH Act for similar practices. In a major enforcement action in February 2014, the Department of Labor filed suit under 11(c) against AT&T on behalf of 13 workers who had received unpaid suspensions after reporting work-related injuries. In addition, the states of Michigan and Indiana have taken enforcement actions against AT&T for retaliating against workers for reporting job injuries.
These enforcement actions have brought about changes by some employers. For example, in January 2013, OSHA signed an accord with the BNSF Railway Co. under which BSNF agreed to revise several policies that OSHA alleged dissuaded workers from reporting job injuries and violated the whistleblower provisions of the Federal Railroad Safety Act. Under the agreement, BNSF agreed to eliminate a policy that assigned points to employees who sustained work-related injuries, and changed the company’s disciplinary policy so that job injuries no longer are a factor in determining probations.
As a result of the lawsuits filed by the U.S. Department of Labor against AT&T for retaliating against workers for reporting injuries and grievances filed by the Communications Workers of America (CWA), the union representing the AT&T workers, the company changed its policy in 2014. The new policy requires an investigation and review of each accident /injury to determine whether the employee is at fault. If the investigation determines the worker is not at fault, no disciplinary action is taken. AT&T also agreed to fully compensate all affected CWA Ohio members/technicians and remove all references to related disciplinary action from their personnel files.
Even with the significant improvements that have been made in the whistleblower program, serious problems remain. The funding for this program is woefully inadequate. As noted above, OSHA now is responsible for enforcing the anti-retaliation provisions of 22 statutes. Almost no additional resources have been provided by Congress to enforce the additional statutes for which the agency has been given enforcement responsibility.
But the biggest impediments to protecting workers from retaliation for exercising their job safety rights are the deficiencies in the OSH Act itself. The anti-retaliation provisions of the law were adopted 44 years ago and are weak and outdated compared with more recently adopted statutes. The OSH Act only provides for 30 days for filing a discrimination complaint, compared with 180 days provided by a number of other laws. If a worker fails to file a complaint within this time period, he or she simply is out of luck.
The OSH Act also has extremely limited procedures for the enforcement of discrimination cases. If there is no agreement or settlement of the findings, the secretary of labor must bring cases in U.S. District Court. Most other statutes provide for an administrative proceeding. The formal procedures of the OSH Act mean that meritorious cases may be dropped, simply because the solicitor of labor does not have the resources to pursue them.
Moreover, unlike other statutes, such as the Mine Safety and Health Act and Surface Transportation Assistance Act, the OSH Act does not allow a complainant the right to pursue the case on his or own if the secretary fails to act within a designated time frame or declines to act at all. And the OSH Act does not provide for preliminary reinstatement, as other statutes such as the Mine Safety Act do, which means that workers who are retaliated against for exercising their job safety rights have no remedy while final action on their case is pending. These deficiencies in the whistleblower program only can be remedied through improvements in the OSH Act itself.
20U.S. Department of Labor. Occupational Safety and Health Administration. “Adding Inequality to Injury: The Costs of Failing to Protect Workers on the Job.” 2015. www.dol.gov/osha/report/20150304-inequality.pdf.
21Pro Publica and National Public Radio, “Insult to Injury: America’s Vanishing Worker Protections.” March 2015. www.propublica.org/series/workers-compensation.
22This reflects the number of federal inspectors plus the number of inspectors “on board” reflected in the FY 2014 state plan grant applications. It does not include compliance supervisors.
23International Labor Office, Strategies and Practice for Labor Inspection, G.B.297/ESP/3, Geneva, November 2006. The ILO benchmark for labor inspectors is one inspector per 10,000 workers in industrial market economies.
24Rhode Island conducted three fatality investigations and Vermont four fatality investigations in FY 2014.
25U.S. Department of Labor, Office of Inspector General–Office of Audit, “Employers with Reported Fatalities
Were Not Always Properly Identified and Inspected Under OSHA’s Enhanced Enforcement Program,” March 31,
2009, Report No. 02-09-203-10-105.
26Galassi, Tom, Director, Directorate of Enforcement, USDOL-OSHA, PowerPoint Presentation, American Bar
Association, 2015 Midwinter Meeting, Occupational Safety and Health Law Committee, March 2015.
27Occupational Safety and Health Administration, Severe Violator Enforcement Program White Paper, January
2013, www.osha.gov/dep/enforcement/svep_white_paper.pdf.
28Thomas Galassi, Director, Directorate of Enforcement Programs, Memorandum for Regional Administrators. Policy Background on the Temporary Worker Initiative, July 15, 2014.
29“Criminal Referrals by OSHA to DOJ or US Attorneys or Significant Aid to Local Prosecutors (Updated April 3,2015),” Information compiled by Office of the Solicitor of Labor. The information for the early years of the statute is incomplete and may not include all cases prosecuted.
30In addition to cases prosecuted under the Occupational Safety and Health Act and the U.S. federal criminal code (18 U.S.C. 1001), state and local prosecutors have prosecuted employers for deaths and injuries to workers under their state and local laws. There is no complete accounting of these cases.
31www2.epa.gov/enforcement/enforcement-annual-results-numbers-glance-fiscal-year-fy-2014.
32“Frontline: A Dangerous Business Revisited,” March 2008, www.pbs.org/wgbh/pages/frontline/mcwane/penalty/initiative.html.
33 Goldsmith, Andrew D., Worker Endangerment Initiative, PowerPoint Presentation, American Bar Association, Occupational Safety and Health Committee, Miami Beach, Fla., February 2009.
34OSHA Directorate of Cooperative and State Programs.
35Some states provide safety and health protection to public employees under state laws that are not OSHA approved-state plans. In 2014, the commonwealth of Massachusetts enacted legislation establishing legally binding safety and health protections for public employees, but this law has not been submitted for federal OSHA approval.
36Department of Transportation, Federal Aviation Administration, Occupational Safety and Health Standards for Cabin Crew Members, Aug. 21, 2013.
37Occupational Safety and Health Administration, OSHA Whistleblower Investigation Data, FY 2009–FY 2014.
38Richard E. Fairfax, Deputy Assistant Secretary, Memorandum for Regional Administrators, Whistleblower Program Managers, “Employer Safety Incentive and Disincentive Policies and Practices,” March 12, 2012.
REGULATORY ACTION
When the Obama administration took office in 2009, OSHA set an ambitious agenda to develop and issue much-needed standards to protect workers from life-threatening safety and health hazards, focusing first on rules that were stalled under the Bush administration. New standards to protect workers from silica dust, combustible dust and infectious diseases, and to require employers to set up safety and health programs to find and fix hazards, were top priorities, and OSHA began to move forward to develop and issue important, long-overdue rules.
In August 2010, OSHA completed the cranes and derricks in construction rule that was recommended by a negotiated rulemaking committee in 2004. In May 2011, OSHA finalized the standard on general working conditions in shipyard employment that had been proposed in 2007.
And in March 2012, OSHA finalized the standard on global harmonization that was proposed in 2009. The new Hazard Communication–Globally Harmonized System (GHS) rule adopts an international hazard identification and warning system for hazardous substances, so that U.S. labels, signs and safety data sheets contain similar information as those in other countries.
With the election of a Republican majority in the U.S. House of Representatives in 2010, the regulatory environment became extremely hostile. Business opposition to regulations intensified and Republicans in Congress launched a major assault on regulations, trying to block the development and issuance of new rules and roll back existing protections.
In the face of this intense assault, progress on needed protections stalled and many OSHA safety and health rules were delayed. OMB blocked or delayed important safety and health rules, holding them for regulatory review for many months or even years. The most significant delay involved the development and promulgation of OSHA’s silica dust standard, a rule to protect workers from silicosis, lung cancer and other diseases. The draft silica proposed rule was held for review by OMB for two and one-half years—from February 2011 until August 2013, when it finally was released. Under the executive order on regulatory review, OMB is supposed to complete its review within 120 days.
OSHA’s rule to require employers to identify which recorded injuries and illnesses are musculoskeletal disorders (MSDs) by checking a box on the OSHA 300 log also was delayed and sidetracked. This is a provision that was included in the 2000 OSHA recordkeeping rule repealed by the Bush administration. The purpose of this rule is to enhance information about the extent and nature of musculoskeletal disorders (MSDs). It is similar to a requirement that existed for 30 years prior to the repeal action by the Bush administration. This MSD injury reporting rule was scheduled for final promulgation in February 2011, but was delayed by the Obama administration due to objections from the business community to seek further input from small businesses, which was done during the summer of 2011. In December 2011, business groups and Republicans succeeded in winning a rider in OSHA’s FY 2012 funding bill that prohibited OSHA from acting on this rule. That prohibition expired in January 2014, but to date there has been no further action on this rule.
The development of OSHA rules on injury and illness prevention programs, combustible dust and other hazards also were delayed. A small business review panel on the draft injury and illness prevention program rule, initiated in January 2012, soon was suspended and remains on hold.
In the summer of 2013, the de facto freeze on safety and health regulations began to thaw.
First, as noted above, in August 2013, OMB released the proposed silica rule, which was published by OSHA on Sept. 12, 2013.This proposed rule is expected to protect more than 2.2 million workers from deadly silica dust. It would lower the permissible exposure limit to 50 ug/m3 from the current levels of 100 ug/m3 in general industry and 250 ug/m3 in construction, and require exposure monitoring, medical exams and training of workers. OSHA estimates the new rule would prevent nearly 700 deaths and 1,600 cases of silica-related disease every year.
Unions and public health groups strongly support the proposed silica rule. But business groups have lined up in solid opposition, even though the rule is less stringent than requirements in a number of other countries. OSHA held three weeks of public hearings on the proposed rule in March 2014, and now is accepting post-hearing comments. Final action on the rule is not expected until sometime in 2016. In the interim, it is likely opponents of the rule will seek congressional action to delay the final rule, most likely through an amendment to OSHA’s FY 2016 funding bill that would prohibit OSHA from finalizing the rule.
In addition to the proposed silica rule, OSHA also has moved forward on a number of other regulatory actions. In November 2013, a proposed rule to improve tracking of workplace injuries and illnesses was issued that would require employers to report establishment-specific injury and illness information to OSHA. This rule builds on the OSHA Data Initiative, which since 1995 has required approximately 80,000 employers in high-hazard industries to submit establishment- specific injury information annually to OSHA, which has been used for inspection targeting. The new rule would expand the reporting of summary data on injuries and illnesses to 440,000 establishments, and for establishments of more 250 employees, also require quarterly reporting of detailed case-specific data on all injuries and illnesses. To address issues of injury underreporting, the unions have urged OSHA to include provisions in the final rule that would prohibit employer policies and practices that discourage injury reporting or retaliate against workers for reporting injuries. Final action on this rule is expected in 2015.
In December 2013, OSHA issued a request for information on process safety management and prevention of major chemical accidents. This action was taken in response to the West, Texas, fertilizer plant explosion in April 2013, when an ammonium nitrate explosion killed 15 people, the majority of them volunteer emergency responders. The explosion revealed major gaps in the regulation and oversight of facilities that manufacture, use or store hazardous chemicals. The West, Texas, fertilizer plant was not subject to the OSHA Process Safety Management (PSM) standard, and had not been inspected by OSHA since 1985. Ammonium nitrate is not subject to EPA’s Risk Management Plan rules, and the local authorities had no information about the chemicals being stored at the facility. Following the West, Texas, tragedy, in August 2013, President Obama issued Executive Order 13650, directing OSHA, the Environmental Protection Agency and the Department of Homeland Security to develop recommendations for improving chemical facility safety and security, including possible new regulations to fill gaps in protection.
On April 14, 2014, OSHA promulgated a final safety rule on electric power generation, transmission and distribution that had been in the works for years.
In December 2014, OSHA issued another rule on injury recordkeeping and reporting. This final rule updated the list of industries that are subject to OSHA’s injury recordkeeping requirements and those that are exempt based upon the injury rates in the industries. The rule also expanded the requirement to report injuries and fatalities directly to OSHA. Specifically, the new rule requires employers to report all work-related fatalities to OSHA within eight hours, and injuries resulting in in-patient hospitalization as well as amputations and loss of an eye within 24 hours of the event. This rule went into effect in the federal OSHA states in January 2015. State OSHA plans are required to adopt the rule by January 2016.
Even with this progress, many rules still await action, including long-overdue final rules on confined space entry in construction and walking and working surfaces, and proposed rules on beryllium, infectious diseases, combustible dust and back-over protection.
With less than two years left in the Obama administration, it is not clear how much progress can be made. OSHA appropriately is focused on completing final rules on silica, confined space entry in construction, injury tracking, and walking and working surfaces. The agency is looking to finalize all of these rules by early 2016, so if there are any attempts by Congress to overturn them or delay their effective dates, the president can veto such action.
KEY ISSUES IN SAFETY AND HEALTH: STATUS AND PROGRESS
There are a large number of safety and health hazards and issues in need of attention. But there are several issues that pose broad and growing threats to workers that warrant special focus and action.
Infectious Diseases
The 2014–2015 Ebola epidemic in West Africa has been a grim reminder that infectious diseases pose a significant threat to the public and workers, and these outbreaks quickly can become global threats. The current Ebola outbreak, believed to have begun with the infection of a small boy in Guinea in December 2013, is the largest recorded. According to the World Health Organization, as of April 12, 2015, there had been 25,826 cases of Ebola disease reported, resulting in 10,704 deaths. The vast majority of these cases have been in Guinea, Liberia and Sierra Leone.39
Health care workers caring for Ebola victims have been particularly hard hit. As of mid-April 2015, 864 health care workers in the African countries most affected had contracted the disease. The mortality among these workers has been high. Fifty-eight percent of health care workers infected with the virus (503 individuals) have died.
Health care workers in other countries also have been affected. Here in the United States, two health care workers at Texas Presbyterian Hospital in Dallas—Nina Pham and Amber Vinson— were infected in September 2014 after caring for an Ebola-infected patient from Liberia who came to the hospital for emergency treatment. Those health care workers were treated at specialized Ebola treatment centers and survived. The Ebola infected patient—Thomas Eric Duncan—died.
The investigation of the outbreak at Texas Presbyterian revealed the hospital was totally unprepared to care for patients infected with Ebola or other serious infectious disease. There were no protocols in place; health care workers were not provided adequate protective equipment; and workers had not been trained. Following the outbreak in Texas, it became clear t the vast majority of health care facilities were unprepared to receive and care for patients with serious infectious diseases.
Subsequent to the Texas outbreak, the Centers for Disease Control and Prevention (CDC) strengthened its recommended infection control measures for caring for Ebola patients and issued guidance on protecting other workers who could be exposed to the Ebola virus in the course of their work (e.g., emergency medical technicians, waste workers and airline workers). But CDC guidelines are only voluntary and have no legal force.
The lack of preparedness for responding to the Ebola virus was reminiscent of the experience during the 2009 H1N1 influenza pandemic. Despite years of planning, many health care facilities were not prepared for the pandemic flu outbreak. Many health care employers had not trained workers about potential risks and appropriate protective measures prior to the outbreak, and failed to do so after the pandemic emerged. In many facilities, there were inadequate supplies of respirators and other protective equipment, and the proper equipment was not provided. Infection control procedures failed to separate infected patients from those who were not, particularly during the earlier stages of the outbreak. In the wake of the pandemic, billions of federal dollars were spent to improve preparedness, particularly for health care facilities. Unfortunately, the experience with the Ebola outbreak indicates those efforts were not sufficient or lasting.
The experience with the H1N1 pandemic influenza virus underscored, and the recent Ebola outbreak has reinforced, the need for mandatory measures to protect health care workers and other workers at high risk from exposures to infectious diseases. OSHA has some standards to help protect workers from Ebola and other infectious diseases, including rules on bloodborne pathogens, personal protective equipment and respiratory protection. But there is no broad-based infectious disease standard to protect workers from airborne or contact transmissible diseases such as tuberculosis, influenza or MERS.40 Previous efforts by OSHA to strengthen protections for health care workers, including a standard on tuberculosis, never reached fruition.
Following the H1N1 pandemic, OSHA began work on an infectious disease standard. In 2010, OSHA issued a request for information to seek input from the public on the rule. In 2014, after several delays, the draft proposed rule was reviewed by a small business panel as required by the Small Business Regulatory Enforcement Fairness Act (SBREFA). OSHA is currently working on preparing the proposed rule and the required analysis for publication, which must be submitted for OMB review before being issued. The proposed infectious disease rule is not expected until sometime in 2016. Hopefully, this current effort to establish mandatory measures to protect health care workers and other workers from infectious diseases will not be further delayed, and a final rule will be put in place before the next serious infectious disease outbreak occurs.
Oil and Gas Extraction
The rapid growth in the oil and gas industry during the past decade has been accompanied by a sharp increase in fatal injuries for workers. According to BLS, between 2003 and 2013, 1,189 oil and gas workers were killed on the job. In 2012, the number of worker deaths in the industry reached an all-time high, with 142 oil and gas workers killed by job injuries. In 2013, the number of deaths decreased to 112, but fatalities in this industry still accounted for 72 percent of the total fatalities in the mining sector.41 BLS fatality rate data for the oil and gas industry is limited, but available data during the past five years reported fatality rates in oil and gas extraction five to seven times the national fatality rate. In a number of years the fatality rate in oil and gas exceeded the fatality rate in coal mining.42
North Dakota has been a particularly deadly and dangerous state for oil and gas workers. In 2012, the job fatality rate in North Dakota’s mining sector, which is almost exclusively comprised of oil and gas, reached an alarming high of 104.0 per 100,000 workers, more than six times the national fatality rate for the industry. That same year, North Dakota’s construction fatality rate was 97.4 per 100,000 workers, nearly 10 times the national construction fatality rate. Not surprisingly, other states with large amounts of oil and gas activity also have high job fatality rates.
A large number of oil and gas worker deaths have been among Latino and immigrant workers. Since 2009, 143 Latino workers have died performing oil and gas work. In 2012, 11 of the 12 Latino workers who died in North Dakota were immigrant workers.
In FY 2013 and FY 2014, OSHA conducted a total of 1,326 inspections and issued five Hazard Alert Letters in the oil and gas extraction industries. Between Oct. 1, 2013, and Dec. 31, 2014, OSHA investigated 44 fatalities related to oil and gas. Traumatic injuries are the most common cause of death in the oil and gas industry, the most common mode being struck by or against tools or equipment, causing 20 of the 44 deaths that were investigated by OSHA during this time frame.
Other modes of death in oil and gas involve caught in/between (6), fall (3), shock (3) and burn/scald (2). But deaths from acute chemical exposures often are undercounted. While some deaths are appropriately classified as inhalation deaths (4), others can be labeled as cardiac arrhythmia or respiratory failure, without further investigation as to whether the health event was induced by acute chemical exposure.
Death from inhalation of toxic chemical fumes near oil tanks is a growing problem.
In 2014, a peer-reviewed NIOSH publication reported on worker exposures to volatile organic chemicals (VOCs) during flowback and production testing operations at oil and gas sites. Notably, 15 of 17 personal breathing samples measuring benzene exposure for workers gauging flowback or production tanks exceeded the NIOSH recommended exposure limit of 0.1 ppm.
But as NIOSH notes, even though workers were exposed to higher than recommended levels of benzene—a known carcinogen—none of the personal breathing zone sampling results for benzene, toluene, ethyl benzene and xylenes exceeded OSHA’s permissible exposure limits (PEL), despite being dangerous levels. OSHA’s PEL for benzene in the oil and gas sector is 10 ppm, which is 10 times more lenient than OSHA’s benzene standard in other sectors (1 ppm). Even so, 1 ppm is well above NIOSH’s recommended exposure limit of 0.1 ppm for benzene. OSHA’s weak PELs limit their enforcement ability needed to adequately protect workers.
NIOSH reports and OSHA investigations have identified numerous worker deaths in oil and gas related to acute chemical hazards. Here are several examples:
- Trent Vigus, 30, was found in July 2010 in a fetal position on the tank catwalk, where he was working to gather readings from the top of the tanks. It was documented that he died from a sudden cardiac event, but toxicology results also revealed propane and butane in his blood.
- Dustin Bergsing, 21, was found in January 2012 slumped below the open hatch of a tank of Bakken Shale crude oil. His death was due to hydrocarbon poisoning from inhaling petroleum vapors. The company, Across Big Sky, appealed a claim for Bergsing’s daughter to receive death benefits, alleging that Bergsing intentionally inhaled fumes to get high. The company’s claim was unsuccessful, a ruling that was affirmed by the North Dakota Supreme Court in 2014.
- Ryan Provancher, 25, died from inhalation of toxic fumes on Oct. 9, 2013, in Manning, North Dakota. He worked for Driven Services LLC, a trucking company. OSHA issued three serious citations to the company, and assigned a penalty to the company totaling $8,400.
- David Simpson, 54, died from inhalation of toxic fumes on March 20, 2014, in Sulphur, Oklahoma. He worked for Premier Trading Transportation, a trucking company. No fines were issued for his death.
- Zachary Buckles, 20, died from inhalation of toxic fumes on April 28, 2014, in Alexander, North Dakota. He worked for Black Gold Testing, a well testing company. His cause of death was originally listed as cardiac arrhythmia, but it also was determined that petroleum vapor exposure played a role in his death. OSHA issued a citation for a serious health violation, proposing a $2,800 penalty, but after an informal settlement, the closing penalty was only $1,960. The onsite employer, Continental Resources Inc., stated it was not aware of any dangers from hydrocarbon vapors or VOCs at any of its locations.
- Robert Ohlmacher, 61, died from inhalation of toxic fumes on Feb. 5, 2014, in Watford City, North Dakota. He worked for Armstrong Water Solutions Inc., a company that provides steam, air and hot water systems. OSHA issued citations for two serious violations, totaling $9,800, but the closing penalty was only $4,900 after informal settlement.
- John McNulty, 57, died from cardiac/respiratory failure on the job on June 24, 2014, in Gill, Colorado. He was working for DJ Basin Transport LLC, a transportation company, and was found on a catwalk adjacent to a crude oil tank. OSHA proposed a penalty of $8,400, but the agency still is investigating.
Silica dust exposure has been identified as a major health hazard in hydraulic fracturing operations in the oil and gas industry, where silica is used in large quantities along with water and chemicals in the extraction process. In 2012, NIOSH released the findings of a two-year assessment of chemical hazards in hydraulic fracturing that reported high levels of silica dust exposures, particularly in sand handling and transfer operations. NIOSH reported 47% of the breathing zone samples taken exceeded the OSHA permissible exposure limit (100 ug/m3), 79% exceeded the NIOSH recommended exposure limit (50 ug/m3) and 31% of the samples were greater than 10 times the NIOSH recommended limit.
In response to these findings in June 2012, OSHA and NIOSH issued a hazard alert on silica hazards in hydraulic fracturing, outlining the risks of exposure and recommended measures to control worker exposures to respirable silica dust in these operations.44 OSHA’s proposed standard on respirable crystalline silica applies to hydraulic fracturing operations, and when finalized will help reduce exposures in this industry.
Other potential safety and health hazards in oil and gas operations that are less well-studied include exposure to diesel particulate and exhaust gases from equipment, high or low temperature extremes, noise, heavy metal exposure, and naturally occurring radioactive material.
As noted previously, the oil and gas extraction industry is classified as part of the mining industry (NAICS 21) and has fatality rates that are similar to those experienced in coal mining. But unlike the rest of the mining industry, which is subject to the Mine Safety and Health Act, oil and gas extraction is covered by the Occupational Safety and Health Act. As a result, oil and gas is subject to much weaker regulations and oversight than other dangerous extractive industries.
Under the Mine Act, all underground mines are subject to mandatory comprehensive inspection by MSHA four times a year, in addition to other inspections that may be conducted in response to complaints, fatalities or other information. All surface mines covered by MSHA, including quarrying operations, must be inspected at least twice a year. By comparison, there are no routine mandatory inspections under OSHA, and OSHA’s ability to inspect workplaces, including those in the oil and gas industry, is quite limited. In FY 2014, federal OSHA conducted only 663 inspections in the oil and gas extraction industries. Worksites in this industry often are remote and mobile, making oversight even more difficult.
Similarly, MSHA has detailed regulations that address the specific hazards in coal mining and metal and nonmetal mining regulations. Oil and gas extraction is subject to OSHA general industry and construction regulations, none of which is designed to address the particular safety and hazards in the oil and gas industry. Indeed, the oil and gas sector, at the urging of the industry, has been exempted from a number of OSHA regulations, including standards for benzene and process safety management. In 1983, OSHA issued a proposed standard to address the specific safety hazards in the oil and gas industry, but that rule was never issued.
Safety and health practices and protections in the oil and gas industry need to be strengthened and improved. Given the extreme hazards in the industry, and growing reliance on oil and gas as an energy source, it is time to consider a strict regulatory and enforcement system similar to what exists in the rest of the mining industry for the oil and gas sector as well.
Workplace Violence
Workplace violence is a major cause of death on the job. In 2013, 738 workers were killed due to violence by a person at work, with 404 of these workplace homicides. Among workplace homicides, women are seven times more likely to be killed by a relative or domestic partner than men. Suicides in the workplace have increased by 13% since 2012. Toxic work environments that include workplace bullying and increased work pressures most likely have contributed to this growing problem.
Fatalities alone do not paint a complete or accurate picture of the workplace violence problem. Violent, nonfatal attacks on workers are serious, underreported and often leave workers physically and emotionally scarred for life. It is not just a problem in the private sector. Survey results released in 2012 by the Merit Systems Protection Board reported that one in eight federal government employees witnessed workplace violence.45 The majority of these accounts came from the Veterans Administration, where 23% of employees said they had witnessed at least one act of violence at work over a two-year period.
In private industry, the Bureau of Labor Statistics reported more than 26,000 workplace violence incidents that led to injuries involving days away from work in 2013, an increase from 2012. In 2013, the health care and social assistance sector was responsible for 76% of the workplace violence events leading to injuries involving days away from work. Psychiatric and home health aides were among the leading occupations requiring days away from work due to a workplace violence event, and a patient was the responsible party in more than half of the cases. Personal care aides are now the third-highest occupation for lost-time injuries due to workplace violence. Home health is now playing a larger role in health care delivery. Women workers are at greatest risk of injuries from workplace violence, experiencing more than two-thirds of such reported injuries.
STEPHANIE ROSS
Stephanie Ross, 25, had only been on the job for three months when she was stabbed to death in 2012. Stephanie was a caseworker for Integra Health Management Inc., and was tasked with ensuring about 35 different clients were taking their medication. These check-ins usually were performed by phone, but also required in-person visits. On the day of her death, one of her clients chased her into the street with a butcher knife and repeatedly stabbed her in the head and neck.
Stephanie had visited this client three times, but told her employer she did not feel comfortable visiting this particular client’s house alone, and wrote in the case file that two workers should be sent to his home. It is also unclear whether Ross received adequate training to perform her job. Integra uses its “feet on the street” case management as a method to keep patients out of costly emergency rooms. The client was known for having a history of violent behavior, and has a history of mental illness and a conviction for aggravated battery with a deadly weapon.
OSHA determined that employees at Integra “were exposed to the hazard of being physically assaulted by members with a history of violent behavior.” Actions the employer should have taken include methods to: create a written workplace violence prevention program, determine behavioral history of new and transferred clients, develop procedures to communicate to staff any incident of workplace violence among clients, ensure sufficient training, implement and maintain a buddy system based on a hazard assessment, provide staff with rapid assistance when needed, and establish a liaison with law enforcement representatives.
OSHA issued a recordkeeping citation to Integra for not reporting Stephanie’s death, and a citation for violating OSHA’s general duty clause that requires employers to keep the workplace free from recognized hazards. In total, OSHA issued $10,500 in penalties to Integra Health Management Inc., which the company is contesting. If Stephanie was a public-sector worker in Florida, OSHA would not have had the authority to investigate her death and the employer would not have been held accountable.
There is no federal standard for workplace violence, even though it is the second leading cause of job-related death in the United States. In December 2013, Reps. George Miller and Joe Courtney requested the Government Accountability Office examine existing workplace violence prevention programs and policies, and the need for these programs and policies, including the need for an OSHA workplace violence prevention standard for health care and social service workers. GAO’s investigation is under way.
In the last several years, OSHA has taken a number of nonregulatory actions to address the growing problem of workplace violence. In April 2015, OSHA released updated guidelines, “Preventing Workplace Violence for Health Care and Social Service Workers,”46 a comprehensive document outlining the contents of violence prevention programs using hazard assessments and the hierarchy of controls. Over the last several years, OSHA issued several guidance documents for other high-risk populations—“Recommendations for Workplace Violence Prevention Programs in Late-Night Retail Establishments,” and a fact sheet on “Preventing Violence against Taxi and For-Hire Drivers.”
In 2011, the agency issued a directive on “Enforcement Procedures for Investigating or Inspecting Incidents of Workplace Violence,” which establishes uniform procedures for OSHA field staff when responding to incidents and complaints of workplace violence. The directive also applies when conducting inspections in industries considered vulnerable to workplace violence, such as health care and social service settings, and late-night retail establishments. Since this directive was issued, OSHA has taken 26 enforcement actions resulting in citations under the general duty clause (section 5(a)(1)) for workplace violence hazards.
In FY 2013, OSHA conducted five workplace violence-related inspections, all of which were fatality or catastrophe investigations; two of these were assigned penalties that resulted in a current median penalty of $6,450.47 In FY 2014, OSHA strengthened workplace violence hazard enforcement through the general duty clause (section 5(a)(1)), conducting 90 workplace violence inspections—four of these were fatality or catastrophe investigations and 35 of the inspections were assigned penalties that resulted in a current median penalty of $6,724. In FY 2013 and 2014, OSHA issued Hazard Alert Letters in seven investigations to warn employers about the dangers of workplace violence and identified corrective actions.
State standards, policies and programs on workplace violence vary widely. New York has the most comprehensive workplace violence standard, but it only covers the public sector. Public employers are required to develop and implement programs to prevent and minimize workplace violence.
Connecticut, Illinois, Maryland, New Jersey and Washington have adopted some form of legislation specifically focused on health care settings. California, using an advisory committee, is developing a consensus rulemaking proposal addressing workplace violence protection standards for consideration by the public and the Cal/OSHA Standards Board. This process also aims to update its “Guidelines for Workplace Security,” “Guidelines for Security & Safety of Health Care and Community Service Workers” and “Model Injury & Illness Prevention Program for Workplace Security” sample programs. Through the Workplace Violence Safety Act, employers may issue temporary restraining orders against individuals who have engaged in unlawful violence or who have made a credible threat of violence at the workplace. Since 1991, California has required employers to establish a comprehensive safety and health program, including identification and evaluation of hazards and procedures, and training to address the hazards identified; this has been used to enforce workplace violence hazards. California also separately requires a security and safety assessment and protection plan in hospitals.
On Oct. 1, 2014, Maryland began implementation of new legislation that addresses all workplace injuries in health care facilities by means of an overall safety program, with the target that workplace violence hazards would be addressed under this measure. The measure requires public and private health employers to establish a safety committee consisting of management and employees; and the committee to establish a safety program that consists of: 1) a written policy, 2) an annual comprehensive risk assessment and recommendations for injury prevention, 3) a process for reporting, responding to and tracking incidences of workplace injuries, and 4) regular safety and health training.
State and local ordinances are an important piece in addressing workplace policies and practice related to workplace violence, but a stronger, more comprehensive solution is needed to address this growing, national problem.
Chemical Exposure Limits and Standards
Occupational exposures to toxic substances pose a significant risk to millions of American workers. According to NIOSH, occupational diseases caused by exposure to these substances are responsible for an estimated 50,000 deaths each year. One of OSHA’s primary responsibilities is to set standards to protect workers from toxic substances. But since the OSH Act was enacted in 1970, OSHA has issued comprehensive health standards for only 29 substances. Most of these standards were set in the first two decades of the act. In recent years, regulations for chemical hazards have ground to a halt. The last toxic substance standard that was issued, on hexavalent chromium in 2006, came only as a result of a court order.
The OSHA permissible exposure limits (PELs) in place under 29 CFR 1910.1000 that govern exposure for approximately 400 toxic substances were adopted in 1971 and codified the ACGIH Threshold Limit Values from 1968. Most of these limits were set by ACGIH in the 1940s and 1950s, based upon the scientific evidence then available. Many chemicals now recognized as hazardous were not covered by the 1968 limits. In 1989 OSHA attempted to update these limits, but the revised rule was overturned by the courts because the agency failed to make the risk and feasibility determinations for each chemical as required by the act. The result is that many serious chemical hazards are not regulated at all by federal OSHA or are subject to weak and out-of-date requirements.
Some states, including California and Washington, have done a better job updating exposure limits, and as a result workers in those states have much better protection against exposure to toxic substances.
Several years ago, the American Industrial Hygiene Association (AIHA), major industry groups and labor attempted to reach agreement on a new approach to update permissible exposure limits through a shorter process that would allow quick adoption of new limits that were agreed upon by consensus. Unfortunately, those efforts stalled when small business groups objected to an expedited process that would apply to a large number of chemicals, and the Bush administration refused to take a leadership role in developing and advancing an improved process for setting updated exposure limits.
In 2007, the state of California moved to establish a new procedure for updating chemical exposure limits that utilizes a two-part advisory committee process to recommend revised or new permissible exposure limits.48 Under the process, Cal/OSHA develops a list of candidate substances for proposed consideration by an advisory committee. A Health Expert Advisory Committee (HEAC) reviews scientific evidence on identified substances and recommends a permissible exposure limit based upon health effects. A separate Feasibility Advisory Committee (FAC) then considers technical and economic feasibility issues to determine whether the health- based recommended PEL should be modified. Cal/OSHA maintains the responsibility to recommend draft PELs to the Cal/OSHA Standards Board that has the authority to adopt final limits.
This process was intended to expedite the adoption of revised PELs, but the process has been slower than expected. As of July 2012, the HEAC had recommended or discussed revised PELs for 13 substances, and the FAC had accepted or discussed an alternative for nine of these recommendations. 49 This process has become dormant. The last meeting of the health advisory committee was held in May 2012.
Based on the work of the advisory committee, since 2012, the California Occupational Safety and Health Standards Board adopted new exposure limits on eight substances: naphthalene, hydrogen chloride, ethylbenzene, n-methylpyrrolidone, carbon disulfide, hydrogen fluoride, sulfuric acid and toluene. In an earlier process covering 2001 to 2004, Cal/OSHA issued 48 new or revised exposure limits, although this process, too, was very slow. As a result of these efforts, Cal/OSHA’s exposure limits for many chemical substances are much more protective than federal OSHA’s.
The American Industrial Hygiene Association, unions and others have identified updating OSHA permissible exposure limits as a top priority for the Obama administration. For several years OSHA Assistant Secretary Dr. David Michaels has explored ways to update exposure limits and enhance worker protection from toxic chemicals. In 2010, OSHA held a meeting to seek input and ideas from experts, and in August 2010, the agency sought input from the public on strategies for reducing worker exposures to hazardous chemicals. One of the suggestions that came from this meeting was for the agency to develop an annotated comparison list of the legal and recommended exposure limits for chemical substances as a tool to assist in the assessment and control of exposures. OSHA acted on this recommendation, and in October 2013 made available on its website tables comparing OSHA PELs for general industry, the California Division of Occupational Safety and Health PELs, National Institute for Occupational Safety and Health-recommended exposure limits and American Conference of Governmental Industrial Hygienist threshold limit values. 50 At the same time, the agency unveiled a Web-based toolkit to assist employers and workers to identify safer chemicals that can be used in place of more hazardous ones.
In 2012, OSHA added chemical exposure limits to its regulatory agenda, announcing it was planning a review of existing limits with plans to issue a formal request for information. In April 2014, the draft request for information (RFI) on chemical exposure limits went to OMB for review. The RFI was published in October 2014 requesting comments on approaches to improving the management of chemical exposures and updating permissible exposure limits (PELs). OSHA now has extended the comment period on this notice until October 2015.
Ergonomics
Ergonomic injuries still are the biggest job safety hazard faced by workers. In 2013, musculoskeletal disorders accounted for 33.5% of all serious workplace injuries.
During the Bush administration, efforts to address ergonomic hazards suffered huge setbacks. In March 2001, the OSHA ergonomics standard was repealed under the Congressional Review Act. Soon after, the administration also repealed the OSHA recordkeeping requirement to identify all musculoskeletal disorders on the workplace injury and illness log. The Bush administration’s “comprehensive plan” to address ergonomic hazards announced in 2002 turned out to be a sham. The administration issued just four ergonomics guidelines—for the nursing home industry, retail grocery stores, poultry processing and the shipbuilding industry. During the Bush administration, federal OSHA issued a total of 20 general duty clause citations for ergonomic hazards, with only one ergonomic citation issued in 2005, no ergonomic citations issued in 2006 or 2007 and only three citations in 2008. The average penalty for these citations was $1,874.
The Obama administration has not developed specific initiatives to address ergonomic hazards. With the repeal of the ergonomics standard under the Congressional Review Act (CRA), OSHA is prohibited from issuing a new rule that is substantially the same as the original rule unless the new rule is authorized by Congress. In the current political environment, the chance of such action is remote, and the development of even a different type of ergonomics regulation (e.g., a rule limited to high-risk industries) would be politically difficult. Enforcement against ergonomic hazards under OSHA’s general duty clause remains limited. According to OSHA, under the Obama administration there have been only 17 federal OSHA enforcement cases with general duty clause citations for ergonomic hazards. There have been no efforts by the administration to develop a new comprehensive ergonomic enforcement strategy, although in recent years there has been an increase in OSHA ergonomic enforcement activity.
In April 2012 OSHA launched a national emphasis program for nursing and residential care facilities, which in part focuses on ergonomic hazards. To date, this initiative has resulted in seven citations for ergonomic hazards. In 2014 OSHA increased its ergonomics enforcement activity with five employers cited for general duty violations for ergonomic hazards. The most significant enforcement action was for violations at a Wayne Farms poultry plant in Alabama, where OSHA identified widespread exposure to musculoskeletal hazards, and numerous cases where employee ergonomic injuries were not recorded on the OSHA log. In October 2014, OSHA cited the employer for these and other serious and repeat violations and proposed $102,000 in penalties for these violations. OSHA also has expanded the use of Hazard Alert Letters to address ergonomic hazards. These letters are issued in cases where OSHA has identified serious ergonomic hazards, but is not able to meet the legal burden for issuing a general duty citation. In FY 2014, OSHA issued 81 Hazard Alert Letters for ergonomic hazards, up from 30 letters issued in FY 2013. In both years, the majority of the letters involved nursing home employers.
At the state level, efforts to adopt ergonomic protections also have been met with great industry opposition. In 2003, industry groups led a successful ballot initiative to overturn the Washington State ergonomics rule. Efforts to enact ergonomics legislation stalled in Connecticut and Minnesota. In March 2011, after nearly a decade of effort to develop and issue an ergonomics rule, the Republican governor of Michigan signed a bill into law that prohibits the Michigan Occupational Safety and Health Administration (MIOSHA) from issuing an ergonomics standard.
One area in which there has been significant progress on ergonomics is the adoption of safe patient handling legislation. Eleven states now have safe patient handing requirements: California, Hawaii, Illinois, Maryland, Minnesota, New Jersey, New York, Ohio, Rhode Island, Texas and Washington. A number of additional states are considering similar legislation.
MINE SAFETY AND HEALTH
The April 5, 2010, explosion at the Massey Energy Upper Big Branch (UBB) mine in West Virginia killed 29 miners in the worst coal mine disaster in the United States in 40 years. The UBB disaster shocked and outraged the nation. It exposed serious problems at the Massey mine and deficiencies in mine safety laws and oversight.
Since the Upper Big Branch explosion, much of MSHA’s activity has been focused on the UBB investigation and on identifying and correcting the deficiencies in MSHA’s regulations, policies and programs that may have allowed the deadly conditions at the mine to continue.
MSHA’s investigation of the UBB disaster found the 29 miners who perished at UBB died in a massive coal dust explosion that started as a methane ignition.
According to MSHA’s investigation report:
“The physical conditions that led to the explosion were the result of a series of basic safety violations at UBB and were entirely preventable. PCC/Massey disregarded the resulting hazards. While violations of particular safety standards led to the conditions that caused the explosion, the unlawful policies and practices implemented by PCC/Massey were the root cause of this tragedy. The evidence accumulated during the investigation demonstrates that PCC/Massey promoted and enforced a workplace culture that valued production over safety, including practices calculated to allow it to conduct mining operations in violation of the law.
“The investigation also revealed multiple examples of systematic, intentional, and aggressive efforts by PCC/Massey to avoid compliance with safety and health standards, and to thwart detection of that non-compliance by federal and state regulators.”51
Following the investigation, MSHA imposed a fine of $10.8 million for civil violations, the largest in the agency’s history, for more than 369 citations and orders, including 21 flagrant violations.
The Department of Justice (DOJ) launched a criminal investigation of the UBB explosion, both of the company and company officials. In December 2011, DOJ announced a settlement in the criminal case against the company, with Alpha Natural Resources (which had purchased Massey Energy) agreeing to pay a total of $209 million for penalties, payments to families and investments to improve mine safety.
The criminal investigation has been conducted by the U.S. attorney for the Southern District of West Virginia. To date, three Massey management officials have either pleaded guilty or been convicted of criminal offenses related to the explosion and related violations. In November 2014, the criminal investigation reached the top management of the company. Don Blankenship, CEO of Massey Energy at the time of the UBB explosion was indicted by a federal grand jury on charges including conspiracy to violate mandatory federal mine safety and health standards, conspiracy to impede federal mine safety officials, making false statements to the Securities and Exchange Commission, and securities fraud. The criminal trial is presently scheduled to begin in July 2015.
The Massey mine disaster raised serious questions about the adequacy of MSHA oversight and mine safety law and regulations, particularly how a mine with such a significant history of violations could continue to operate.
An internal review of MSHA’s activities prior to the UBB explosion in April 2010 found that inspectors failed to identify deficiencies in Massey’s dust control program and ventilation and roof control plans, despite repeated inspections of the mine. Lack of inspector training, inexperience and management turnover were identified as factors that led to these failures.
Since the UBB explosion, MSHA has been moving on a number of fronts to address shortcomings, and strengthen regulations and enforcement.
In April 2010, immediately after the UBB tragedy, MSHA launched a new program of “impact” inspections to target mines with poor safety records or at high risk of explosions. As of March 1, 2015, 896 impact inspections of mines had been conducted, resulting in a total of 13,951 citations, 1,244 orders and 56 safeguards, many of them for serious or life-threatening conditions.
MSHA also has strengthened its procedures for addressing patterns of violations (POV). Under the Federal Mine Safety and Health Act, MSHA is authorized to issue a POV notice to mine operators that demonstrate a disregard for the health and safety of miners through a pattern of significant and substantial (S&S) violations. If a mine receives a POV notice, all subsequent S&S violations identified at that mine must be issued as withdrawal orders, and immediate action must be taken to correct the violations. Prior to 2010, MSHA never had used this authority and no mine had been placed on a pattern of violations status.
In December 2010, new POV screening criteria were put in place to identify mines that had a history of repeated violations. Using those criteria, MSHA identified 51 mines for further review. The top 12 mines identified in the 2010 screening were cited collectively for a combined total of 5,541 violations, 2,050 of which were S&S violations.52
In January 2013, OSHA issued a new regulation to further strengthen enforcement for patterns of violations. The regulation allows MSHA to issue a pattern of violation notice without first having to issue a “potential” notice. It also provides for violations that are not yet final orders to be considered in determining a pattern, so that coal operators cannot use litigation and contests to avoid these stricter enforcement procedures. If a mine receives a POV notice, all subsequent S&S violations identified at that mine must be issued as withdrawal orders, and immediate action taken to correct the violations.
The POV enforcement program has had an impact, resulting in mine operators taking action to correct serious hazards that constitute violations. In 2014, 12 mines were identified for further review. These mines were cited for a total of 1,952 violations, 857 of which were S&S violations.
In addition to strengthening enforcement programs, MSHA has moved forward to develop and promulgate new mine safety and health standards. In September 2010 the agency issued an emergency temporary standard on rock dusting to reduce the risk of coal dust explosions, and finalized the rule in June 2011. MSHA also finalized a new rule requiring operators to conduct pre-shift examinations of mines to identify hazards and correct them, and a rule to adjust penalties for inflation.
In February 2015 MSHA issued a Request for Information (RFI) seeking input on other regulatory improvements that should be made based upon the findings from the investigation of the Upper Big Branch mining disaster. The RFI requests input on a broad range of issues including information on mine ventilation and roof control plans; atmospheric monitoring systems and new technology for remote monitoring systems; methods to suppress the propagation of coal dust explosions; and criteria and procedures for certification, recertification and decertification of persons qualified to conduct mine examinations.
MSHA has taken action on other key mine safety and health issues. In April 2014, a final rule to reduce miners’ exposure to coal dust was issued to reduce the risk of black lung, which after years of decline has been on the rise. The new rule, which went into effect in August 2014, lowers exposure levels to 1.5 mg/m from the current 2.0 mg/m level, and puts in place other dust control, exposure monitoring and medical surveillance measures.
In January 2015, MSHA issued a final rule to require proximity detection systems on continuous mining machines in underground coal mines to prevent injuries and deaths from contact with this equipment. The rule had been proposed in August 2011, but final action was delayed by a lengthy review by OMB.
A companion rule on proximity detection systems for mobile mining equipment also has been delayed. A draft proposed rule was sent to OMB for review in September 2011. After being held by OMB for more than two years, in January 2014 the proposed rule was withdrawn from review. A new draft proposal was submitted to OMB for review on March 28, 2015. Hopefully this rulemaking will proceed without further delay.
Two other important rules previously designated as priorities by MSHA also have been delayed. A new standard on silica has yet to be proposed, and a rule on safety and health management systems has been removed from the regulatory agenda.
MSHA also has untaken a major initiative—Miners’ Voice—to encourage miners to exercise their rights under the Mine Act and to support them in these efforts. The agency has conducted an extensive outreach campaign to inform workers of their rights. A survey to evaluate the ability of miners to access information on workplace rights, their understanding of those rights and ability to exercise those rights without fear of retaliation is being conducted. A new training curriculum is being developed to educate miners’ representatives on their rights and how they can participate effectively in MSHA investigations and other activities under the act.
As part of this initiative, MSHA has stepped up enforcement of its anti-retaliation protections. The Mine Safety and Health Act protects miners from being discriminated against for exercising their rights under the act. The mine safety law protections are much stronger than the comparable provisions under the OSH Act, providing for preliminary reinstatement while the case is being adjudicated, an administrative process for resolving complaints, and the right of miners to take up the case if the secretary of labor fails or declines to act.
In 2014, MSHA filed 49 discrimination complaints on behalf of miners (compared with nine such cases filed in 2008), and sought preliminary reinstatement for 45 miners, compared with three such cases in 2008.
JOB SAFETY BUDGET
Funding for the nation’s job safety and health programs historically has been limited, particularly when compared with the scope of responsibilities of the job safety agencies and the extent of the problems that need to be addressed. During the Bush administration there was a decrease in funding and staffing for the agencies, further limiting their capacity. The Obama administration has made funding for the job safety agencies, particularly the enforcement programs, a priority, moving in the early years of the administration to restore the agencies to their FY 2001 levels of operation.
During the first year of the Obama administration, OSHA and MSHA received significant increases in their budgets. For FY 2010, the omnibus appropriations bill, enacted by the Democratic-controlled Congress, provided $559 million in funding for OSHA, $357 million for MSHA and $302 million for NIOSH. This compared with FY 2009 levels of $513 million for OSHA, $347 million for MSHA and $290 million for NIOSH. In subsequent years there were additional increases sought and received for OSHA and MSHA.
But in FY 2013, as a result of Republican opposition in Congress and following the government shutdown and sequester, OSHA’s budget was reduced to $535 million from $564.8 million in FY 2012. In FY 2014, OSHA funding was partially restored to a level of $552.2 million. In FY 2015, OSHA received a very small increase, with a budget of $552.8 million and 2,224 positions funded.
In FY 2013, MSHA’s budget also was cut as a result of the budget sequester with $354 million in funding provided. However, in FY 2014 MSHA’s funding was increased to $375.9 million, higher than the pre-sequester level. The FY 2015 appropriation maintained this level of funding for MSHA.
For FY 2016, the Obama administration has proposed significant increases in the OSHA and MSHA budgets. For OSHA, the administration has requested $592 million in funding, seeking increases in enforcement, standards development and whistleblower protection. For MSHA, the FY 2016 budget requests $394.9 million in funding seeking major increases in coal enforcement and more modest increases in other MSHA programs, including standards development and education.
Unfortunately, NIOSH has not received the same ongoing support as OSHA and MSHA for funding under the Obama administration. While increased funding for NIOSH was sought and received in FY 2010, with the agency receiving $302 million in funding, in subsequent budget requests, the administration has proposed to cut NIOSH’s funding.
Specifically, beginning with the FY 2012 budget request, and every year thereafter, the Obama administration proposed $48 million in cuts for NIOSH through the elimination of programs for agriculture, fishing, and logging safety and health research, and the Educational Research Center program to train occupational safety and health professionals. As a result of strong opposition to these cuts by the entire safety and health community and labor and business groups, Congress rejected these proposals and has maintained NIOSH’s funding. In FY 2015 NIOSH was funded at a level of $334.9 million; however this increase in funding was due to transfer of administrative budget items to NIOSH from the Center for Disease Control and Prevention, and there was no net increase in funding for NIOSH programs.
For FY 2016, the Obama administration once again proposed to eliminate NIOSH education and research programs, and to cut the NIOSH budget to $283.4 million.
Congress is still in the process of working on the FY 2016 appropriations for government agencies. At this point hearings have been held, but no formal action has been taken on any appropriations bills. However, given the cuts in funding contained in the nonbinding House and Senate budget resolution passed by the Republican majorities in March, attempts to cut the agencies’ funding in the appropriations process is very likely.
SAFETY AND HEALTH LEGISLATION
With the Republicans now in control of the House and Senate, the political environment in the 114th Congress for worker protections and public protections is very challenging. Winning any new legislative improvements in worker safety and health laws will be difficult. Instead, the focus will be on defending current laws and protections from attack.
The primary legislative threat to worker safety and health and other public protections is from a wide range of “regulatory reform” bills that are being pushed in the House and the Senate. These bills would make it more difficult, if not impossible, for agencies to issue needed safeguards. The Regulations from the Executive in Need of Scrutiny Act would set up Congress as the gatekeeper on regulations. Politics, not scientific judgment or expertise of agencies, would dictate all regulatory actions. The Regulatory Accountability Act would upend 40 years of law to make costs to business, not the protection of workers and the public, the primary consideration. The Small Business Regulatory Flexibility Improvements Act would add a host of new analytical requirements to the regulatory process, further delaying needed safeguards.
The House of Representatives already has passed a number of these bills. The Senate is moving more slowly, but has begun a series of hearings on regulatory burdens and problems with the regulatory system. At this point the plan and schedule for legislative action on these bills in the Senate is uncertain. The Obama administration has issued statements of administration policy opposing these bills, and has indicated the president is likely to veto them if they are passed by Congress.
In addition to broad “regulatory reform” legislation, there are certain to be attempts by Republicans to block individual regulations through amendments to appropriations bills or to block final rules through resolutions of disapproval under the Congressional Review Act (CRA). The CRA was used in 2001 during the Bush administration to overturn OSHA’s ergonomics standard, to date the only successful effort to overturn a regulation under this law.
In the 114th Congress, the Republicans voted in March 2015 to overturn new NLRB union election rules, but this action was vetoed by the president. Future actions by Congress to overturn other rules under the CRA are likely to meet the same fate as long as President Obama is in office. Actions to block rules through the appropriations process will be more difficult to address since these will be part of large spending measures to fund the government in FY 2016, making them more difficult to veto.
In the last several sessions of Congress, legislation to strengthen the Occupational Safety and Health Act and Mine Safety and Health Act has been introduced. The Protecting America’s Workers Act would expand OSHA coverage, strengthen enforcement and enhance whistleblower protections. The Robert C. Byrd Mine and Workplace Safety and Health Act proposed to revamp the provisions for patterns of violations, enhance criminal and civil penalties, provide MSHA subpoena power and other enforcement tools and strengthen miners’ whistleblower protections. Several of the chief sponsors of these bills now have retired, including Sens. Tom Harkin and Jay Rockefeller and Reps. George Miller and Lynn Woolsey. It is expected that the new Democratic leaders on the Senate Committee on Health, Education, Labor and Pensions and House Committee on Education and the Workforce will introduce these measures shortly in the 114th Congress, but with Republicans in control of Congress, legislative action is highly unlikely.
One piece of safety- and health-related legislation must be acted on in the 114th Congress is the James Zadroga 9/11 Health and Compensation Reauthorization Act (H.R. 1786, S. 928). This bill would extend the law enacted in the 111th Congress—the James Zadroga 9/11 Health and Compensation Act—that established a comprehensive health monitoring, treatment and compensation program for the 9/11 responders and others who became sick as a result of exposures at the World Trade Center following the September 11, 2001, terrorist attacks. Tens of thousands of responders and area residents are now ill as a result of their exposures and hundreds have died. The 2010 law was only authorized for five years. Unless Congress acts the law will expire and the health and compensation programs cease operation by October 2016, leaving sick responders and other survivors without access to critical lifesaving programs.
WHAT NEEDS TO BE DONE
Very simply, workers need more job safety and health protection. Eight years of inaction and neglect by the Bush administration on major hazards and increased emphasis on employer assistance and voluntary compliance left workers’ safety and health in serious danger. The Obama administration has restored OSHA and MSHA to their missions to protect workers, and the leaders at the agencies have charted a new course and moved forward.
But much work needs to be done, and less than two years remain for the current administration to act. The White House needs to actively support needed safety and health rules and prevent OMB from blocking or stalling these measures. OSHA needs to move to finalize the silica dust standard and to develop and issue proposed rules combustible dust, infectious diseases, beryllium and chemical process safety. Enforcement must be ramped up, particularly for employers who repeatedly violate the law. Funding and staffing at the agencies should be increased to provide for enhanced oversight of worksites and timely and effective enforcement.
Efforts to strengthen OSHA’s Whistleblower Protection Program must continue. The widespread problem of injury underreporting must be addressed, and employer policies and practices that discourage the reporting of injuries through discipline or other means must be prohibited. OSHA needs to keep up with new hazards that face workers as workplace, the nature of work, and employment relationships change.
The serious safety and health problems and increased risk of fatalities and injuries faced by Latino and immigrant workers must be given increased attention.
Similarly, the high number of fatalities and injuries in the oil and gas extraction industry demand intensive and comprehensive intervention. Without action, the workplace fatality crisis in this industry only will get worse as production intensifies and expands.
At MSHA, initiatives to focus increased attention on mines with a record of repeated violations and stronger enforcement action against mines with patterns of violations must continue. The new coal dust rule must be enforced, and the promised rules on silica and proximity detection for mobile equipment issued.
Congress must strengthen the job safety laws to prevent tragedies like the Massey mining disaster. Improvements in the Mine Safety and Health Act are needed to give MSHA more authority to shut down dangerous mines and to enhance enforcement against repeat violators.
The Occupational Safety and Health Act now is more than 40 years old and out of date. Congress should pass the Protecting America’s Workers Act to extend the law’s coverage to workers currently excluded, strengthen civil and criminal penalties for violations and strengthen the rights of workers, unions and victims. Improvements to update and strengthen the OSH Act’s anti- retaliation provisions are particularly needed so workers can report job hazards and injuries and exercise safety and health rights without fear.
Rather than move forward, the Republican majority in Congress is threatening to turn back the clock and block new safety and health protections. These efforts to roll back and weaken worker protections must be stopped.
The nation must renew the commitment to protect workers from injury, disease and death and make this a high priority. We must demand that employers meet their responsibilities to protect workers and hold them accountable if they put workers in danger. Only then can the promise of safe jobs for all of America’s workers be fulfilled.
39World Health Organization, Ebola Situation Report, 15 April 2015, http://apps.who.int/gho/data/view.ebola-sitrep.ebola-summary-20150415?lang=en.
40In May 2009, the California Occupational Safety and Health Standards Board adopted a Cal/OSHA standard on airborne transmissible diseases. The standard covers all airborne transmissible infectious diseases. It requires covered health care employers to develop infection control plans, to utilize engineering controls and appropriate personal protective equipment, to provide training for workers, and to develop and implement isolation plans for identified or suspected cases.
41The oil and gas industry is classified as an extractive industry and is part of the mining sector (NAICS Code 21). For the purpose of identifying fatalities in the oil and gas extractive industries, BLS includes oil and gas extraction (NAICS 21111), drilling oil and gas wells (NAICS 213111), and support activities for oil and gas operations (NAICS 213112).
42Bureau of Labor Statistics, Hours-based fatal work injury rates, 2008–2013.
43Occupational Safety and Health Administration, “Hydraulic Fracturing and Flowback Hazards Other than Respirable Silica,” 2014, www.osha.gov/Publications/OSHA3763.pdf.
44Occupational Safety and Health Administration, “Worker Exposure to Silica During Hydraulic Fracturing,” 2012, www.osha.gov/dts/hazardalerts/hydraulic_frac_hazard_alert.html.
45U.S. Merit Systems Protection Board, “Employee Perceptions of Federal Workplace Violence: A Report to the President and the Congress of the United States,” 2012, www.mspb.gov/netsearch/viewdocs.aspx?docnumber=759001&version=761840&application=ACROBAT.
46OSHA, “Guideline for Preventing Workplace Violence for Healthcare and Social Service Workers,” April 2015, www.osha.gov/Publications/osha3148.pdf.
47Current penalties may be less than initial assigned penalties due to settlement cases.
48Policy and Procedure for the Advisory Committee Process for Permissible Exposure Limit (PEL) Updates to Title8, Section 5155, Airborne Contaminants, California Division of Occupational Safety and Health, March 2007, www.dir.ca.gov/dosh/DoshReg/PEL-Process-3-07-final-draft.pdf.
49Cal/OSHA PEL Project Status List (as of July 23, 2012), www.dir.ca.gov/dosh/doshreg/5155Meetings_2011.htm.
50www.osha.gov/pls/oshaweb/owadisp.show_document?p_table=NEWS_RELEASES&p_id=24990.
51United States Department of Labor, Mine Safety and Health Administration, “Coal Mine Safety and Health, Report of Investigation Fatal Underground Mine Explosion,” April 5, 2010, Upper Big Branch Mine-South, Montcoal, Raleigh County, West Virginia, ID No. 46-08436.
52U.S. Department of Labor, Mine Safety and Health Administration, press release, “MSHA chief: pattern of violations reforms have made mine safer,” Oct. 2, 2014, www.msha.gov/MEDIA/PRESS/2014/NR141002.asp.
NATIONAL SAFETY AND HEALTH OVERVIEW
| Year | Work Deaths |
Employment (000)3 |
Fatality Rate4 |
|---|---|---|---|
| 1970 | 13,800 | 77,700 | 18 |
| 1971 | 13,700 | 78,500 | 17 |
| 1972 | 14,000 | 81,300 | 17 |
| 1973 | 14,300 | 84,300 | 17 |
| 1974 | 13,500 | 86,200 | 16 |
| 1975 | 13,000 | 85,200 | 15 |
| 1976 | 12,500 | 88,100 | 14 |
| 1977 | 12,900 | 91,500 | 14 |
| 1978 | 13,100 | 95,500 | 14 |
| 1979 | 13,000 | 98,300 | 13 |
| 1980 | 13,200 | 98,800 | 13 |
| 1981 | 12,500 | 99,800 | 13 |
| 1982 | 11,900 | 98,800 | 12 |
| 1983 | 11,700 | 100,100 | 12 |
| 1984 | 11,500 | 104,300 | 11 |
| 1985 | 11,500 | 106,400 | 11 |
| 1986 | 11,100 | 108,900 | 10 |
| 1987 | 11,300 | 111,700 | 10 |
| 1988 | 10,800 | 114,300 | 9 |
| 1989 | 10,400 | 116,700 | 9 |
| 1990 | 10,500 | 117,400 | 9 |
| 1991 | 9,900 | 116,400 | 9 |
| 19922 | 6,217 | 117,000 | 5.2 |
| 1993 | 6,331 | 118,700 | 5.2 |
| 1994 | 6,632 | 122,400 | 5.3 |
| 1995 | 6,275 | 126,200 | 4.9 |
| 1996 | 6,202 | 127,997 | 4.8 |
| 1997 | 6,238 | 130,810 | 4.8 |
| 1998 | 6,055 | 132,684 | 4.5 |
| 1999 | 6,054 | 134,666 | 4.5 |
| 2000 | 5,920 | 136,377 | 4.3 |
| 2001 | 5,9155 | 136,252 | 4.3 |
| 2002 | 5,534 | 137,700 | 4 |
| 2003 | 5,575 | 138,928 | 4 |
| 2004 | 5,764 | 140,411 | 4.1 |
| 2005 | 5,734 | 142,894 | 4 |
| 2006 | 5,840 | 145,501 | 4 |
| 2007 | 5,657 | 147,215 | 3.8 |
| 1Fatality information for 1971 to 1991 from National Safety Council Accident Facts, 1994. 2Fatality information for 1992 to 2007 is from the Bureau of Labor Statistics, Census of Fatal Occupational Injuries (CFOI). In 1994, the National Safety Council changed its reporting method for workplace fatalities and adopted the BLS count. The earlier NSC numbers are based on an estimate; the BLS numbers are based on an actual census. 3Employment is an annual average of employed civilians 16 years of age and older from the Current Population Survey, adjusted to include data for resident and armed forces from the Department of Defense. 4Deaths per 100,000 workers are based on annual average of employed civilians 16 years of age and older from 1992 to 2007. In 2008, CFOI switched from an employment-based fatality rate to an hours-based fatality rate calculation. 5Excludes fatalities from the events of September 11, 2001. |
|||
| Year | Work Deaths |
Employment (000)2 |
Fatality Rate3 |
|---|---|---|---|
| 2006 | 5,840 | 271,815 | 4.2 |
| 2007 | 5,657 | 275,043 | 4.0 |
| 2008 | 5,214 | 271,958 | 3.7 |
| 2009 | 4,551 | 254,771 | 3.5 |
| 2010 | 4,690 | 255,948 | 3.6 |
| 2011 | 4,693 | 258,293 | 3.5 |
| 2012 | 4,628 | 264,374 | 3.4 |
| 2013 | 4,585 | 268,127 | 3.3 |
| 1Fatality information is from the U.S. Department of Labor, Bureau of Labor Statistics, Census of Fatal Occupational Injuries (CFOI). 2The total hours worked figures are annual average estimates of total at work multiplied by average hours for civilians, 16 years of age and older, from the Current Population Survey (CPS). 3Deaths per 100,000 workers. In 2008, CFOI switched to an hours-based fatality rate calculation from an employment-based calculation used from 1992 to 2007. Fatality rates for 2006 and 2007 were calculated by CFOI using both approaches during the transition to hours-based rates. Hours-based fatality rates should not be compared directly with the employment-based rates CFOI calculated for 1992 to 2007. |
|||
Rate of Fatal Work Injuries Per 100,000 Workers,1992–20071
(Employment-Based Rates)
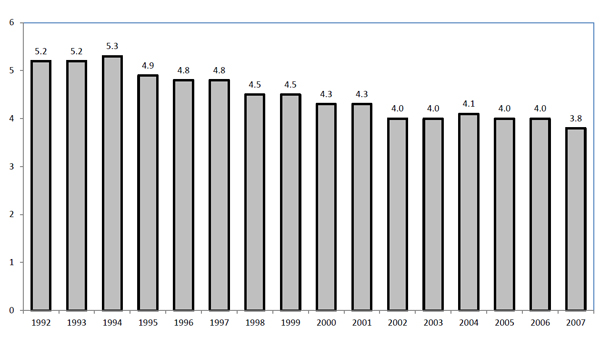
Source: U.S. Department of Labor, Bureau of Labor Statistics, Current Population Survey, Census of Fatal Occupational Injuries, U.S. Bureau of the Census and U.S. Department of Defense.
1Fatality rate is an employment-based calculation using employment figures that are annual average estimates of employed civilians, 16 years of age and older, from the Current Population Survey (CPS). In 2008, CFOI switched to an hours-based fatality rate calculation. Employment-based fatality rates should not be compared directly with hours-based rates.
Rate of Fatal Work Injuries per 100,000 Workers, 2006–20131 (Hours-Based Rates)
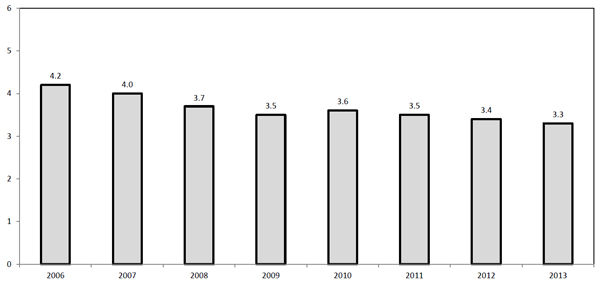
Source: U.S. Department of Labor, Bureau of Labor Statistics, Census of Fatal Occupational Injuries (CFOI).
1Fatality rate is an hours-based calculation using total hours worked figures that are annual average estimates of total at work multiplied by average hours for civilians, 16 years of age and older, from the Current Population Survey (CPS). Hours-based fatality rates should not be compared directly with the employment-based rates CFOI calculated for 1992 to 2007.
| Year | All Ind. | Mfg. | Const. | Mining | Gov't | Agri. | Trans /Util. |
Ret. Trade |
Service | Finance |
|---|---|---|---|---|---|---|---|---|---|---|
| 1970 | 18 | 9 | 69 | 100 | 13 | 64 | N/A | N/A | N/A | N/A |
| 1971 | 17 | 9 | 68 | 83 | 13 | 63 | N/A | N/A | N/A | N/A |
| 1972 | 17 | 9 | 68 | 100 | 13 | 58 | N/A | N/A | N/A | N/A |
| 1973 | 17 | 9 | 56 | 83 | 14 | 58 | 38 | 8 | 11 | N/A |
| 1974 | 16 | 8 | 53 | 71 | 13 | 54 | 35 | 7 | 10 | N/A |
| 1975 | 15 | 9 | 52 | 63 | 12 | 58 | 33 | 7 | 10 | N/A |
| 1976 | 14 | 9 | 45 | 63 | 11 | 54 | 31 | 7 | 9 | N/A |
| 1977 | 14 | 9 | 47 | 63 | 11 | 51 | 32 | 6 | 8 | N/A |
| 1978 | 14 | 9 | 48 | 56 | 11 | 52 | 29 | 7 | 7 | N/A |
| 1979 | 13 | 8 | 46 | 56 | 10 | 54 | 30 | 6 | 8 | N/A |
| 1980 | 13 | 8 | 45 | 50 | 11 | 56 | 28 | 6 | 7 | N/A |
| 1981 | 13 | 7 | 42 | 55 | 10 | 54 | 31 | 5 | 7 | N/A |
| 1982 | 12 | 6 | 40 | 50 | 11 | 52 | 26 | 5 | 6 | N/A |
| 1983 | 12 | 6 | 39 | 50 | 10 | 52 | 28 | 5 | 7 | N/A |
| 1984 | 11 | 6 | 39 | 50 | 9 | 49 | 29 | 5 | 7 | N/A |
| 1985 | 11 | 6 | 40 | 40 | 8 | 49 | 27 | 5 | 6 | N/A |
| 1986 | 10 | 5 | 37 | 38 | 8 | 55 | 29 | 4 | 5 | N/A |
| 1987 | 10 | 5 | 33 | 38 | 9 | 53 | 26 | 5 | 6 | N/A |
| 1988 | 10 | 6 | 34 | 38 | 9 | 48 | 26 | 4 | 5 | N/A |
| 1989 | 9 | 6 | 32 | 43 | 10 | 40 | 25 | 4 | 5 | N/A |
| 1990 | 9 | 5 | 33 | 43 | 10 | 42 | 20 | 4 | 4 | N/A |
| 1991 | 8 | 4 | 31 | 43 | 11 | 44 | 18 | 3 | 4 | N/A |
| 1992 | 5.2 | 4 | 14 | 27 | 4 | 24 | 13 | 4 | 2 | 2 |
| 1993 | 5.2 | 4 | 14 | 26 | 3 | 26 | 13 | 4 | 2 | 2 |
| 1994 | 5.3 | 4 | 15 | 27 | 3 | 24 | 13 | 4 | 3 | 1 |
| 1995 | 4.9 | 3 | 15 | 25 | 4 | 22 | 12 | 3 | 2 | 2 |
| 1996 | 4.8 | 3.5 | 13.9 | 26.8 | 3 | 22.2 | 13.1 | 3.1 | 2.2 | 1.5 |
| 1997 | 4.8 | 3.6 | 14.1 | 25 | 3.2 | 23.4 | 13.2 | 3 | 2 | 1.2 |
| 1998 | 4.5 | 3.3 | 14.5 | 23.6 | 3 | 23.3 | 11.8 | 2.6 | 2 | 1.1 |
| 1999 | 4.5 | 3.6 | 14 | 21.5 | 2.8 | 24.1 | 12.7 | 2.3 | 1.9 | 1.2 |
| 2000 | 4.3 | 3.3 | 12.9 | 30 | 2.8 | 20.9 | 11.8 | 2.7 | 2 | 0.9 |
| 2001 | 4.3 | 3.2 | 13.3 | 30 | 3.1 | 22.8 | 11.2 | 2.4 | 1.9 | 1 |
| 2002 | 4 | 3.1 | 12.2 | 23.5 | 2.7 | 22.7 | 11.3 | 2.1 | 1.7 | 1 |
| 1Data for 1970–1991 is from the National Safety Council, Accident Facts, 1994. Fatality information for 1992–2002 is from the Bureau of Labor Statistics, Census of Fatal Occupational Injuries (CFOI). In 1994, the National Safety Council changed its reporting method for workplace fatalities and adopted the BLS count. The earlier NSC numbers are based on an estimate; the BLS numbers are based on an actual census. Beginning with 2003, CFOI began using the North American Industry Classification (NAICS) for industries. Prior to 2003, CFOI used the Standard Industrial Classification (SIC) system. The substantial differences between these systems result in breaks in series for industry data. 2Deaths per 100,000 workers. |
||||||||||
| Industry Sector | 2003 | 2004 | 2005 | 2006 | 2007 |
|---|---|---|---|---|---|
| All Industries | 4.0 | 4.1 | 4.0 | 4.0 | 3.8 |
| Agriculture, Forestry, Fishing and Hunting |
31.2 | 30.5 | 32.5 | 30.0 | 27.9 |
| Mining | 26.9 | 28.3 | 25.6 | 28.1 | 25.1 |
| Construction | 11.7 | 12.0 | 11.1 | 10.9 | 10.5 |
| Manufacturing | 2.5 | 2.8 | 2.4 | 2.8 | 2.5 |
| Wholesale Trade | 4.2 | 4.5 | 4.6 | 4.9 | 4.7 |
| Retail Trade | 2.1 | 2.3 | 2.4 | 2.2 | 2.1 |
| Transportation and Warehousing |
17.5 | 18.0 | 17.7 | 16.8 | 16.9 |
| Utilities | 3.7 | 6.1 | 3.6 | 6.3 | 4.0 |
| Information | 1.8 | 1.7 | 2.0 | 2.0 | 2.3 |
| Finance, Insurance, Real Estate |
1.4 | 1.2 | 1.0 | 1.2 | 1.2 |
| Professional and Administrative |
3.3 | 3.3 | 3.5 | 3.2 | 3.1 |
| Educational and Health Services |
0.8 | 0.8 | 0.8 | 0.9 | 0.7 |
| Leisure and Hospitality | 2.4 | 2.2 | 1.8 | 2.3 | 2.2 |
| Other Services, Except Public Administration |
2.8 | 3.0 | 3.0 | 2.6 | 2.5 |
| Government | 2.5 | 2.5 | 2.4 | 2.4 | 2.5 |
| Source: U.S. Department of Labor, Bureau of Labor Statistics, Census of Fatal Occupational Injuries. | |||||
| 1Deaths per 100,000 workers. 2Fatality rate is an employment-based calculation using employment figures that are annual average estimates of employed civilians, 16 years of age and older, from the Current Population Survery (CPS). In 2008, CFOI switched to an hours-based fatality rate calculation. Employment-based fatality rates should not be compared directly with hours-based rates. |
|||||
Note: Beginning with the 2003 reference year, both CFOI and the Survey of Occupational Injuries and Illnesses began using the 2002 North American Industry Classification System (NAICS) for industries. Prior to 2003, the surveys used the Standard Industrial Classification (SIC) system. The substantial differences between these systems result in breaks in series for industry data.
| Industry Sector | 2007 | 2008 | 2009 | 2010 | 2011 | 2012 | 2013 |
|---|---|---|---|---|---|---|---|
| All Industries | 4.0 | 3.7 | 3.5 | 3.6 | 3.5 | 3.4 | 3.3 |
| Agriculture, Forestry, Fishing and Hunting |
27.0 | 30.4 | 27.2 | 27.9 | 24.9 | 22.8 | 23.2 |
| Mining | 21.4 | 18.1 | 12.4 | 19.8 | 15.9 | 15.9 | 12.4 |
| Construction | 10.8 | 9.7 | 9.9 | 9.8 | 9.1 | 9.9 | 9.7 |
| Manufacturing | 2.5 | 2.5 | 2.3 | 2.3 | 2.2 | 2.2 | 2.1 |
| Wholesale Trade | 4.5 | 4.4 | 5.0 | 4.9 | 4.9 | 5.4 | 5.3 |
| Retail Trade | 2.4 | 2.0 | 2.2 | 2.2 | 1.9 | 1.9 | 1.9 |
| Transportation and Warehousing |
16.5 | 14.9 | 13.3 | 13.7 | 15.3 | 14.6 | 14.0 |
| Utilities | 5.7 | 3.9 | 1.7 | 2.8 | 4.2 | 2.5 | 2.6 |
| Information | 2.3 | 1.5 | 1.1 | 1.5 | 1.9 | 1.5 | 1.5 |
| Finance, Insurance, Real Estate |
1.2 | 1.1 | 1.2 | 1.3 | 1.1 | 0.9 | 0.9 |
| Professional and Administrative |
3.3 | 2.8 | 3.1 | 2.6 | 2.9 | 2.7 | 2.8 |
| Educational and Health Services |
0.8 | 0.7 | 0.8 | 0.9 | 0.8 | 0.7 | 0.7 |
| Leisure and Hospitality | 2.5 | 2.2 | 2.2 | 2.3 | 2.2 | 2.2 | 1.9 |
| Other Services, Except Public Administration |
2.7 | 2.6 | 2.8 | 3.0 | 3.0 | 2.7 | 2.7 |
| Government | 2.3 | 2.4 | 1.9 | 2.2 | 2.2 | 2.0 | 2.0 |
| Source: U.S. Department of Labor, Bureau of Labor Statistics, Census of Fatal Occupational Injuries. | |||||||
| 1Deaths per 100,000 workers. 2In 2008, CFOI switched to an hours-based fatality rate calculation from an employment-based calculation. Fatality rates for 2007 were calculated using both approaches during the transition to hours-based rates. Fatality rate is an hours-based calculation using total hours worked figures that are annual average estimates of total at work multiplied by average hours for civilians, 16 years of age and older, from the Current Population Survey (CPS). Hours-based fatality rates should not be compared directly with employment-based rates that CFOI calculated for 1992 to 2007. |
|||||||
Occupational Fatalities by Industry, 2013 Private Sector, Government and Self Employed (Total Fatalities 4,585)
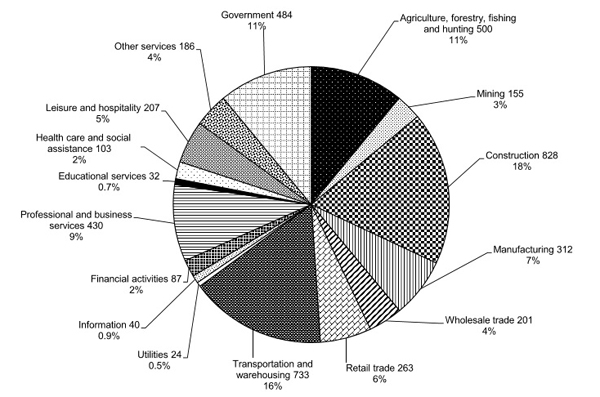
Source: U.S. Department of Labor, Bureau of Labor Statistics, Census of Fatal Occupational Injuries, 2013.
Selected Occupations With High Fatality Rates, 2013 (Per 100,000 Workers) National Fatality Rate = 3.3
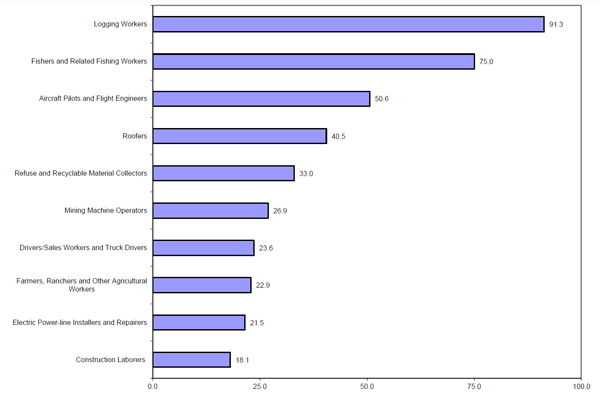
Source: U.S. Department of Labor, Bureau of Labor Statistics,
Census of Fatal Occupational Injuries, 2013.
Distribution of Fatal Injury Events by Gender of Worker, 2013
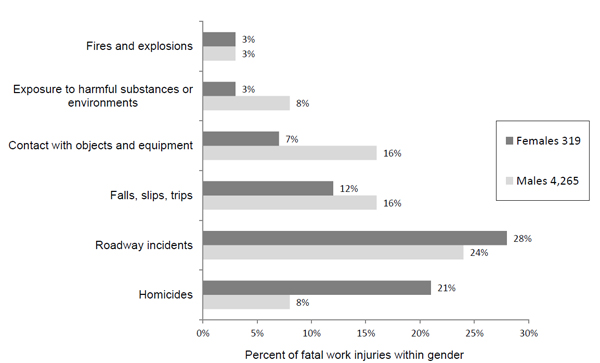
Source: U.S. Department of Labor, Bureau of Labor Statistics, Census of Fatal Occupational Injuries, 2013.
| Characteristic | Subcharacteristics | Deaths |
|---|---|---|
| Total Homicides |
404 | |
| Gender | Women Men |
66 |
| Employee Status |
Wage and salary workers Self employed |
282 122 |
| Race | White Black Latino |
188 100 67 |
| Leading Primary Source |
Assailant, suspect Co-worker or work associate Other client or customer Relative or domestic partner |
211 74 36 28 |
| Leading Secondary Source |
Firearm Knives |
323 38 |
| Leading Worker Activity |
Tending a retail establishment Protective service activities Vehicular and transportation operations |
142 68 42 |
| Leading Location |
Public building Street or highway Private residence |
211 49 45 |
| Leading Occupations |
Supervisors of sales workers Retail sales workers Motor vehicle operators |
46 43 37 |
| Leading Industries |
Retail trade Accommodations and food services Local government Transportation and warehousing1 |
95 69 39 36 |
| Source: U.S. Department of Labor, Bureau of Labor Statistics, Census of Fatal Occupational Injuries, 2013. | ||
| 1Taxi service accounted for 25 of these deaths. | ||
| Year | Total Fatalities |
White | Black or African American |
Latino | Asian or Pacific Islander |
American Indian or Alaskan Native |
Other Races/ Not Reported |
|---|---|---|---|---|---|---|---|
| 1993 | 6,331 | 4,665 | 649 | 634 | 190 | 46 | 147 |
| 1994 | 6,632 | 4,954 | 695 | 624 | 179 | 39 | 141 |
| 1995 | 6,275 | 4,599 | 684 | 619 | 161 | 27 | 185 |
| 1996 | 6,202 | 4,586 | 615 | 638 | 170 | 35 | 158 |
| 1997 | 6,238 | 4,576 | 661 | 658 | 195 | 34 | 114 |
| 1998 | 6,055 | 4,478 | 583 | 707 | 148 | 28 | 111 |
| 1999 | 6,054 | 5,019 | 627 | 730 | 192 | 57 | 146 |
| 2000 | 5,920 | 4,244 | 575 | 815 | 185 | 33 | 68 |
| 20011 | 5,900 | 4,175 | 565 | 895 | 182 | 48 | 50 |
| 2002 | 5,534 | 3,926 | 491 | 841 | 140 | 40 | 96 |
| 2003 | 5,575 | 3,988 | 543 | 794 | 158 | 42 | 50 |
| 2004 | 5,764 | 4,066 | 546 | 902 | 180 | 28 | 42 |
| 2005 | 5,734 | 3,977 | 565 | 990 | 159 | 46 | 35 |
| 2006 | 5,840 | 4,019 | 609 | 937 | 172 | 29 | 61 |
| 2007 | 5,657 | 3,867 | 533 | 804 | 152 | 32 | 43 |
| 2008 | 5,214 | 3,663 | 421 | 713 | 148 | 33 | 30 |
| 2009 | 4,551 | 3,204 | 412 | 707 | 149 | 32 | 32 |
| 2010 | 4,690 | 3,363 | 440 | 749 | 124 | 30 | 27 |
| 2011 | 4,693 | 3,323 | 486 | 748 | 154 | 37 | 27 |
| 2012 | 4,628 | 3,177 | 439 | 817 | 125 | 35 | 26 |
| 2013 | 4,585 | 3,125 | 584 | 923 | 163 | 50 | 44 |
| Source: U.S. Department of Labor, Bureau of Labor Statistics, Census of Fatal Occupational Injuries, 1993–2013. | |||||||
| 1Excludes September 11 fatalities. | |||||||
Number of Fatal Occupational Injuries to Hispanic and Latino
Workers, 1995–2013
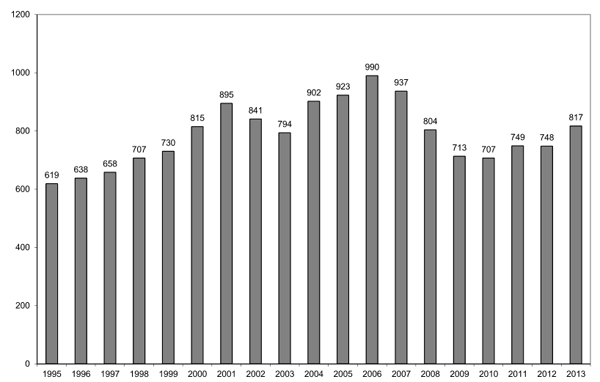
Source: U.S. Department of Labor, Bureau of Labor Statistics,
Census of Fatal Occupational Injuries.
Rate of Fatal Occupational Injuries to Hispanic and Latino Workers, 1995–20071
(Employment-Based Rates)
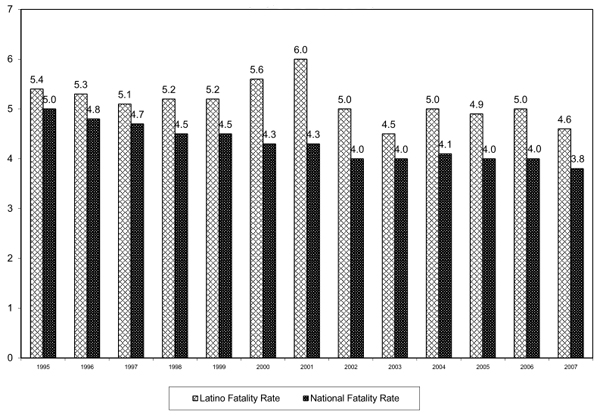
Source: U.S. Department of Labor, Bureau of Labor Statistics,
Census of Fatal Occupational Injuries (CFOI).
1Incidence rate represents the number of fatalities per 100,000 workers. Fatality rate is an employment-based calculation. In 2008, CFOI switched to an hours-based fatality rate calculation. Employment-based fatality rates should not be compared directly with hours-based rates.
Rate of Fatal Occupational Injuries to Hispanic and Latino Workers, 2006–20131
(Hours-Based Rates)
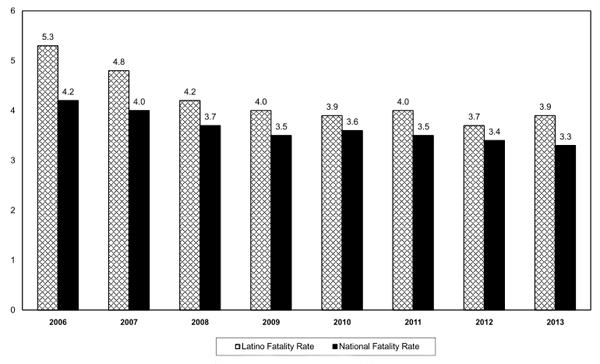
Source: U.S. Department of Labor, Bureau of Labor Statistics,
Census of Fatal Occupational Injuries (CFOI).
1Incidence rate represents the number of fatalities per 100,000 workers. In 2008, CFOI switched to an hours-based calculation from an employment-based calculation it used from 1992 to 2007. Fatality rate is an hours-based calculation using total hours worked figures that are annual average estimates of total at work multiplied by average hours for civilians, 16 years of age and older, from the Current Population Survey (CPS). Fatality rates for 2006 and 2007 were calculated by CFOI using both employment-based and hours-based calculations during the transition to hours-based rates beginning exclusively in 2008.
| Characteristic | Subcharacteristics | Deaths |
|---|---|---|
| Total Fatalities |
817 | |
| Country of Birth | Native-born Foreign-born |
275 542 |
| Leading Birthplace Countries |
Mexico United States El Salvador |
360 275 51 |
| Employee Status |
Wage and salary workers Self employed |
723 94 |
| Gender | Men Women |
774 42 |
| Leading Occupations |
Construction trades workers Motor vehicle operators Grounds maintenance Agricultural workers |
198 109 70 55 |
| Leading Industries |
Construction Administrative and support and waste management and remediation services1 Transportation and warehousing2 |
142 68 42 |
| Leading Event or Exposure |
Transportation incidents Fall, slip, trip Contact with object/equipment Violence3 |
267 179 169 107 |
| Source: U.S. Department of Labor, Bureau of Labor Statistics, Census of Fatal Occupational Injuries, 2013. |
||
| 1Landscaping services accounted for 71 of these deaths. 2 Truck transportation accounted for 54 of these deaths. 3 Excludes animal- and insect-related incidents. |
||
| Characteristic | Subcharacteristics | Deaths |
|---|---|---|
| Total Fatalities | 879 | |
| Leading Birthplace Countries |
Mexico El Salvador Guatemala India |
360 52 37 35 |
| Employee Status |
Wage and salary workers Self employed |
718 161 |
| Gender | Men Women |
831 47 |
| Leading Occupations |
Construction trades workers Motor vehicle operators Grounds maintenance Agricultural workers Material moving workers |
176 161 64 55 45 |
| Leading Industries |
Construction Transportation and warehousing1 Administrative and support and waste management and remediation services2 Retail Trade |
217 160 98 73 |
| Leading Event or Exposure |
Transportation incidents Violence3 Fall, slip, trip Contact with object/equipment |
278 182 172 170 |
| Source: U.S. Department of Labor, Bureau of Labor Statistics, Census of Fatal Occupational Injuries, 2013. |
||
| 1Truck transportation accounted for 102 of these deaths. 2Landscaping services accounted for 62 of these deaths. 3 Excludes animal- and insect-related incidents. |
||
| Cases with Days Away from Work, Job Transfer or Restriction | ||||
|---|---|---|---|---|
| Year | Total Case Rate |
Total | Cases with Days Away from Work |
Cases with Job Transfer or Restriction1 |
| 1972 | 10.9 | 3.3 | N/A | N/A |
| 1973 | 11.0 | 3.4 | N/A | N/A |
| 1974 | 10.4 | 3.5 | N/A | N/A |
| 1975 | 9.1 | 3.3 | N/A | N/A |
| 1976 | 9.2 | 3.5 | 3.3 | 0.2 |
| 1977 | 9.3 | 3.8 | 3.6 | 0.2 |
| 1978 | 9.4 | 4.1 | 3.8 | 0.3 |
| 1979 | 9.5 | 4.3 | 4.0 | 0.3 |
| 1980 | 8.7 | 4.0 | 3.7 | 0.3 |
| 1981 | 8.3 | 3.8 | 3.5 | 0.3 |
| 1982 | 7.7 | 3.5 | 3.2 | 0.3 |
| 1983 | 7.6 | 3.4 | 3.2 | 0.3 |
| 1984 | 8.0 | 3.7 | 3.4 | 0.3 |
| 1985 | 7.9 | 3.6 | 3.3 | 0.3 |
| 1986 | 7.9 | 3.6 | 3.3 | 0.3 |
| 1987 | 8.3 | 3.8 | 3.4 | 0.4 |
| 1988 | 8.6 | 4.0 | 3.5 | 0.5 |
| 1989 | 8.6 | 4.0 | 3.4 | 0.6 |
| 1990 | 8.8 | 4.1 | 3.4 | 0.7 |
| 1991 | 8.4 | 3.9 | 3.2 | 0.7 |
| 1992 | 8.9 | 3.9 | 3.0 | 0.8 |
| 1993 | 8.5 | 3.8 | 2.9 | 0.9 |
| 1994 | 8.4 | 3.8 | 2.8 | 1.0 |
| 1995 | 8.1 | 3.6 | 2.5 | 1.1 |
| 1996 | 7.4 | 3.4 | 2.2 | 1.1 |
| 1997 | 7.1 | 3.3 | 2.1 | 1.2 |
| 1998 | 6.7 | 3.1 | 2.0 | 1.2 |
| 1999 | 6.3 | 3.0 | 1.9 | 1.2 |
| 2000 | 6.1 | 3.0 | 1.8 | 1.2 |
| 2001 | 5.7 | 2.8 | 1.7 | 1.1 |
| 2002 | 5.3 | 2.8 | 1.6 | 1.2 |
| 2003 | 5.0 | 2.6 | 1.5 | 1.1 |
| 2004 | 4.8 | 2.5 | 1.4 | 1.1 |
| 2005 | 4.6 | 2.4 | 1.4 | 1.0 |
| 2006 | 4.4 | 2.3 | 1.3 | 1.0 |
| 2007 | 4.2 | 2.1 | 1.2 | 0.9 |
| 2008 | 3.9 | 2.0 | 1.1 | 0.9 |
| 2009 | 3.6 | 2.0 | 1.1 | 0.8 |
| 2010 | 3.5 | 1.8 | 1.1 | 0.8 |
| 2011 | 3.5 | 1.8 | 1.1 | 0.7 |
| 2012 | 3.4 | 1.8 | 1.0 | 0.7 |
| 2013 | 3.3 | 1.7 | 1.0 | 0.7 |
| Source: Department of Labor, Bureau of Labor Statistics. Data not available for 1971. | ||||
| 1Through 2001, this column includes cases involving restricted activity only. | ||||
| Year | Total Case Rate All Ind. |
Total Case Rate Mfg. |
Total Case Rate Const. |
Total Case Rate Mining |
Total Case Rate Finance |
Total Case Rate Agri. |
Total Case Rate Trans./Util. |
Total Case Rate Trade |
Total Case Rate Service |
|---|---|---|---|---|---|---|---|---|---|
| 1973 | 11.0 | 15.3 | 19.8 | 12.5 | 2.4 | 11.6 | 10.3 | 8.6 | 6.2 |
| 1974 | 10.4 | 14.6 | 18.3 | 10.2 | 2.4 | 9.9 | 10.5 | 8.4 | 5.8 |
| 1975 | 9.1 | 13.0 | 16.0 | 11.0 | 2.2 | 8.5 | 9.4 | 7.3 | 5.4 |
| 1976 | 9.2 | 13.2 | 15.3 | 11.0 | 2.0 | 11.0 | 9.8 | 7.5 | 5.3 |
| 1977 | 9.3 | 13.1 | 15.5 | 10.9 | 2.0 | 11.5 | 9.7 | 7.7 | 5.5 |
| 1978 | 9.4 | 13.2 | 16.0 | 11.5 | 2.1 | 11.6 | 10.1 | 7.9 | 5.5 |
| 1979 | 9.5 | 13.3 | 16.2 | 11.4 | 2.1 | 11.7 | 10.2 | 8.0 | 5.5 |
| 1980 | 8.7 | 12.2 | 15.7 | 11.2 | 2.0 | 11.9 | 9.4 | 7.4 | 5.2 |
| 1981 | 8.3 | 11.5 | 15.1 | 11.6 | 1.9 | 12.3 | 9.0 | 7.3 | 5.0 |
| 1982 | 7.7 | 10.2 | 14.6 | 10.5 | 2.0 | 11.8 | 8.5 | 7.2 | 4.9 |
| 1983 | 7.6 | 10.0 | 14.8 | 8.4 | 2.0 | 11.9 | 8.2 | 7.0 | 5.1 |
| 1984 | 8.0 | 10.6 | 15.5 | 9.7 | 1.9 | 12.0 | 8.8 | 7.2 | 5.2 |
| 1985 | 7.9 | 10.4 | 15.2 | 8.4 | 2.0 | 11.4 | 8.6 | 7.4 | 5.4 |
| 1986 | 7.9 | 10.6 | 15.2 | 7.4 | 2.0 | 11.2 | 8.2 | 7.7 | 5.3 |
| 1987 | 8.3 | 11.9 | 14.7 | 8.5 | 2.0 | 11.2 | 8.4 | 7.4 | 5.5 |
| 1988 | 8.6 | 13.1 | 14.6 | 8.8 | 2.0 | 10.9 | 8.9 | 7.6 | 5.4 |
| 1989 | 8.6 | 13.1 | 14.3 | 8.5 | 2.0 | 10.9 | 9.2 | 8.0 | 5.5 |
| 1990 | 8.8 | 13.2 | 14.2 | 8.3 | 2.4 | 11.6 | 9.6 | 7.9 | 6.0 |
| 1991 | 8.4 | 12.7 | 13.0 | 7.4 | 2.4 | 10.8 | 9.3 | 7.6 | 6.2 |
| 1992 | 8.9 | 12.5 | 13.1 | 7.3 | 2.9 | 11.6 | 9.1 | 8.4 | 7.1 |
| 1993 | 8.6 | 12.1 | 12.2 | 6.8 | 2.9 | 11.2 | 9.5 | 8.1 | 6.7 |
| 1994 | 8.4 | 12.2 | 11.8 | 6.3 | 2.7 | 10.0 | 9.3 | 7.9 | 6.5 |
| 1995 | 8.1 | 11.6 | 10.6 | 6.2 | 2.6 | 9.7 | 9.1 | 7.5 | 6.4 |
| 1996 | 7.4 | 10.6 | 9.9 | 5.4 | 2.4 | 8.7 | 8.7 | 6.8 | 6.0 |
| 1997 | 7.1 | 10.3 | 9.5 | 5.9 | 2.2 | 8.4 | 8.2 | 6.7 | 5.6 |
| 1998 | 6.7 | 9.7 | 8.8 | 4.9 | 1.9 | 7.9 | 7.3 | 6.5 | 5.2 |
| 1999 | 6.3 | 9.2 | 8.6 | 4.4 | 1.8 | 7.3 | 7.3 | 6.1 | 4.9 |
| 2000 | 6.1 | 9.0 | 8.3 | 4.7 | 1.9 | 7.1 | 6.9 | 5.9 | 4.9 |
| 2001 | 5.7 | 8.1 | 7.9 | 4.0 | 1.8 | 7.3 | 6.9 | 5.6 | 4.6 |
| 2002 | 5.3 | 7.2 | 7.1 | 4.0 | 1.7 | 6.4 | 6.1 | 5.3 | 4.6 |
| Source: U.S. Department of Labor, Bureau of Labor Statistics, Incidence Rates of Nonfatal Occupational Injuries and Illnesses by Industry Division, 1973–2002. | |||||||||
| 1Beginning with the 2003 reference year, the Survey of Occupational Injuries and Illnesses began using the North American Industry Classification System (NAICS) for industries. Prior to 2003, the survey used the Standard Industrial Classification (SIC) system. The substantial differences between these systems result in breaks in series for industry data. | |||||||||
| 2003 | 2004 | 2005 | 2006 | 2007 | 20082 | 2009 | 2010 | 2011 | 2012 | 2013 | |
|---|---|---|---|---|---|---|---|---|---|---|---|
| Total Case Rate, Private Industry |
5.0 | 4.8 | 4.6 | 4.4 | 4.2 | 3.9 | 3.6 | 3.5 | 3.5 | 3.4 | 3.3 |
| Natural resources and mining |
5.1 |
5.3 |
5.1 |
4.9 |
4.4 |
4.1 |
4.0 |
3.7 |
4.0 |
3.8 |
3.9 |
| Agriculture, forestry, fishing and hunting |
6.2 | 6.4 | 6.1 | 6.0 | 5.4 | 5.3 | 5.3 | 4.8 | 5.5 | 5.5 | 5.7 |
| Mining | 3.3 | 3.8 | 3.6 | 3.5 | 3.1 | 2.9 | 2.4 | 2.3 | 2.2 | 2.1 | 2.0 |
| Construction | 6.8 | 6.4 | 6.3 | 5.9 | 5.4 | 4.7 | 4.3 | 4.0 | 3.9 | 3.7 | 3.8 |
| Manufacturing | 6.8 | 6.8 | 6.3 | 6.0 | 5.6 | 5.0 | 4.3 | 4.4 | 4.4 | 4.3 | 4.0 |
| Trade, transportation and utilities |
5.5 | 5.5 | 5.2 | 5.0 | 4.9 | 4.4 | 4.1 | 4.1 | 3.9 | 3.9 | 3.8 |
| Wholesale trade | 4.7 | 4.5 | 4.5 | 4.1 | 4.0 | 3.7 | 3.3 | 3.4 | 3.2 | 3.3 | 3.1 |
| Retail trade | 5.3 | 5.3 | 5.0 | 4.9 | 4.8 | 4.4 | 4.2 | 4.1 | 3.9 | 4.0 | 3.8 |
| Transportation and warehousing |
7.8 | 7.3 | 7.0 | 6.5 | 6.4 | 5.7 | 5.2 | 5.2 | 5.0 | 4.9 | 4.7 |
| Utilities | 4.4 | 5.2 | 4.6 | 4.1 | 4.0 | 3.5 | 3.3 | 3.1 | 3.5 | 2.8 | 2.1 |
| Information | 2.2 | 2.0 | 2.1 | 1.9 | 2.0 | 2.0 | 1.9 | 1.8 | 1.6 | 1.4 | 1.5 |
| Financial activities |
1.7 | 1.6 | 1.7 | 1.5 | 1.4 | 1.5 | 1.5 | 1.3 | 1.4 | 1.3 | 1.3 |
| Professional and business services |
2.5 | 2.1 | 2.4 | 2.1 | 2.1 | 1.9 | 1.8 | 1.7 | 1.7 | 1.6 | 1.6 |
| Educational and health services3 |
6.0 | 5.8 | 5.5 | 5.4 | 5.2 | 5.0 | 5.0 | 4.8 | 4.7 | 4.5 | 4.4 |
| Leisure and hospitality |
5.1 | 4.7 | 4.7 | 1.6 | 4.5 | 4.2 | 39 | 3.9 | 4.0 | 3.9 | 3.8 |
| Other services, except public administration |
3.4 | 3.2 | 3.2 | 2.9 | 3.1 | 3.1 | 2.9 | 2.7 | 2.6 | 2.5 | 2.5 |
| State and local government |
6.3 |
5.8 |
5.7 |
5.7 |
5.6 |
5.2 | |||||
| State government |
4.7 | 4.6 | 4.6 | 4.6 | 4.6 | 3.9 | |||||
| Local government |
7.0 | 6.3 | 6.1 | 6.1 | 6.1 | 5.7 | |||||
| Source: U.S. Department of Labor, Bureau of Labor Statistics. | |||||||||||
| 1 Total recordable cases per 100 workers. 2Beginning with 2008, the Bureau of Labor Statistics provided national public-sector estimates for state and local government workers. 3The injury and illness rate for nursing and residential care facilities was 7.3 in 2013. |
|||||||||||
Note: Beginning with the 2003 reference year, both CFOI and the Survey of Occupational Injuries and Illnesses began using the 2002 North American Industry Classification System (NAICS) for industries. Prior to 2003, the surveys used the Standard Industrial Classification (SIC) system. The substantial differences between these systems result in breaks in series of industry data.
| Industry | State Government | Local Government | Private Industry |
|---|---|---|---|
| All Industries Combined |
3.9 | 5.7 | 3.3 |
| Construction | -- | 7.9 | 3.8 |
| Educational Services |
2.1 | 4.5 | 2.0 |
| Hospitals | 7.7 | 6.0 | 6.4 |
| Nursing and Residential Care Facilities |
13.7 | 8.1 | 7.3 |
| Transportation and Warehousing |
-- | 7.1 | 4.7 |
| Utilities | -- | 6.3 | 2.1 |
| Source: U.S. Department of Labor, Bureau of Labor Statistics. | |||
| 1Total recordable cases per 100 workers. | |||
| Industry | State Government | Local Government | Private Industry |
|---|---|---|---|
| All Industries Combined |
160.1 | 174.1 | 99.9 |
| Construction | 175.9 | 281.8 | 154.7 |
| Educational Services |
58.0 | 109.6 | 56.5 |
| Hospitals | 323.2 | 144.7 | 151.3 |
| Nursing and Residential Care Facilities |
694.5 | 325.0 | 222.5 |
| Transportation and Warehousing |
-- | 409.0 | 215.3 |
| Utilities | -- | -- | 60.6 |
| Source: U.S. Department of Labor, Bureau of Labor Statistics. | |||
| 1Days away from work cases per 10,000 workers. | |||
Industries with the Highest Total Nonfatal Injury and Illness Rates, 2013
(Per 100 Workers)
Private Industry = 3.3
State Government = 3.9
Local Government = 5.7
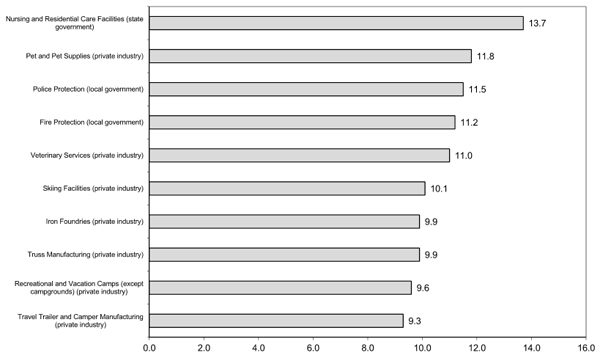
Source: U.S. Department of Labor, Bureau of Labor Statistics, Survey of Occupational Injuries and Illnesses, 2013.
Nonfatal Occupational Injuries and Illnesses with Days Away from Work by Event or Exposure, 20131
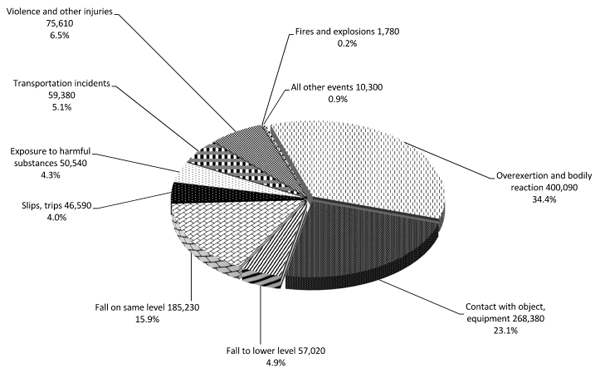
Source: U.S. Department of Labor, Bureau of Labor Statistics, Survey of Occupational Injuries and Illnesses, 2013.
1Includes total number in private industry, state and local government.
| Year | Number of Hispanic or Latino Worker Cases | Percent of Total Injury and Illness Cases |
|---|---|---|
| 1995 | 191,665 | 9.4 |
| 1996 | 169,300 | 9.0 |
| 1997 | 187,221 | 10.2 |
| 1998 | 179,399 | 10.4 |
| 1999 | 182,896 | 10.7 |
| 2000 | 186,029 | 11.2 |
| 2001 | 191,959 | 125 |
| 20022 | 180,419 | 12.6 |
| 20033 | 161,330 | 12.3 |
| 20043 | 164,390 | 13.1 |
| 20053 | 163,440 | 13.2 |
| 20063 | 159,440 | 13.5 |
| 20073 | 157,320 | 13.6 |
| 20083 | 145,870 | 13.5 |
| 20093 | 125,790 | 13.0 |
| 20103 | 122,970 | 13.2 |
| 20113 | 117,210 | 12.9 |
| 20123 | 118,940 | 13.1 |
| 20133 | 124,330 | 13.6 |
| Source: U.S. Department of Labor, Bureau of Labor Statistics. | ||
| 1Days away from work include those that result in days away from work with or without restricted work activity. They do not include cases involving only restricted work activity. 2Days away from work cases include those that result in days away from work with or without job transfer or restriction. 3Classification of workers by race and ethnicity was revised in 2003 to conform to other government data. One result of this revision is that individuals may be categorized in more than one race or ethnic group. Cases reflected here are for those who reported Hispanic or Latino only and Hispanic or Latino and other race. Race and ethnicity data reporting is not mandatory in the BLS Survey of Occupational Injuries and Illnesses. This resulted in 30% or more of the cases not reporting race and ethnicity in 2003 through 2010. |
||
Note: Due to the revised recordkeeping rule, which became effective Jan. 1, 2002, the estimates from the 2002 BLS Survey of Occupational Injuries and Illnesses are not comparable with those from previous years. Among the changes that could affect comparisons are: changes to the list of low-hazard industries that are exempt from recordkeeping, employers are no longer required to record all illnesses regardless of severity, there is a new category of injuries/illnesses diagnosed by a physician or health care professional, changes to the definition of first aid and days away from work are recorded as calendar days.
| Characteristic | Subcharacteristics | Number |
|---|---|---|
| Total Number of Injuries and Illnesses with Days Away from Work |
350,510 | |
| Leading Industries | Nursing and residential care facilities Hospitals Food service and drinking places |
46,770 45,100 28,070 |
| Leading Occupations | Nursing, psychiatric and home health aides Building clearning workers Registered nurses |
44,670 23,140 20,150 |
| Leading Nature | Sprains, strains, tears Soreness, pain, hurt, unspecified Bruises, constusions |
134,770 65,670 34,800 |
| Leading Event or Exposure | Overexertion and bodily reaction Falls, slips, trips Contact with objects and equipment |
124,420 107,800 61,870 |
| Leading Source | Bodily motion or position of injured, ill worker Floors1 Patient |
54,960 45,410 41,420 |
| Median Days Away from Work | Total Cases | 8 |
| Women | 7 | |
| Source: U.S. Department of Labor, Bureau of Labor Statistics, Survey of Occupational Injuries and Illnesses, 2013. | ||
| 1 This category accounts for floors only. Floors, walkways and ground surfaces combined accounted for 76,820 injuries and illnesses involving days away from work for women. | ||
| Characteristic | Subcharacteristics | Number |
|---|---|---|
| Total Number of Injuries and Illnesses with Days Away from Work |
562,790 | |
| Leading Industries |
Specialty trade contractors | 56,270 |
| Truck Transportation | 31,210 | |
| Food services and drinking places | 27,930 | |
| Leading Occupations |
Driver/sales workers and truck drivers | 74,420 |
| Laborers and material movers, hand | 48,030 | |
| Maintenance and repair workers, general | 21,350 | |
| Leading Nature |
Sprains, strains, tears | 190,510 |
| Soreness, pain, hurt, unspecified | 87,990 | |
| Cuts, lacerations | 55,210 | |
| Leading Event or Exposure |
Overexertion and bodily reaction | 196,990 |
| Contact with objects and equipment | 169,920 | |
| Falls, slips, trips | 120,430 | |
| Leading Source |
Bodily motion or position of injured, ill worker | 80,980 |
| Containers non-pressurized | 47,240 | |
| Floors1 | 25,860 | |
| Median Days Away from Work |
Total cases | 8 |
| Men | 10 | |
| Source: U.S. Department of Labor, Bureau of Labor Statistics, Survey of Occupational Injuries and Illnesses, 2013. | ||
| 1This category accounts for floors only. Floors, walkways and ground surfaces combined accounted for 66,180 injuries and illnesses involving days away from work for men. | ||
| Characteristic | Subcharacteristics | Number |
|---|---|---|
| Total Events | 26,520 | |
| Gender | Women | 18,570 |
| Men | 7,780 | |
| Not reported | 80 | |
| Leading Industries |
Nursing and residential care facilities |
8,790 |
| Hospitals | 5,720 | |
| Social assistance | 3,010 | |
| Ambulatory health care services |
1,680 | |
| Leading Occupations |
Nursing, psychiatric and home health aides |
7,490 |
| Registered nurses | 2,040 | |
| Personal care aides | 2,010 | |
| Leading Nature of Injury |
Sprains, strains, tears | 8,710 |
| Soreness, pain | 5,230 | |
| Bruises, contusions | 3,800 | |
| Leading Source |
Patient | 13,810 |
| Other client or customer | 4,110 | |
| Student | 2,450 | |
| Median Days Away from Work |
Overall, all injuries and illnesses |
8 |
| Intentional injury by person | 5 | |
| Injury by person- unintentional or intent unknown |
6 | |
| Source: U.S. Department of Labor, Bureau of Labor Statistics, Survey of Occupational Injuries and Illnesses, 2013. | ||
| 1Violence events in private industry include intentional injury by person and injury by person–unintentional or intent unknown. | ||
| Year | Total MSD Cases1 |
MSD Cases with Days Away from Work, Job Transfer or Restriction1,3 |
MSD Cases with Job Transfer or Restriction1,4 |
MSDs Involving Days Away from Work5 |
Percent of Cases Involving MSDs |
|---|---|---|---|---|---|
| 1993 | 2,283,979 | 1,005,949 | 242.351 | 762.7 | 33.9% |
| 1994 | 2,287,212 | 1,034,618 | 278.647 | 755.6 | 33.8% |
| 1995 | 2,242,211 | 1,013,486 | 317.539 | 695.8 | 34.1% |
| 1996 | 2,146,182 | 974.38 | 327.025 | 647.355 | 34.4% |
| 1997 | 2,101,795 | 980.24 | 353.888 | 626.352 | 34.2% |
| 1998 | 2,025,598 | 950.999 | 358.455 | 592.544 | 34.2% |
| 1999 | 1,951,862 | 938.038 | 355.698 | 582.34 | 34.2% |
| 2000 | 1,960,585 | 954.979 | 377.165 | 577.814 | 34.7% |
| 2001 | 1,773,304 | 870.094 | 347.31 | 522.5 | 34.0% |
| 2002 | 1,598,204 | 848.062 | 359.788 | 487.915 | 34.0% |
| 2003 | 1,440,516 | 759.627 | 325.38 | 435.18 | 33.0% |
| 2004 | 1,362,336 | 712 | 309.024 | 402.7 | 32.0% |
| 2005 | 1,264,260 | 655.44 | 285.03 | 375.54 | 30.0% |
| 2006 | 1,233,791 | 638.609 | 281.192 | 357.16 | 30.2% |
| 2007 | 1,152,778 | 586.368 | 252.634 | 333.76 | 28.8% |
| 2008 | 1,086,653 | 558.835 | 241.844 | 317.44 | 29.4% |
| 2009 | 963.644 | 490.216 | 206.506 | 283.8 | 29.4% |
| 2010 | 934.337 | 487.421 | 202.795 | 284.34 | 30.5% |
| 2011 | 1,018,397 | 534.697 | 214.966 | 309.94 | 34.1% |
| 2012 | 1,032,811 | 539.793 | 225.515 | 314.47 | 34.7% |
| 2013 | 1,015,212 | 522.988 | 215.348 | 307.64 | 33.5% |
| Source: U.S. Department of Labor, Bureau of Labor Statistics. | |||||
| 1Total MSD cases, MSD days away, job transfer or restriction cases, and MSD job transfer or restriction cases are estimated based upon the percentage of MSD cases reported by BLS for the total days away from work cases involving MSD in private industry. 2These figures are based on employer-reported cases of MSDs provided to BLS. The number of cases shown here does not reflect the impact of under-reporting, which would significantly increase the true toll of MSDs occurring among workers. OSHA has estimated that for every reported MSD, two MSDs go unreported. 3Through 2001, this column was titled Total MSD Lost Workday Cases. The new title reflects the change in the recordkeeping standard that went into effect Jan. 1, 2002. Lost workday cases were defined as those that involve days away from work, days of restricted work activity, or both. They do not include cases involving only restricted work activity. 4Through 2001, this column was titled MSD Cases with Days of Restricted Activity. The new title reflects the change in the recordkeeping standard that went into effect Jan. 1, 2002. 5Days away from work cases include those that result in days away from work or without job transfer or restriction. Prior to 2002, days away from work cases included those that resulted in days away from work or without restricted activity. They do not include cases involving only restricted work activity. |
|||||
| Occupation | Number of MSDs3 |
|---|---|
| Nursing assistants | 22,000 |
| Laborers and freight, stock and material movers, handlers |
21,080 |
| Heavy and tractor-trailer truck drivers |
15,730 |
| Janitos, and cleaners, except maids and housekeeping cleaners |
14,390 |
| Registered nurses | 11,430 |
| Stock clerks and order fillers | 10,990 |
| Maintenance and repair workers, general |
10,660 |
| Light truck or delivery services drivers |
9,580 |
| Retail salespersons | 9,070 |
| Production workers, all other | 8,220 |
| Maids and housekeeping cleaners | 7,510 |
| Firefighters | 7,380 |
| First-line supervisors of retail sales workers |
5,970 |
| Police and sheriff patrol officers | 5,060 |
| Construction laborers | 4,960 |
| Personal care aides | 4,920 |
| Assemblers and fabricators, all other | 4,410 |
| Emergency medical technicians and paramedicas |
4,360 |
| Cashiers | 4,250 |
| Source: U.S. Department of Labor, Bureau of Labor Statistics. | |
| 1Days away from work cases include those that result in days away from work with or without job transfer or restriction. 2Includes cases where the nature of injury is sprains, tears; back pain, hurt back; soreness, pain, hurt except back; carpal tunnel syndrome; hernia; musculoskeletal system and connective tissue diseases and disorders; and when the event or exposure leading to the injury or illness is bodily reaction/bending, climbing, crawling, reaching, twisting, overexertion or repetition. Cases of Raynaud's phenomenon, tarsal tunnel syndrome and herniated spinal discs are not included. Although these cases may be considered MSDs, the survey classifies these cases in categories that also include non-MSD cases. 3Includes total number in private industry, state and local government. |
|
| Industry (NAICS Code) | Incidence Rate1 | Total Cases | Median Days Away from Work | |
|---|---|---|---|---|
| 000 | All Private Industry |
33.5 | 307,640 | 11 |
| 481 | Air transportation |
195.9 | 6,710 | 21 |
| 492 | Couriers and messengers |
118.7 | 4,410 | 68 |
| 623 | Nursing and residential care facilities |
88.4 | 21,850 | 6 |
| 493 | Warehouse and storage |
87.9 | 5,520 | 10 |
| 114 | Fishing, hunting, and trapping |
75.9 | 60 | 70 |
| 484 | Truck transportation |
75.4 | 11,090 | 21 |
| 562 | Waste management and remediation services |
72.4 | 2,740 | 31 |
| 444 | Building material and garden equipment and supply dealers |
70.3 | 7,450 | 14 |
| 622 | Hospitals | 69.0 | 26,320 | 8 |
| 312 | Beverage and tobacco product manufacturing |
64.1 | 1,190 | 16 |
| 316 | Leather and allied product manufacturing |
61.7 | 160 | 8 |
| 454 | Nonstore retailers |
58.6 | 2,260 | 9 |
| 321 | Wood product manufacturing |
56.9 | 1,970 | 12 |
| 445 | Food and beverage stores |
56.5 | 11,760 | 15 |
| 424 | Merchant wholesalers -- nondurable goods |
54.4 | 10,360 | 15 |
| 442 | Furniture and home furnishings stores |
51.6 | 1,820 | 9 |
| 238 | Specialty trade contractors |
50.2 | 16,430 | 13 |
| 532 | Rental and leasing services |
48.3 | 2,370 | 18 |
| 721 | Accommodation | 47.6 | 6,820 | 8 |
| 327 | Nonmetalic mineral product manufacturing |
47.2 | 1,790 | 20 |
| 111 | Crop production | 45.6 | 1,820 | 9 |
| 337 | Furniture and related product manufacturing |
45.6 | 1,580 | 8 |
| 485 | Transit and ground passenger transport |
44.9 | 1,410 | 14 |
| 311 | Food manufacturing | 44.5 | 6,420 | 11 |
| 336 | Transportation equipment manufacturing |
44.5 | 6,600 | 21 |
| 517 | Telecommunications | 44.2 | 3,720 | 25 |
| 212 | Mining (except oil and gas) |
42.5 | 990 | 40 |
| 115 | Support activities for agriculture and forestry |
42.4 | 1,280 | 4 |
| Source: U.S. Department of Labor, Bureau of Labor Statistics. | ||||
| 1Incidence rate per 10,000 workers. | ||||
| Industry (NAICS Code) | Total Cases | Incidence Rate1 | Median Days Away from Work | |
|---|---|---|---|---|
| 000 | All Private Industry |
307,640 | 33.5 | 11 |
| 622 | Hospitals | 26,320 | 69.0 | 8 |
| 623 | Nursing and residential care facilities |
21,850 | 88.4 | 6 |
| 238 | Specialty trade contractors |
16,430 | 50.2 | 13 |
| 445 | Food and beverage stores |
11,760 | 56.5 | 15 |
| 621 | Ambulatory health care services |
11,580 | 22.9 | 8 |
| 484 | Truck transportation | 11,090 | 75.4 | 21 |
| 424 | Merchant wholesalers -- nondurable goods |
10,360 | 54.4 | 15 |
| 722 | Food services and drinking places |
10,030 | 15.8 | 5 |
| 561 | Administrative and support services |
10,020 | 22.9 | 14 |
| 452 | General merchandise stores |
9,060 | 41.5 | 9 |
| 423 | Merchant wholesalers -- durable goods |
8,790 | 30.9 | 8 |
| 444 | Building material and garden equipment and supply dealers |
7,450 | 70.3 | 14 |
| 624 | Social assistance | 7,170 | 36.2 | 7 |
| 721 | Accommodation | 6,820 | 47.6 | 8 |
| 481 | Air transportation | 6,710 | 195.9 | 21 |
| 336 | Transportation equipment manufacturing |
6,600 | 44.5 | 21 |
| 311 | Food manufacturing | 6,420 | 44.5 | 11 |
| 332 | Fabricated metal product manufacturing |
5,830 | 40.7 | 10 |
| 441 | Motor vehicle and parts dealers |
5,540 | 32.6 | 13 |
| 493 | Warehouse and storage | 5,520 | 87.9 | 10 |
| 531 | Real estate | 5,150 | 40.4 | 9 |
| 541 | Professional -- scientific and technical services |
4,560 | 6.0 | 12 |
| 492 | Couriers and messengers | 4,410 | 118.7 | 68 |
| 236 | Construction of buildings | 3,820 | 32.2 | 18 |
| 517 | Telecommunications | 3,720 | 44.2 | 25 |
| 333 | Machinery manufacturing | 3,720 | 33.7 | 14 |
| 811 | Repair and maintenance | 3,320 | 30.0 | 11 |
| 713 | Amusement -- gambling and recreational industries |
3,110 | 33.5 | 10 |
| Source: U.S. Department of Labor, Bureau of Labor Statistics. | ||||
| 1Incidence rate per 10,000 workers. | ||||
| Estimated 2013 Figures Accounting for Impact of Undercounting Injuries and Illnesses1 | 2013 Data Reported by Bureau of Labor Statistics (BLS) | |
|---|---|---|
| Total Number of Nonfatal Injuries and Illnesses in Private Industry |
9.0 million | 3.0 million |
| Total Nonfatal Injury and Illness Case Rate in Private Industry (cases per 100 workers) |
9.9 | 3.3 |
| Total Number of Injuries and Illnesses Involving Days Away from Work in Private Industry |
2.7 million | 917,090 |
| Case Rate for Nonfatal Injuries and Illnesses Involving Days Away from Work (cases per 100 workers) in Private Industry |
3.3 | 1.1 |
| Total Number of Musculoskeletal Disorders – Cases Involving Days Away from Work in Private Industry |
922,920 | 307,640 |
| Total Number of Estimated Cases of Musculoskeletal Disorders in Private Industry |
3,045,636 | 1,015,212 |
| Source: U.S. Department of Labor, Bureau of Labor Statistics. | ||
| 1A detailed comparison of individual injury and illness reports from various reporting systems found that only one in three workplace injuries and illnesses was reported on the OSHA Log and captured by the Bureau of Labor Statistics survey. This study did not address the number of injuries and illnesses that are not reported to any reporting system in the first place. Thus, this study represents a conservative estimate of under-reporting of the true toll of injuries and illnesses. For more details on the study, see the paper by Rosenman, et al., "How Much Work-Related Injury and illness is Missed by the Current National Surveillance System?," Journal of Occupational and Environmental Medicine, 48(4): 357―365, April 2006. | ||
| FY2012 | FY2013 | FY2014 | |
|---|---|---|---|
| Inspections | 40,9501 | 39,178 | 36,167 |
| Safety | 33,598 | 31,920 | 29,343 |
| Health | 7,352 | 7,258 | 6,824 |
| Complaints | 9,568 | 9,503 | 9,577 |
| Programmed | 23,082 | 22,170 | 19,207 |
| Construction | 22,507 | 20,430 | 18,223 |
| Maritime | 386 | 411 | 370 |
| Manu- facturing |
8,399 | 7,945 | 7,602 |
| Other | 9,654 | 10,392 | 9,972 |
| Average Case Hours/ Inspections |
|||
| Safety | 20.3 | 22.5 | 22.0 |
| Health | 34.6 | 40.1 | 45.2 |
| Violations -Total |
78,760 | 78,037 | 67,556 |
| Willfil | 424 | 316 | 433 |
| Repeat | 3,031 | 3,119 | 2,954 |
| Serious | 57,155 | 58,234 | 49,416 |
| Unclass- ified |
1 | - | 1 |
| Other | 18,038 | 16,260 | 14,597 |
| FTA | 107 | 77 | 155 |
| Penalties -Total ($) |
168,842,092 | 149,994,488 | 143,535,247 |
| Willfil | 15,053,400 | 12,484,996 | 17,474,793 |
| Repeat | 21,884,028 | 19,563,867 | 20,407,958 |
| Serious | 123,274,497 | 441,326,980 | 97,427,404 |
| Unclass- ified |
1,200 | - | 0 |
| Other | 7,829,960 | 6,855,744 | 6,500,117 |
| FTA | 797,507 | 762,901 | 1,724,976 |
| Average Penalty/ Violation ($) |
2,144 | 1,922 | 2,125 |
| Willfil | 35,503 | 39,509 | 40,358 |
| Repeat | 7,220 | 6,272 | 6,909 |
| Serious | 2,156 | 1,895 | 1,972 |
| Unclass- ified |
1,200 | - | 0 |
| Other | 434 | 422 | 445 |
| FTA | 7,453 | 9,908 | 11,129 |
| Percent Inspections with Citations Contested (%) |
11.4% | 6.0% | 6.6% |
| Source: OSHA IMIS Inspection 6 Reports, FY 2008–FY 2013, and OIS Federal Inspection Reports, FY 2012–FY 2014. | |||
Number of Federal OSHA Inspections by Industry (2-digit NAICS Code), FY 2013 and FY 2014
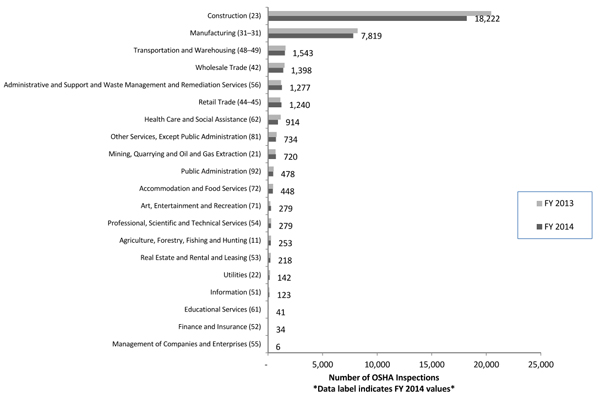
Source: Occupational Safety and Health Administration, OIS inspection report, April 3, 2015.
Number of State Plan OSHA Inspections by Industry (2-digit NAICS Code), FY 2013 and FY 2014
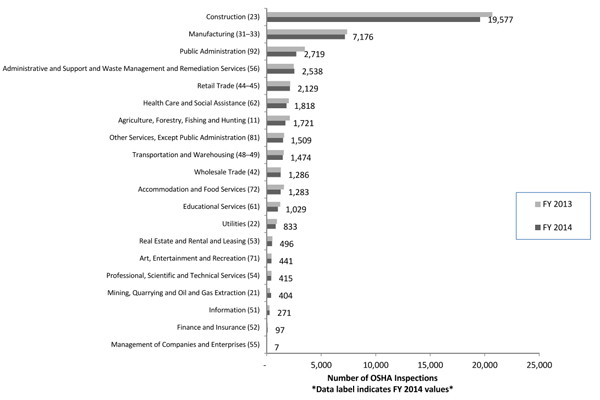
Source: Occupational Safety and Health Administration, IMIS and OIS inspection report, April 1, 2015.
Note: OSHA OIS Fatality Inspection Report for FY 2012 may include inspections that did not involve a fatality.
| Company Name |
Inspection Number(s) |
Date Citations Issued |
Total Penalty Issued |
|---|---|---|---|
| Olivet Management LLC |
945519 | 3/31/2014 | $2,359,000 |
| Republic Steel |
942971 | 3/31/2014 | $2,086,400 |
| 942968 | |||
| Republic Steel |
941037 | 3/10/2015 | $1,078,300 |
| 941464 | |||
| Republic Steel |
942545 | 3/24/2014 | $1,031,720 |
| 944135 | |||
| 943172 | |||
| Formed Fiber Technologies Inc. |
956889 | 7/15/2014 | $816,500 |
| Wire Mesh Sales LLC | 930829 | 2/12/2014 | $697,700 |
| 935663 | |||
| Custom Rubber Products |
939505 | 2/27/2014 | $560,000 |
| Behr Iron and Steel | 962510 | 9/3/2014 | $497,000 |
| Painting & Decorating Inc. | 909337 | 11/27/2014 | $460,350 |
| Fontarome Chemical Inc. | 952515 | 6/4/2014 | $449,680 |
| 9558859 | |||
| Griffin Campell/ Campbell Construction |
907267 | 6/4/2014 | $449,680 |
| 955859 | |||
| GP Roofing & Construction LLC, Archer Exteriors Inc. |
981964 | 9/23/2014 | $355,300 |
| 991274 | |||
| 966129 | |||
| 975920 | |||
| Pride Plating Inc. | 962012 | 3/21/2014 | $326,500 |
| 971831 | |||
| Sodecia North American Center Line2 |
315373126 | 3/21/2014 | $326,500 |
| Sterling Shipyard LP | 964993 | 7/11/2014 | $305,100 |
| 905493 | |||
| 954493 | |||
| 908918 | |||
| Source: Occupational Safety and Health Administration. | |||
| 1OSHA defines significant enforcement cases as those resulting in a total proposed penalty of more than $100,000. In FY 2014, 143 significant enforcement cases were brought by federal OSHA, and three significant enforcement cases against federal agencies. 2This significant case was issued in Michigan, a state with its own OSHA plan. This state may have different criteria for a significant case, but exceeds the federal threshold for a significant case. |
|||
| Company Name | Inspection Number(s) | Date Citations Issued | Total Penalty Issued | Penalty Amount Paid1 |
|---|---|---|---|---|
| BP Products North America |
311962674 | 10/29/2009 | $81,340,000 | $50,610,000 $14,567,000 $205,000 (Formal settlements) |
| 308314640 | ||||
| BP Products North America |
308314640 | 9/21/2005 | $21,361,500 | |
| 308314988 | ||||
| IMC Fertilizer/ Angus Chemical |
107607863 | 10/31/1991 | $11,550,000 | 10,000,000 |
| 107607871 | ||||
| Imperial Sugar | 310988712 | 7/25/2008 | $8,777,500 | $6,050,000 (Formal settlement) |
| 311522858 | ||||
| O&G Industries Inc. | 109179937 | 8/3/2010 | $8,347,000 | $1,000,000 (Formal settlement) |
| 314295460 | ||||
| Samsung Guam Inc. | 107329740 | 9/21/1995 | $8,260,000 | $1,829,000 (Formal settlement) |
| 10696801 | ||||
| CITGO Petroleum | 110416880 | 8/29/1991 | $8,155,000 | $5,800,000 |
| Dayton Tire | 109061648 | 4/18/1994 | $7,490,000 | $7,490,000 |
| USX (aka U.S. Steel Corp.) |
100504950 | 10/26/198911/2/1989 | $7,275,300 | $3,268,845 (Formal settlement) |
| 018252858 | ||||
| 102873288 | ||||
| Keystone Construction Maintenance |
109179952 | 8/3/2010 | $6,623,000 | $250,000* (Formal settlement) |
| 314295445 | ||||
| Phillips 66/ Fish Engineering |
106612443 | 8/3/2010 | $6,623,000 | $250,000* (Formal settlement) |
| 107365751 | ||||
| Hercules Inc. | 108662420 | 9/8/1993 | $6,328,000 | $100,000 (ALJ decision) |
| 100490705 | ||||
| Arcadian | 102281292 | 1/27/1993 | $5,085,000 | $5,085,000 |
| 102281128 | ||||
| E. Smalis Painting | 108753690 | 6/31/1994 | $5,008,500 | $1,092,750 (OSHRC decision) |
| John Morrell | 101456325 | 10/28/1988 | $4,330,000 | $990,000 (Formal settlement) |
| Bath Iron Works | 101450336 | 114/4/1987 | $4,175,940 | $650,000 (Formal settlement) |
| 101450294 | ||||
| Fraser Paper | 102749868 | 9/17/1991 | $3,982,500 | $1,286,233 (Formal settlement) |
| 102750395 | ||||
| Decoster Egg Farms (aka Maine Contract Farming LLC) |
122375512 | 7/12/1996 | $3,555,500 | $1,887,500 (Formal settlement) |
| Arco Chemical Co. | 110318540 | 1/3/1999 | $3,481,300 | $3,481,300 |
| The Budd Company | 18252510 | 12/12/1989 | $3,345,600 | $1,528,000 (Formal settlement) |
| McCrory Stores | 113919278 | 11/7/1991 | $3,188,000 | $500,000 (ALJ decision) |
| IBP | 100059591 | 5/11/1998 | $3,133,100 | $532,030 (OSHRC decision) |
| BP North America Inc. and BP Husky Refining LLC's Refinery |
311611081 | 3/8/2010 | $3,042,000 | $3,042,000 |
| Shell Oil Chemical Co. | 103342093 | 11/22/1994 | $3,017,000 | $3,017,000 |
| Union Carbide | 110398310 | 9/12/1991 | $2,803,500 | $1,496,500 (Formal settlement) |
| Source: Occupational Safety and Health Administration. | ||||
| 1Penalty amount paid information comes from March 26, 2012, posting by Celeste Monforton on the Pump Handle blog at http://scienceblogs.com/thepumphandle/2012/03/26/federal-osha- penalties-101-a-l/ and from www.osha.gov. *Settlement called for Keystone Construction Maintenance also to pay 5% of its annual revenue above a set amount for each of the seven years following the settlement. |
||||
| Fiscal Year |
Cases Received |
Cases Complet- ed1 |
Complaint Determinations | ||||||
|---|---|---|---|---|---|---|---|---|---|
| Total Merit |
Merit | Settled | Settled Other |
Dismissed | With- drawn |
Total Determ- inations |
|||
| 2005 | 1,194 | 1,160 | 264 | 23 | 224 | 47 | 760 | 146 | 1,200 |
| 2006 | 1,195 | 1,229 | 293 | 14 | 213 | 66 | 787 | 196 | 1,276 |
| 2007 | 1,301 | 1,167 | 262 | 14 | 190 | 58 | 766 | 176 | 1,204 |
| 2008 | 1,381 | 1,255 | 261 | 14 | 202 | 45 | 830 | 227 | 1,318 |
| 2009 | 1,267 | 1,167 | 287 | 22 | 210 | 55 | 726 | 187 | 1,200 |
| 2010 | 1,402 | 1,144 | 334 | 24 | 244 | 66 | 672 | 177 | 1,183 |
| 2011 | 1,668 | 1,234 | 411 | 23 | 314 | 74 | 694 | 177 | 1,282 |
| 2012 | 1,745 | 1,653 | 400 | 18 | 294 | 88 | 977 | 340 | 1,717 |
| 2013 | 1,708 | 1,827 | 611 | 41 | 367 | 201 | 921 | 415 | 1,947 |
| 2014 | 1,751 | 1,794 | 483 | 13 | 309 | 161 | 957 | 426 | 1,866 |
| Sources: For fiscal years 2009–2014, Federal OSHA, Directorate of Whistleblower Protection Programs, and for fiscal years 2005–2008, Federal OSHA Whistleblower Protection Program, "Whistleblower Investigation Data," www.whistleblowers.gov/wb_data_FY05-15.pdf. | |||||||||
| 1Cases completed include cases received and backlog cases. | |||||||||
| Fiscal Year |
Cases Received |
Cases Complet- ed1 |
Complaint Determinations | ||||||
|---|---|---|---|---|---|---|---|---|---|
| Total Merit |
Merit | Settled | Settled Other |
Dismissed | With- drawn |
Total Determ- inations |
|||
| 2009 | 1,403 | 882 | 158 | 31 | 94 | 33 | 654 | 121 | 933 |
| 2010 | 1,167 | 954 | 160 | 24 | 107 | 29 | 612 | 132 | 904 |
| 2011 | 1,462 | 839 | 168 | 24 | 125 | 19 | 626 | 135 | 929 |
| 2012 | 1,457 | 766 | 174 | 20 | 133 | 21 | 443 | 112 | 729 |
| 2013 | 1,192 | 1,059 | 248 | 58 | 139 | 51 | 655 | 215 | 1,118 |
| 2014 | 1,157 | 965 | 221 | 46 | 125 | 50 | 606 | 198 | 1,025 |
| Source: Occupational Safety and Health Administration, Directorate of Cooperative and State Programs. | |||||||||
| Hazard/ Issue |
Year Rulemaking Initiated |
Year Rulemaking Completed |
Years Elapsed Since Rulemaking Initiated |
Lives Lost Per Year of Delay |
Lives Lost Over Entire Rulemaking Period |
|---|---|---|---|---|---|
| Cranes and Derricks1 | 2002 | 2010 | 8 | 22 | 176 |
| Hexavalent Chomium2 | 1993 | 2006 | 13 | 40 to 145 | 520 to 1,885 |
| Silica3 | 1997 | Not yet completed | 18 | 688 | 12,384 |
| 1In 2002, OSHA initiated negotiated rulemaking on the cranes and derricks standard. The negotiated rulemaking committee recommended a draft rule in 2004. The proposed rule was issued in 2008 and the final rule promulgated in 2010. According to OSHA, the cranes and derricks standard also will prevent 175 injuries per year. Fatalities and injuries prevented per year by the new standard were obtained from OSHA's preamble to the final rule for cranes and derricks published in the Federal Register on Aug. 9, 2010. 2In 1993, a petition for an Emergency Temporary Standard (ETS) for the carcinogen hexavalent chromium was submitted to OSHA. In 1994, OSHA denied the ETS petition but put hexavalent chromium on the regulatory agenda for normal rulemaking. OSHA failed to issue a proposed rule. Lawsuits in 1997 and in 2002 seeking to compel rulemaking resulted in a court-ordered timetable to issue a final standard by Jan. 18, 2006. According to OSHA, the standard also will prevent 209 to 1,045 cases of dermatitis and 1,140 cases of nasal perforations/ulcerations from occurring annually. Lung cancer and silicosis deaths and illnesses avoided per year by the new standard were obtained from OSHA's preamble to the final rule published in the Federal Register on Feb. 28, 2006. 3In 1997, silica was put on OSHA's regulatory agenda. In 2003, a draft silica standard underwent a Small Business Regulatory Enforcement Fairness Act (SBREFA) review, but the rule then stalled. Work on the standard was reactivated in 2009, and on Feb. 14, 2011, the draft proposed standard was submitted to the Office of Management and Budget (OMB) for review under Executive Order 12866. OMB review of proposed rules is required to be completed within 120 days under the EO, but due to political pressure from industries opposed to the new rule, the draft proposed rule was held by OMB for two and one-half years. The proposed rule finally was issued on Sep.12, 2013. According to the preamble of the proposed rule, reducing the permissible exposure limit for silica to 50 ug/m3 will prevent 688 deaths and 1,585 cases of silica-related disease each year ( 78 FR 56277). |
|||||
| Chemical | OSHA PEL |
California PEL |
ACGIH TLV |
NIOSH REL |
Units |
|---|---|---|---|---|---|
| Acetone | 1000 | 500 | 250 | 250 | ppm |
| Acrylamide | 0.3 | 0.03 | 0.03 | 0.03 | mg/m3 |
| Ammonia | 50 | 25 | 25 | 25 | ppm |
| Asphalt Fume | - | 5 | 0.5 | 5(c)1 | mg/m3 |
| Benzene | 1 | 1 | 0.5 | 0.1 | ppm |
| Berylium | 2 | 0.2 | 0.05 | 0.5(c)1 | mg/m3 |
| Butane | - | 800 | 1,0003 | 800 | ppm |
| n-Butanol | 100 | 50(c)1 | 20 | 50(c)1 | ppm |
| Carbon disulfide2 | 20 | 1 | 1 | 1 | ppm |
| Carbon Monoxide2 | 50 | 25 | 25 | 35 | ppm |
| Chlorobenzene | 75 | 10 | 10 | 1 | ppm |
| Dimethyl sulfate2 | 1 | 0.1 | 0.1 | 0.1 | ppm |
| 2-Ethoxyethanol (EGEE) | 200 | 5 | 5 | 0.5 | pm |
| Ethyl acrylate | 25 | 5 | 5 | - | ppm |
| Gasoline | - | 300 | 300 | - | ppm |
| Glutaraldehyde2 | - | 0.05(c)1 | 0.05(c)1 | 0.2(c)1 | ppm |
| Potassium hydroxide | - | 2(c)1 | 2(c)1 | 2(c)1 | mg/m3 |
| Styrene | 100 | 50 | 20 | 50 | ppm |
| Tetrachloroethylene2
(Perchloroethylene) |
100 | 25 | 25 | - | ppm |
| Toluene2 | 200 | 10 | 20 | 100 | ppm |
| Triethylamine | 25 | 1(c)1 | 0.5 | - | ppm |
| 1Ceiling level. 2 Chemicals identified by OSHA for updates in permissible exposure limits but subsequently dropped from the agency's regulatory agenda. 3Short-term exposure limit (STEL). |
|||||
| Fiscal Year |
Budget (in dollars - $) |
Positions (Staff Full-Time Equivalent Employment) |
|---|---|---|
| 1979 | 173,034,000 | 2,886 |
| 1980 | 186,394,000 | 2,951 |
| 1981 | 210,077,000 | 2,655 |
| 1982 | 195,465,000 | 2,359 |
| 1983 | 206,649,000 | 2,284 |
| 1984 | 212,560,000 | 2,285 |
| 1985 | 219,652,000 | 2,239 |
| 1986 | 208,692,000 | 2,166 |
| 1987 | 225,811,000 | 2,211 |
| 1988 | 235,474,0002 | 2,378 |
| 1989 | 247,746,000 | 2,441 |
| 1990 | 267,147,000 | 2,425 |
| 1991 | 285,190,000 | 2,466 |
| 1992 | 296,540,000 | 2,473 |
| 1993 | 288,251,000 | 2,368 |
| 1994 | 296,428,000 | 2,295 |
| 1995 | 311,660,000 | 2,196 |
| 1996 | 303,810,000 | 2,069 |
| 1997 | 324,955,000 | 2,118 |
| 1998 | 336,480,000 | 2,171 |
| 1999 | 354,129,000 | 2,154 |
| 2000 | 381,620,000 | 2,259 |
| 2001 | 425,886,000 | 2,370 |
| 2002 | 443,651,000 | 2,313 |
| 2003 | 453,256,000 | 2,313 |
| 2004 | 457,500,000 | 2,236 |
| 2005 | 464,224,000 | 2,208 |
| 2006 | 472,427,000 | 2,165 |
| 2007 | 486,925,000 | 2,165 |
| 2008 | 486,001,000 | 2,118 |
| 2009 | 513,042,000 | 2,147 |
| 2010 | 558,620,000 | 2,335 |
| 2011 | 558,619,000 | 2,335 |
| 2012 | 564,788,000 | 2,305 |
| 20131 | 535,546,000 | 2,226 |
| 2014 | 552,247,000 | 2,238 |
| 2015 | 552,787,000 | 2,224 |
| Source: Occupational Safety and Health Administration. | ||
| 1The FY 2013 funding levels reflect budget cuts mandated by the sequester. 2Budget and personnel were increased when the California state plan turned back to federal OSHA jurisdiction. |
||
| Year | Total Number of Federal OSHA Compliance Officers1 |
Employment (000)2 |
OSHA Conpliance Officers Per Million Workers |
|---|---|---|---|
| 1975 | 1,102 | 85,846 | 12.8 |
| 1976 | 1,281 | 88,752 | 14.4 |
| 1977 | 1,353 | 92,017 | 14.7 |
| 1978 | 1,422 | 96,048 | 14.8 |
| 1979 | 1,441 | 98,824 | 14.6 |
| 1980 | 1,469 | 99,302 | 14.8 |
| 1981 | 1,287 | 100,397 | 12.8 |
| 1982 | 1,003 | 99,526 | 10.1 |
| 1983 | 1,160 | 100,834 | 11.5 |
| 1984 | 1,040 | 105,005 | 9.9 |
| 1985 | 1,027 | 107,150 | 9.6 |
| 1986 | 975 | 109,597 | 9 |
| 1987 | 999 | 112,440 | 8.9 |
| 1988 | 1,153 | 114,968 | 10 |
| 1989 | 1,038 | 117,342 | 8.8 |
| 1990 | 1,203 | 118,793 | 10.1 |
| 1991 | 1,137 | 117,718 | 9.7 |
| 1992 | 1,106 | 118,492 | 9.3 |
| 1993 | 1,055 | 120,259 | 8.8 |
| 1994 | 1,006 | 123,060 | 8.2 |
| 1995 | 986 | 124,900 | 7.9 |
| 1996 | 932 | 126,708 | 7.4 |
| 1997 | 1,049 | 129,558 | 8.1 |
| 1998 | 1,029 | 131,463 | 7.8 |
| 1999 | 1,013 | 133,488 | 7.6 |
| 2000 | 972 | 136,891 | 7.1 |
| 2001 | 1,001 | 136,933 | 7.3 |
| 2002 | 1,017 | 136,485 | 7.5 |
| 2003 | 1,038 | 137,736 | 7.5 |
| 2004 | 1,006 | 139,252 | 7.2 |
| 2005 | 956 | 141,730 | 6.7 |
| 2006 | 948 | 144,427 | 6.6 |
| 2007 | 948 | 146,047 | 6.5 |
| 2008 | 936 | 145,362 | 6.4 |
| 2009 | 929 | 139,877 | 6.6 |
| 2010 | 1,016 | 139,064 | 7.3 |
| 2011 | 1,059 | 139,869 | 7.6 |
| 2012 | 1,006 | 142,469 | 7.1 |
| 2013 | 994 | 143,929 | 6.9 |
| 2014 | 986 | 146,305 | 6.7 |
| 1Compliance officers for 1973 to 1989 from Twentieth Century OSHA Enforcement Data, A Review and Explanation of the Major Trends, U.S. Department of Labor, 2002; Compliance officers for 1990 to 2014 from OSHA Directorate of Enforcement Programs. Compliance officer totals include safety and industrial hygiene CSHOs and supervisory safety and industrial hygiene CSHOs. 2Employment is an annual average of employed civilians, 16 years of age and older, from the Current Population Survey (CPS). |
|||
Federal OSHA Compliance Officers Per Million U.S. Workers, 1974–20141
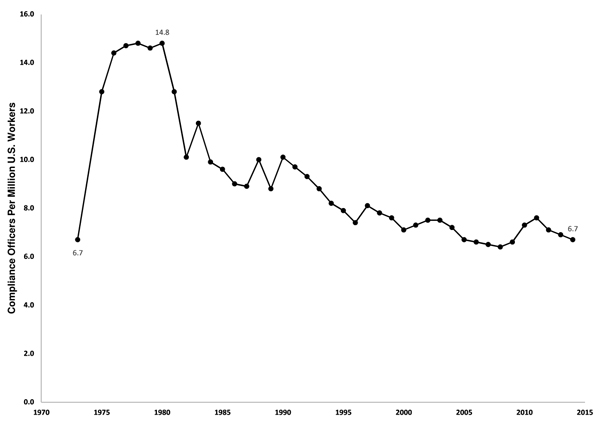
1Compliance officers from U.S. Department of Labor and OSHA Directorate of Enforcement Programs includes CSHOs and their supervisors. Employment data from Current Population Survey.
| CATEGORY | FY 2006 | FY 2007 | FY 2008 | FY 2009 | FY 2010 | FY 2011 |
| OSHA (in thousands of dollars) |
||||||
| TOTAL | 472,427 | 486,925 | 486.001 | 513.0424 | 558.62 | 558.619 |
| Safety and Health Standards |
16.462 | 16.892 | 16.597 | 17.204 | 19.569 | 20.288 |
| Federal Enforcement |
172.575 | 176.973 | 182.136 | 197.946 | 223.399 | 208.146 |
| Whistleblower Protection |
14.806 | |||||
| State Enforcement |
91.093 | 91.093 | 89.502 | 92.593 | 104.393 | 104.393 |
| Technical Support |
21.435 | 22.392 | 21.681 | 22.632 | 25.92 | 25.868 |
| Federal Compliance Assistance |
72.545 | 72.659 | 71.39 | 72.659 | 73.38 | 73.383 |
| State Compliance Assistance |
53.357 | 53.357 | 52.425 | 54.531 | 54.798 | 54.688 |
| Training Grants |
10.116 | 10.116 | 9.939 | 10 | 10.75 | 10.729 |
| Safety and Health Statistics |
24.253 | 32.274 | 31.522 | 34.128 | 34.875 | 34.805 |
Executive |
10.591 | 11.169 | 10.809 | 11.349 | 11.536 | 11.513 |
| MSHA (in thousands of dollars) | ||||||
| TOTAL | 303.286 | 301.57 | 333.925 | 347.003 | 357.293 | 361.8445 |
| Coal Enforcement |
117.152 | 120.396 | 154.67 | 154.491 | 158.662 | 160.639 |
| Supplemental (emergency) |
25.6 | |||||
| Metal/Nonmetal Enforcement |
68.062 | 72.506 | 71.42 | 82.427 | 85.422 | 87.644 |
| Standards Development |
2.481 | 2.727 | 3.18 | 3.031 | 3.481 | 4.352 |
| Assessments | 5.391 | 6.556 | 6.134 | 6.134 | 6.233 | 6.221 |
| Education Policy and Development |
31.701 | 35.326 | 36.605 | 38.605 | 38.605 | 38.148 |
| Technical Support |
25.479 | 29.237 | 29.476 | 30.117 | 30.642 | 31.031 |
| Program Administration |
11.906 | 13.637 | 16.504 | 15.684 | 17.391 | 15.906 |
| Program Eval. and Info Resources |
15.514 | 21.185 | 15.936 | 16.514 | 16.857 | 18.173 |
| NIOSH (in thousands of dollars) |
||||||
| TOTAL | 254.4011 | 252.1 | 381.955 | 360.059 | 373.171 | 316.079 |
| Program Funding |
273.8632 | 290.0593 | 302.4483 | 294.0793 | ||
| WTC Health Funding |
108,092 | 70,000 | 70,723 | 22,0006 |
| CATEGORY | FY 2012 | FY 20137 | FY 2014 | FY 2015 Request | FY 2015 | FY 2016 Request |
| OSHA (in thousands of dollars) |
||||||
| TOTAL | 564,788 | 535,246 | 552,247 | 565,010 | 552,787 | 592,071 |
| Safety and Health Standards |
19,962 | 18,918 | 20,000 | 20,292 | 20,000 | 23,306 |
| Federal Enforcement |
207,753 | 207,928 | 207,785 | 210,838 | 208,000 | 225,608 |
| Whistleblower Protection |
15,873 | 15,043 | 17,000 | 21,253 | 17,500 | 22,628 |
| State Enforcement |
104,196 | 98,746 | 100,000 | 103,987 | 100,850 | 104,337 |
| Technical Support |
25,820 | 24,344 | 24,344 | 24,224 | 24,469 | 24,614 |
| Federal Compliance Assistance |
76,355 | 61,444 | 69,433 | 70,380 | 68,433 | 73,044 |
| State Compliance Assistance |
57,890 | 54,862 | 57,775 | 57,775 | 57,775 | 57,775 |
| Training Grants |
10,709 | 10,149 | 10,687 | 10,687 | 10,537 | 10,687 |
| Safety and Health Statistics |
34,739 | 32,922 | 34,250 | 34,488 | 34,250 | 38,763 |
| Executive Administration/ Direction |
11,491 | 10,89 | 10,973 | 11,086 | 10,973 | 11,309 |
| MSHA (in thousands of dollars) |
||||||
| TOTAL | 372,524 | 353,768 | 375,887 | 377,234 | 375,887 | 394,932 |
| Coal Enforcement |
164,500 | 158,713 | 167,859 | 169,693 | 167,859 | 175,769 |
| Supplemental (emergency) |
||||||
| Metal/Nonmetal Enforcement |
89,063 | 86,121 | 91,697 | 92,634 | 91,697 | 93,841 |
| Standards Development |
4,765 | 4,547 | 5,416 | 6,070 | 5,416 | 6,070 |
| Assessments | 7,103 | 7,036 | 6,976 | 8,043 | 6,976 | 8,122 |
| Education Policy and Development |
38.325 | 31.898 | 36,320 | 30,923 | 36,320 | 40,448 |
| Technical Support |
33,613 | 32,050 | 33,791 | 34,252 | 33,791 | 34,583 |
| Program Administration |
16,998 | 15,974 | 15,838 | 16,026 | 15,838 | 16,316 |
| Program Eval. and Info Resources |
18,157 | 17,429 | 17,990 | 19.593 | 17,990 | 19,783 |
| NIOSH (in thousands of dollars) |
||||||
| TOTAL | 292,588 | 323,059 | 332,86 | 280,598 | 334,8638 | 283,4188 |
| Program Funding |
292.5883 | 323.0593 | 332.863 | 280.593 | 334,8633 | 283,418 |
| WTC Health Funding |
N/A6 | N/A6 | N/A6 | N/A6 | N/A6 | N/A6 |
| Sources: Budget of the U.S. Government, FY 2006–FY 2016, and U.S. Department of Labor Congressional Budget Justification, FY 2006–FY 2016. | ||||||
| 1 $34.8 million transferred to business services. TAP for administrative services eliminated. Direct comparison with NIOSH funding for earlier years, which included this funding, cannot be made. 2 Includes $50 million for mine safety research, adjusted to $49.126 million after the recission. 3 Does not include $55 million for the Energy Employees Occupational Injury Compensation Program funding through mandatory funding. 4Does not include $7 million in Recovery Act provided to OSHA in FY 2009 and FY 2010. 5Includes $6.5 million for addressing the backlog of contested cases, of which up to $3 million may be transferred to the DOL's Office of Solicitor. 6 With enactment of the 9/11 Health and Compensation Act, as of July 2011, the WTC health program will be funded through mandatory funding so appropriated funding is not needed after that date. 7The FY 2013 funding levels reflect the budget cuts mandated by the budget sequester. 8 FY 2015 and FY 2016 NIOSH budget request and FY 2015 appropriation includes administrative funding previously allocated to the CDC budget. The FY 2013 and FY 2014 NIOSH funding levels have been made comparable to reflect this reallignment of administrative funding. |
||||||
| Fiscal Year |
Worker Safety and Health Training |
Employer Compliance Assistance (Federal and State) |
|---|---|---|
| FY 2001 Enacted | $11,175 | $105,100 |
| FY 2002 Request | $8,175 | $106,000 |
| FY 2002 Enacted | $11,175 | $109,800 |
| FY 2003 Request | $4,000 | $112,800 |
| FY 2003 Enacted | $11,175 | $115,300 |
| FY 2004 Request | $4,000 | $120,000 |
| FY 2004 Enacted | $11,100 | $120,000 |
| FY 2004 Rescission | $10,500 | $119,200 |
| FY 2005 Request | $4,000 | $125,200 |
| FY 2005 Enacted | $10,500 | $124,200 |
| FY 2006 Request | $0 | $124,200 |
| FY 2006 Enacted | $10,100 | $125,900 |
| FY 2007 Request | $0 | $129,900 |
| FY 2007 Enacted | $10,100 | $126,000 |
| FY 2008 Request | $0 | $134,100 |
| FY 2008 Enacted | $9,900 | $123,800 |
| FY 2009 Request | $0 | $131,100 |
| FY 2009 Enacted | $10,000 | $127,200 |
| FY 2010 Request | $10,000 | $128,175 |
| FY 2010 Enacted | $10,750 | $128,200 |
| FY 2011 Request | $11,000 | $126,100 |
| FY 2011 Enacted | $10,729 | $128,200 |
| FY 2012 Request | $12,000 | $129,800 |
| FY 2012 Enacted | $10,700 | $134,200 |
| FY 2013 Request | $10,700 | $131,000 |
| FY 2013 Enacted1 | $10,150 | $116,300 |
| FY 2014 Request | $10,700 | $133,200 |
| FY 2014 Enacted | $10,700 | $127,200 |
| FY 2015 Request | $10,700 | $128,200 |
| FY 2015 Enacted | $10,500 | $126,200 |
| FY 2016 Request | $10,700 | $130,800 |
| Sources: Department of Labor, Occupational Safety and Health Administration, Congressional Budget Justification, FY 2002─FY 2016. | ||
| 1FY 2013 funding levels reflect the budget cuts mandated by the sequester. | ||
| Fiscal Year |
Annual Average Employment1 |
Annual Average Establishments1 |
OSHA Full-Time Equivalent (FTE) Staff2 |
Employees Covered Per OSHA FTE |
Establishements Covered Per OSHA FTE |
|---|---|---|---|---|---|
| 1975 | 67,801,400 | 3,947,740 | 2,435 | 27,845 | 1,621 |
| 1980 | 73,395,500 | 4,544,800 | 2,951 | 24,871 | 1,540 |
| 1985 | 96,314,200 | 5,305,400 | 2,239 | 43,017 | 2,370 |
| 1990 | 108,657,200 | 6,076,400 | 2,425 | 44,807 | 2,506 |
| 1995 | 115,487,841 | 7,040,677 | 2,196 | 52,590 | 3,206 |
| 2000 | 127,877,063 | 7,879,116 | 2,259 | 57,493 | 3,488 |
| 2005 | 131,571,623 | 8,571,144 | 2,208 | 59,589 | 3,882 |
| 2006 | 133,833,834 | 8,784,027 | 2,165 | 61,817 | 4,057 |
| 2007 | 135,366,106 | 8,971,897 | 2,165 | 62,525 | 4,144 |
| 2008 | 134,805,659 | 9,082,049 | 2,118 | 63,648 | 4,288 |
| 2009 | 128,607,842 | 9,003,197 | 2,147 | 59,901 | 4,193 |
| 2010 | 127,820,442 | 8,993,109 | 2,335 | 54,741 | 3,851 |
| 2011 | 129,411,095 | 9,072,796 | 2,335 | 55,422 | 3,886 |
| 2012 | 131,696,378 | 9,121,868 | 2,305 | 57,135 | 3,957 |
| 2013 | 133,968,434 | 9,205,888 | 2,226 | 60,183 | 4,136 |
| 1U.S. Department of Labor, Bureau of Labor Statistics, Employment and Wages, Annual Averages (Total Covered). 2U.S. Department of Labor, Occupational Safety and Health Administration (OSHA) |
|||||
8.0 Million State and Local Employees Lacked OSHA Coverage in 2013
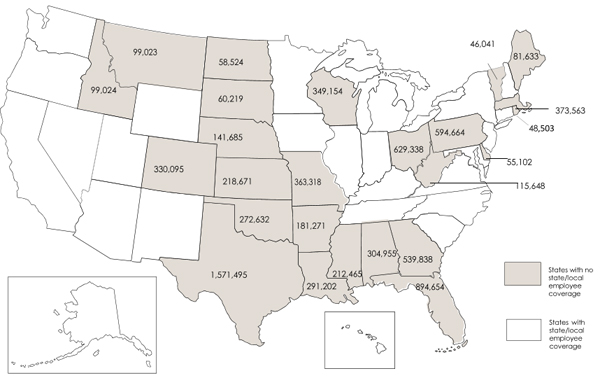
Prepared by the AFL-CIO
Source: U.S. Department of Labor, Bureau of Labor Statistics,
Employment and Wages: Annual Averages, 2013.
| 2005 | 2006 | 2007 | 2008 | 2009 | |
|---|---|---|---|---|---|
| No. of coal mines | 2,063 | 2,113 | 2,030 | 2,129 | 2,076 |
| No. of miners | 116,436 | 122,975 | 122,936 | 133,828 | 134,089 |
| Fatalities | 23 | 47 | 34 | 30 | 18 |
| Fatal Injury rate1 | 0.0205 | 0.0400 | 0.0293 | 0.0237 | 0.0148 |
| All injury rate1 | 4.62 | 4.46 | 4.21 | 3.89 | 3.69 |
| States with coal mining | 26 | 26 | 26 | 26 | 26 |
| Coal production (millions of tons) | 1,133 | 1,163 | 1,147 | 1,172 | 1,075 |
| Citations and orders issued2 | 69,026 | 77,667 | 84,184 | 106,871 | 102,057 |
| 2010 | 2011 | 2012 | 2013 | |
|---|---|---|---|---|
| No. of coal mines | 1,944 | 1,973 | 1,871 | 1,701 |
| No. of miners | 135,500 | 143,437 | 137 | 123,259 |
| Fatalities | 48 | 21 | 20 | 20 |
| Fatal Injury rate1 | 0.0384 | 0.0156 | 0.0159 | 0.0176 |
| All injury rate1 | 3.43 | 3.38 | 3.16 | 3.11 |
| States with coal mining | 26 | 26 | 26 | 26 |
| Coal production (millions of tons) | 1,086 | 1,095 | 1,018 | 984 |
| Citations and orders issued2 | 96,814 | 93,630 | 79,250 | 63,493 |
| 2005 | 2006 | 2007 | 2008 | 2009 | |
|---|---|---|---|---|---|
| No. of metal/nonmetal mines | 12,603 | 12,772 | 12,841 | 12,778 | 12,555 |
| No. of miners | 228,401 | 240,522 | 255,187 | 258,918 | 221,631 |
| Fatalities | 35 | 26 | 33 | 23 | 17 |
| Fatal injury rate1 | 0.0170 | 0.0122 | 0.0149 | 0.0107 | 0.0098 |
| All injury rate1 | 3.54 | 3.19 | 3.02 | 2.87 | 2.54 |
| States with M/NM mining | 50 | 50 | 50 | 50 | 50 |
| Citations and orders issued2 | 58,740 | 62,415 | 59,941 | 66,785 | 71,361 |
| 2010 | 2011 | 2012 | 2013 | |
|---|---|---|---|---|
| No. of metal/nonmetal mines | 12,339 | 12,230 | 12,222 | 12,060 |
| No. of miners | 225,676 | 237,772 | 250,228 | 251,263 |
| Fatalities | 23 | 16 | 16 | 21 |
| Fatal injury rate1 | 0.0129 | 0.0084 | 0.0079 | 0.0103 |
| All injury rate1 | 2.37 | 2.28 | 2.19 | 2.11 |
| States with M/NM mining | 50 | 50 | 50 | 50 |
| Citations and orders issued2 | 74,095 | 63,983 | 60,520 | 55,126 |
| Source: U.S. Department of Labor, Mine Safety and Health Administration (MSHA). | ||||
| 1All reported injuries per 200,000 employee hours. 2Citations and orders are those not vacated. |
||||
Comparison of Year-to-Date and Total Fatalities for Metal/Nonmetal and Coal Mining 2002–2014
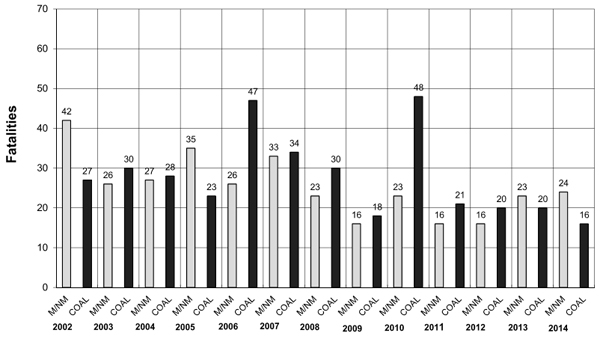
Source: U.S. Department of Labor, Mine Safety and Health Administration (MSHA).
| State | 2008 | 2009 | 2010 | 2011 | 2012 | 2013 | 2014 |
| AL | 2 | 3 | 2 | 3 | 1 | 1 | |
| AK | |||||||
| AZ | 1 | ||||||
| AR | |||||||
| CA | |||||||
| CO | 1 | 1 | |||||
| CT | |||||||
| DE | |||||||
| FL | |||||||
| GA | |||||||
| HI | |||||||
| ID | |||||||
| IL | 1 | 2 | 2 | 1 | 4 | 1 | |
| IN | 1 | 1 | 1 | 1 | 1 | ||
| IA | |||||||
| KS | |||||||
| KY | 8 | 6 | 7 | 8 | 4 | 2 | 2 |
| LA | 1 | ||||||
| ME | |||||||
| MD | |||||||
| MA | |||||||
| MI | |||||||
| MN | |||||||
| MS | |||||||
| MO | |||||||
| MT | 1 | 1 | |||||
| NE | |||||||
| NV | |||||||
| NH | |||||||
| NJ | |||||||
| NM | 1 | ||||||
| NY | |||||||
| NC | |||||||
| ND | |||||||
| OH | 2 | 1 | 1 | ||||
| OK | |||||||
| OR | |||||||
| PA | 5 | 1 | 2 | ||||
| P.R. | |||||||
| RI | |||||||
| SC | |||||||
| SD | |||||||
| TN | 1 | 1 | |||||
| TX | 1 | ||||||
| UT | 1 | 1 | |||||
| VT | |||||||
| VA | 2 | 1 | 1 | 1 | 2 | ||
| WA | |||||||
| WV | 9 | 3 | 35 | 6 | 7 | 6 | 5 |
| WI | |||||||
| WY | 1 | 1 | 2 | 2 | |||
| Total | 30 | 18 | 48 | 21 | 20 | 20 | 16 |
| Source: U.S. Department of Labor, Mine Safety and Health Administration (MSHA). | |||||||
| State | 2008 | 2009 | 2010 | 2011 | 2012 | 2013 | 2014 |
| AL | 1 | 1 | |||||
| AK | 2 | 1 | |||||
| AZ | 2 | 1 | 2 | 1 | |||
| AR | 1 | ||||||
| CA | 2 | 1 | 2 | 1 | 2 | ||
| CO | 2 | ||||||
| CT | |||||||
| DE | |||||||
| FL | 1 | 1 | 2 | 2 | 1 | ||
| GA | 1 | 1 | 1 | 1 | |||
| HI | |||||||
| ID | 1 | 2 | 1 | ||||
| IL | |||||||
| IN | 1 | ||||||
| IA | 2 | 1 | 1 | 1 | |||
| KS | 1 | 2 | 1 | 1 | |||
| KY | 1 | 2 | 1 | 4 | 1 | ||
| LA | 1 | 1 | 1 | ||||
| ME | |||||||
| MD | 1 | 1 | |||||
| MA | |||||||
| MI | 1 | ||||||
| MN | 1 | 2 | |||||
| MS | |||||||
| MO | 2 | 2 | 2 | 2 | |||
| MT | 1 | 2 | 1 | ||||
| NE | 1 | ||||||
| NV | 3 | 1 | 2 | 1 | 1 | 2 | 2 |
| NH | |||||||
| NJ | 1 | ||||||
| NM | 1 | 1 | 1 | ||||
| NY | 1 | 1 | 1 | 3 | 2 | ||
| NC | |||||||
| ND | |||||||
| OH | 1 | 1 | |||||
| OK | 3 | 1 | |||||
| OR | |||||||
| PA | 2 | 1 | 1 | 1 | 2 | ||
| P.R. | 1 | ||||||
| RI | |||||||
| SC | 2 | ||||||
| SD | |||||||
| TN | 1 | 1 | 1 | ||||
| TX | 3 | 2 | 2 | 5 | |||
| UT | 1 | 1 | 1 | 2 | |||
| VT | |||||||
| VA | 2 | ||||||
| WA | 1 | 1 | |||||
| WV | |||||||
| WI | 1 | ||||||
| WY | |||||||
| Total | 23 | 17 | 23 | 16 | 16 | 22 | 28 |
| Source: U.S. Department of Labor, Mine Safety and Health Administration (MSHA). | |||||||
Coal |
|||||||
| JAN | FEB | MAR | APR | MAY | JUN | JUL | |
|---|---|---|---|---|---|---|---|
| Number of Impact Inspect- ions |
11 | 9 | 10 | 12 | 10 | 11 | 15 |
| Total# Citations Issued |
146 | 144 | 125 | 89 | 129 | 121 | 126 |
| #Orders Issued2 |
10 | 5 | 13 | 1 | 4 | 14 | 5 |
| #S&S Citations Issued3 |
55 | 66 | 67 | 30 | 47 | 66 | 54 |
| %S&S Citations |
35.71 % |
44.30 % |
48.55 % |
33.33 % |
35.34 % |
48.89 % |
41.22 % |
| AUG | SEPT | OCT | NOV | DEC | Year Totals |
|
|---|---|---|---|---|---|---|
| Number of Impact Inspect- ions |
12 | 9 | 12 | 10 | 10 | 131 |
| Total# Citations Issued |
131 | 111 | 127 | 91 | 58 | 1,398 |
| #Orders Issued2 |
11 | 2 | 6 | 9 | 4 | 84 |
| #S&S Citations Issued3 |
66 | 36 | 65 | 25 | 19 | 596 |
| %S&S Citations |
46.81 % |
31.86 % |
48.87 % |
25.00 % |
30.65 % |
40.30 % |
Metal/Nonmetal |
|||||||
| JAN | FEB | MAR | APR | MAY | JUN | JUL | |
|---|---|---|---|---|---|---|---|
| Number of Impact Inspect- ions |
3 | 3 | 3 | 4 | 2 | 2 | 18 |
| Total# Citations Issued |
52 | 66 | 27 | 58 | 43 | 65 | 64 |
| #Orders Issued |
1 | 3 | 1 | 14 | 17 | 11 | 3 |
| #S&S Citations Issued |
17 | 18 | 9 | 23 | 27 | 20 | 40 |
| %S&S Citations |
34.78 % |
26.09 % |
32.14 % |
31.94 % |
45.00 % |
26.32 % |
59.70 % |
| AUG | SEPT | OCT | NOV | DEC | Year Totals |
|
|---|---|---|---|---|---|---|
| Number of Impact Inspect- ions |
-- | 4 | -- | 6 | 2 | 50 |
| Total# Citations Issued |
-- | 81 | -- | 106 | 59 | 621 |
| #Orders Issued |
-- | 3 | -- | 8 | 0 | 61 |
| #S&S Citations Issued |
-- | 34 | -- | 38 | 22 | 248 |
| %S&S Citations |
-- | 40.48 % |
-- | 34.23 % |
37.29 % |
36.50 % |
| Source: Mine Safety and Health Administration (MSHA). | ||||||
| 1Impact inspections were initiated after the April 2010 explosion at the Upper Big Branch Mine. The inspections are conducted at mines with a poor compliance history with MSHA standards, high numbers of injuries, illnesses or fatalities, and other indicators of unsafe mines. 2MSHA can issue orders to mine operators that require them to withdraw miners from affected areas of the mine for failure to abate violations, for "unwarrantable failure" (reckless disregard, intentional misconduct) to correct significant and substantial violations, and where imminent danger exists. Miners remain withdrawn from the affected area until the violation(s) are abated. 3A Significant and Substantial (S&S) citation is a violation of a mandatory MSHA standard in which the hazard resulting from the violation has a reasonable likelihood of resulting in an injury of a reasonably serious nature. |
||||||
| Calendar Year |
Discrimination Complaints Filed1 |
Temporary Reinstatements Filed2 |
|---|---|---|
| 2003 | 8 | 1 |
| 2004 | 14 | 9 |
| 2005 | 26 | 6 |
| 2006 | 13 | 4 |
| 2007 | 12 | 7 |
| 2008 | 9 | 3 |
| 2009 | 12 | 17 |
| 2010 | 31 | 16 |
| 2011 | 25 | 22 |
| 2012 | 35 | 47 |
| 2013 | 45 | 26 |
| 2014 | 49 | 45 |
| Source: Mine Safety and Health Administration. | ||
| 1Under Section 105(c)(2) of the Federal Mine Safety and Health Act, any miner who believes he or she has been discharged, interfered with or discriminated against for exercising his or her rights under the act may file a discrimination complaint. 2If the Mine Safety and Health Administration (MSHA) finds that a miner's discrimination complaint is "not frivolously brought," MSHA will ask the Federal Mine Safety and Health Review Commission to order immediate reinstatement of the miner while the discrimination case is pending. |
||
STATE COMPARISONS
Years Needed for OSHA to Inspect All Jobsites
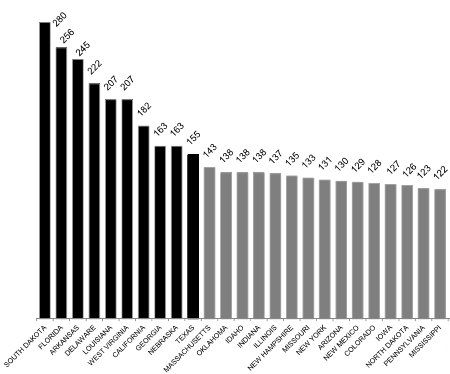
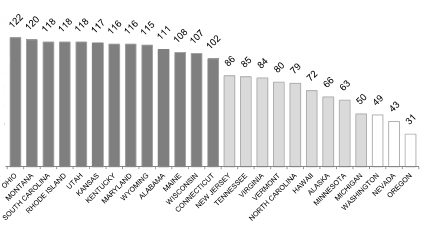
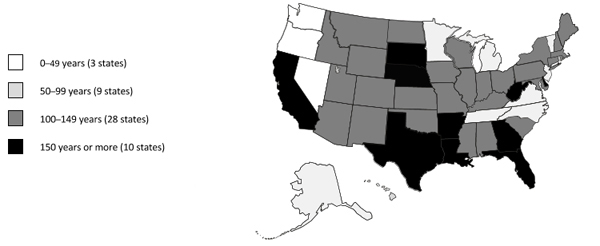
Prepared by the AFL-CIO.
Sources: U.S. Department of Labor, Bureau of Labor Statistics, "Employment and Wages Annual Averages," and Occupational Safety and Health Administration IMIS and OIS data on worksite inspections, FY 2014.
| State | Number of Employees2 |
Actual Number of OSHA Inspectors3 |
Number of Labor Inspectors Needed to Meet ILO Benchmark4 |
Ratio of OSHA Inspectors/ Number of Employees |
|---|---|---|---|---|
| AL | 1,845,086 | 25 | 185 | 1/73,803 |
| AK | 328.716 | 12 | 33 | 1/27,393 |
| AZ | 2,488,009 | 25 | 249 | 1/99,520 |
| AR | 1,146,274 | 9 | 115 | 1/127,364 |
| CA | 15,378,962 | 196 | 1.538 | 1/78,464 |
| CO | 2,335,803 | 26 | 234 | 1/89,839 |
| CT | 1,640,333 | 24 | 164 | 1/68,347 |
| DE | 413.825 | 4 | 41 | 1/103,456 |
| FL | 7,518,448 | 60 | 752 | 1/125,307 |
| GA | 3,918,085 | 45 | 392 | 1/87,069 |
| HI | 618.195 | 18 | 62 | 1/34,344 |
| ID | 630.328 | 9 | 63 | 1/70,036 |
| IL | 5,687,541 | 72 | 569 | 1/78,994 |
| IN | 2,849,311 | 40 | 285 | 1/71,233 |
| IA | 1,496,426 | 19 | 150 | 1/78,759 |
| KS | 1,336,948 | 32 | 134 | 1/41,780 |
| KY | 1,779,777 | 39 | 178 | 1/45,635 |
| LA | 1,893,823 | 15 | 189 | 1/126,255 |
| ME | 586.525 | 7 | 59 | 1/83,789 |
| MD | 2,531,656 | 55 | 253 | 1/46,030 |
| MA | 3,295,647 | 28 | 330 | 1/117,702 |
| MI | 4,018,602 | 62 | 402 | 1/64,816 |
| MN | 2,691,832 | 44 | 269 | 1/61,178 |
| MS | 1,093,581 | 12 | 109 | 1/91,132 |
| MO | 2,637,273 | 14 | 264 | 1/188,377 |
| MT | 436,867 | 5 | 44 | 1/87,373 |
| NE | 932,768 | 9 | 93 | 1/103,641 |
| NV | 1,160,115 | 44 | 116 | 1/26,366 |
| NH | 618,781 | 8 | 62 | 1/77,348 |
| NJ | 3,812,940 | 59 | 381 | 1/64,626 |
| NM | 791,804 | 8 | 79 | 1/98,976 |
| NY | 8,685,758 | 100 | 869 | 1/86,858 |
| NC | 3,974,937 | 96 | 397 | 1/41,406 |
| ND | 427,108 | 8 | 43 | 1/53,389 |
| OH | 5,110,011 | 59 | 511 | 1/86,610 |
| OK | 1,560,799 | 18 | 156 | 1/86,711 |
| OR | 1,678,726 | 72 | 168 | 1/23,316 |
| PA | 5,596,841 | 56 | 560 | 1/99,944 |
| RI | 456,112 | 6 | 46 | 1/76,019 |
| SC | 1,846,621 | 22 | 185 | 1/83,937 |
| SD | 404,652 | N/A | 40 | N/A |
| TN | 2,694,288 | 34 | 269 | 1/79,244 |
| TX | 11,031,907 | 100 | 1.103 | 1/110,319 |
| UT | 1,254,582 | 19 | 125 | 1/66,031 |
| VT | 301,586 | 8 | 30 | 1/37,698 |
| VA | 3,640,209 | 51 | 364 | 1/71,377 |
| WA | 2,960,123 | 110 | 296 | 1/26,910 |
| WV | 703,916 | 6 | 70 | 1/117,319 |
| WI | 2,721,960 | 36 | 272 | 1/75,610 |
| WY | 279,748 | 9 | 28 | 1/31,083 |
| Total5 | 134,929,583 | 1,882 | 13,493 | 1/71,695 |
| 1The ILO benchmark for labor inspectors is one inspector per 10,000 workers in industrial market economies. 2U.S. Department of Labor, Bureau of Labor Statistics, Employment and Wages, Annual Averages 2013. 3From OSHA records for FY 2015. Includes only safety and industrial hygiene Compliance Safety and Health Officers (CSHOs) who conduct workplace inspections and does not include supervisory CSHOs. Federal CSHOs provided by OSHA's Directorate of Enforcement Programs, CSHO Count By Area Office as of Feb.10, 2015. State plan CSHOs provided by OSHA's Directorate of Cooperative and State Programs and includes "on board" safety and health CSHOs from the FY 2015 State Plan Grant Applications. The number of "on board" CSHOs may not accurately reflect the true number of CSHOs actually hired and conducting enforcement inspections due to possible budgetary reasons in any particular state. Total number of inspectors includes 47 inspectors in Puerto Rico and the Virgin Islands. 4International Labor Office. Strategies and Practice for Labor Inspection. G.B.297/ESP/3. Geneva, November 2006. 5Total number includes employees from the District of Columbia, Puerto Rico and the Virgin Islands |
||||
| Fatalities1 | Inuries/Illnesses 20132 | Penalties FY 20143 | |||||
|---|---|---|---|---|---|---|---|
| State | Number | Rate | Rank6 | Number | Rate | Average($) | Rank7 |
| AL | 78 | 4 | 31 | 42,000 | 3.3 | 2,016 | 18 |
| AK | 32 | 7.9 | 47 | 9,100 | 4.3 | 823 | 43 |
| AZ | 95 | 3.5 | 27 | 59,100 | 3.3 | 935 | 38 |
| AR | 63 | 5.6 | 41 | 24,800 | 3 | 2,329 | 5 |
| CA | 396 | 2.4 | 9 | 360,500 | 3.5 | 5,733 | 1 |
| CO | 65 | 2.7 | 14 | N/A | N/A | 1,564 | 33 |
| CT | 29 | 1.8 | 3 | 43,200 | 3.8 | 1,794 | 29 |
| DE | 11 | 2.6 | 11 | 7,900 | 2.7 | 1,985 | 20 |
| FL | 239 | 2.8 | 16 | N/A | N/A | 2,181 | 11 |
| GA | 117 | 2.8 | 16 | 77,500 | 2.8 | 2,127 | 14 |
| HI | 11 | 1.6 | 1 | 13,500 | 3.7 | 1,279 | 34 |
| ID | 30 | 4.3 | 34 | N/A | N/A | 1,639 | 32 |
| IL | 176 | 3.1 | 22 | 125,100 | 3.2 | 1,98 | 21 |
| IN | 127 | 4.4 | 36 | 71,900 | 3.6 | 957 | 37 |
| IA | 72 | 4.7 | 38 | 47,100 | 4.5 | 901 | 39 |
| KS | 55 | 4.2 | 33 | 31,700 | 3.5 | 2,017 | 17 |
| KY | 86 | 4.7 | 38 | 48,700 | 4 | 2,828 | 2 |
| LA | 114 | 6.3 | 45 | 30,000 | 2.2 | 2,201 | 9 |
| ME | 19 | 3.1 | 22 | 20,100 | 5.3 | 2,013 | 19 |
| MD | 79 | 2.7 | 14 | 51,500 | 3 | 746 | 45 |
| MA | 57 | 1.8 | 3 | 66,500 | 2.9 | 2,104 | 16 |
| MI | 135 | 3.3 | 26 | 100,300 | 3.7 | 585 | 48 |
| MN | 69 | 2.6 | 11 | 68,500 | 3.7 | 752 | 44 |
| MS | 68 | 6.2 | 44 | N/A | N/A | 1,726 | 30 |
| MO | 118 | 4.3 | 34 | 58,300 | 3.2 | 1,877 | 27 |
| MT | 28 | 5.8 | 42 | 13,000 | 4.7 | 1,938 | 22 |
| NE | 39 | 4 | 31 | 24,700 | 3.8 | 2,569 | 4 |
| NV | 42 | 3 | 20 | 32,700 | 4 | 2,244 | 8 |
| NH | 14 | 2.1 | 5 | N/A | N/A | 2,113 | 15 |
| NJ | 102 | 2.6 | 11 | 78,000 | 2.9 | 2,176 | 12 |
| NM | 54 | 6.7 | 46 | 16,800 | 3.2 | 879 | 42 |
| NY | 178 | 2.1 | 5 | 143,400 | 2.4 | 1,907 | 24 |
| NC | 109 | 2.5 | 10 | 71,500 | 2.7 | 1,25 | 35 |
| ND | 56 | 14.9 | 50 | N/A | N/A | 2,659 | 3 |
| OH | 149 | 3.0 | 20 | 106,700 | 2.9 | 2,299 | 7 |
| OK | 92 | 5.8 | 42 | N/A | M/A | 1,880 | 26 |
| OR | 49 | 2.9 | 18 | 45,200 | 4.1 | 364 | 50 |
| PA | 183 | 3.2 | 24 | 156.600 | 3.9 | 1,796 | 28 |
| RI | 10 | 2.1 | 5 | N/A | N/A | 1,895 | 25 |
| SC | 75 | 3.9 | 30 | 35,300 | 2.9 | 521 | 49 |
| SD | 20 | 4.7 | 38 | N/A | N/A | 2,309 | 6 |
| TN | 95 | 3.6 | 29 | 62,900 | 3.3 | 687 | 46 |
| TX | 508 | 4.4 | 36 | 198,800 | 2.6 | 2,154 | 13 |
| UT | 37 | 2.9 | 18 | 27,500 | 3.4 | 1,173 | 36 |
| VT | 7 | 2.2 | 8 | 10,300 | 5.2 | 889 | 41 |
| VA | 128 | 3.2 | 24 | 65,100 | 2.6 | 660 | 47 |
| WA | 56 | 1.7 | 2 | 91,100 | 4.8 | 896 | 40 |
| WV | 61 | 8.6 | 48 | 17,600 | 3.7 | 1,685 | 31 |
| WI | 97 | 3.5 | 27 | 73,600 | 4.0 | 2,201 | 9 |
| WY | 26 | 9.5 | 49 | 6,300 | 3.4 | 1,911 | 23 |
| Total or National Average: | 4,585 | 3.3 | 3.0 Million | 3.3 | 1,5178 | ||
| State | Inspectors4 | Years to Inspect Each Workplace Once |
State or Federal Program |
| AL | 25 | 111 | Federal |
| AK | 12 | 66 | State |
| AZ | 25 | 130 | State |
| AR | 9 | 245 | Federal |
| CA | 196 | 182 | State |
| CO | 26 | 128 | Federal |
| CT | 24 | 102 | Federal |
| DE | 4 | 222 | Federal |
| FL | 60 | 256 | Federal |
| GA | 45 | 163 | Federal |
| HI | 18 | 72 | State |
| ID | 9 | 138 | Federal |
| IL | 72 | 137 | Federal |
| IN | 40 | 138 | State |
| IA | 19 | 127 | State |
| KS | 32 | 117 | Federal |
| KY | 39 | 116 | State |
| LA | 15 | 207 | Federal |
| ME | 7 | 108 | Federal |
| MD | 55 | 116 | State |
| MA | 28 | 143 | Federal |
| MI | 62 | 50 | State |
| MN | 44 | 63 | State |
| MS | 12 | 122 | Federal |
| MO | 14 | 133 | Federal |
| MT | 5 | 120 | Federal |
| NE | 9 | 163 | Federal |
| NV | 44 | 43 | State |
| NH | 8 | 135 | Federal |
| NJ | 59 | 86 | Federal |
| NM | 8 | 129 | State |
| NY | 100 | 131 | Federal |
| NC | 96 | 79 | State |
| ND | 8 | 126 | Federal |
| OH | 59 | 122 | Federal |
| OK | 18 | 138 | Federal |
| OR | 72 | 31 | State |
| PA | 56 | 123 | Federal |
| RI | 6 | 118 | Federal |
| SC | 22 | 118 | State |
| SD | N/A | 280 | Federal |
| TN | 34 | 85 | State |
| TX | 100 | 155 | Federal |
| UT | 19 | 118 | State |
| VT | 8 | 80 | State |
| VA | 51 | 84 | State |
| WA | 110 | 49 | State |
| WV | 6 | 207 | Federal |
| WI | 36 | 107 | Federal |
| WY | 9 | 115 | State |
| Total or National Average: | 1,8829 | 11410 | |
| 1The state fatality rates are calculated by BLS as deaths per 100,000 equivalent workers. 2Bureau of Labor Statistics, rate of total cases per 100 workers. Number and rate are for private sector only and include Guam, Puerto Rico and the Virgin Islands. 3U.S. Department of Labor, OSHA. OIS Inspection Reports, FY 2014. IMIS Inspection Reports, Region by State for Federal (only) and Region by State for 18(B) state (only), FY 2013. Penalties shown are averages per serious citation for conditions creating a substantial probability of death or serious physical harm to workers. For Connecticut, Illinois, New Jersey and New York, averages are based only on federal data. 4From OSHA records for FY 2015. Includes only safety and industrial hygiene Compliance Safety and Health Officers (CSHOs) who conduct workplace inspections and does not include supervisory CSHOs. Federal CSHOs provided by OSHA's Directorate of Enforcement Programs, CSHO Count By State as of Feb. 10, 2015. State plan CSHOs provided by OSHA's Directorate of Cooperative and State Programs and includes "on board" safety and health CSHOs from the FY 2015 State Plan Grant Applications. The number of "on board" CSHOs may not accurately reflect the true number of CSHOs actually hired and conducting enforcement inspections due to possible budgetary reasons in any particular state. 5Under the OSHAct, states may operate their own OSHA programs. Connecticut, Illinois, New Jersey and New York have state programs covering state and local employees only. Twenty- one states and one territory have state OSHA programs covering both public- and private-sector workers. 6Rankings are based on best-to-worst fatality rate (1–best, 50–worst). 7Rankings are based on highest-to-lowest average penalty ($) per serious violation (1–highest, 50–lowest). 8National average is per citation average for federal OSHA serious penalties and state OSHA plan states’ serious penalties combined. Federal serious penalties average $1,972 per citation; state plan OSHA states average $1,043 per citation. 9Total number of inspectors includes 847 federal OSHA inspectors and 1,035 state OSHA inspectors, including 47 inspectors in the Virgin Islands and Puerto Rico. 10Frequency of all covered establishments for all states combined. Average inspection frequency of covered establishments for federal OSHA states is once every 140 years; inspection frequency of covered establishments for state OSHA plan states is once every 91 years. |
|||
| State | Number of OSHA Fatality Incestigations Conducted FY 20141 |
Total Penalties1 ($) |
Average Total Penalty Per Investigation ($) |
Median Initial Penalty1 ($) |
Median Current Penalty1 ($) |
State or Federal Program2 |
| AL | 18 | 134,992 | 7,500 | 4,138 | 3,300 | Federal |
| AK | 2 | 8,160 | 4,080 | 13,350 | 8,160 | State |
| AZ | 20 | 739,375 | 36,969 | 9,000 | 6,000 | State |
| AR | 17 | 139,919 | 8,231 | 7,000 | 7,000 | Federal |
| CA | 164 | 2,745,105 | 16,738 | 13,603 | 12,825 | State |
| CO | 18 | 176,600 | 9,811 | 7,000 | 7,0000 | Federal |
| CT | 10 | 34,000 | 3,400 | 1,400 | 50 | Federal |
| DE | 4 | 12,845 | 3,211 | 4,078 | 2,923 | Federal |
| FL | 91 | 848,175 | 9,321 | 6,300 | 5,670 | Federal |
| GA | 39 | 341,159 | 8,748 | 4,900 | 4,900 | Federal |
| HI | 8 | 182,230 | 22,779 | 29,178 | 25,025 | State |
| ID | 17 | 146,540 | 8,620 | 7,000 | 6,500 | Federal |
| IL | 48 | 1,518,740 | 31,640 | 7,700 | 7,0000 | Federal |
| IN | 49 | 153,550 | 3,134 | 4,200 | 3,750 | State |
| IA | 25 | 62,400 | 2,496 | 3,500 | 3,250 | State |
| KS | 28 | 232,850 | 8,316 | 7,000 | 2,625 | Federal |
| KY | 28 | 199,150 | 7,113 | 7,000 | 4,550 | State |
| LA | 31 | 175,780 | 5,670 | 7,000 | 5,600 | Federal |
| ME | 11 | 31,850 | 2,895 | 2,800 | 2,800 | Federal |
| MD | 18 | 54,300 | 3,017 | 5,750 | 4,325 | State |
| MA | 20 | 352,500 | 17,625 | 3,850 | 3,050 | Federal |
| MI | 21 | 85,000 | 4,048 | 8,400 | 7,000 | State |
| MN | 17 | 343,124 | 20,184 | 25,825 | 25,825 | State |
| MS | 20 | 251,900 | 12,595 | 5,950 | 5,050 | Federal |
| MO | 16 | 755,360 | 47,210 | 11,200 | 5,600 | Federal |
| MT | 5 | 36,148 | 7,230 | 7,000 | 5,000 | Federal |
| NE | 12 | 268,671 | 22,389 | 10,800 | 4,800 | Federal |
| NV | 22 | 157,285 | 7,149 | 7,000 | 5,390 | State |
| NH | 3 | 12,600 | 4,200 | 7,000 | 5,600 | Federal |
| NJ | 40 | 407,158 | 10,179 | 6,500 | 6,000 | Federal |
| NM | 12 | 31,100 | 2,592 | 3,950 | 3,650 | State |
| NY | 63 | 536,331 | 8,513 | 7,000 | 6,000 | Federal |
| NC | 55 | 161,770 | 2,941 | 4,700 | 4,200 | State |
| ND | 22 | 99,655 | 4,530 | 2,800 | 3,430 | Federal |
| OH | 51 | 538,550 | 10,560 | 7,000 | 6,800 | Federal |
| OK | 24 | 122,800 | 5,117 | 2,650 | 1,350 | Federal |
| OR | 32 | 60,700 | 1,897 | 2,490 | 1,525 | State |
| PA | 43 | 320,974 | 7,465 | 7,000 | 7,000 | Federal |
| RI | 3 | 2,000 | 667 | 0 | 0 | Federal |
| SC | 21 | 40,162 | 1,912 | 1,312 | 1,188 | State |
| SD | 6 | 140,340 | 23,390 | 5,950 | 4,750 | Federal |
| TN | 21 | 315,825 | 15,039 | 7,700 | 7,700 | State |
| TX | 187 | 1,793,935 | 9,593 | 7,000 | 7,000 | Federal |
| UT | 12 | 21,000 | 1,750 | 3,000 | 3,000 | State |
| VT | 4 | 10,500 | 2,625 | 0 | 0 | State |
| VA | 37 | 191,640 | 5,179 | 7,230 | 5,000 | State |
| WA | 40 | 188,850 | 4,721 | 2,600 | 2,250 | State |
| WV | 8 | 83,300 | 10,413 | 14,600 | 11,250 | Federal |
| WI | 15 | 380,600 | 25,373 | 7,000 | 7,000 | Federal |
| WY | 8 | 97,469 | 12,184 | 12,125 | 9,213 | State |
| National Median State Plan States |
6,375 | 4,438 | ||||
| National Median Federal States |
7,000 | 5,050 | ||||
| Total or National Average4 |
1,532 | 16,300,458 | 10,640 | |||
| 1OSHA IMIS Fatality Inspection and OSHA OIS Fatality Inspection Reports, FY 2014. Reports were issued on March 6, 2014. National median penalties include investigations conducted in Puerto Rico, District of Columbia and American Samoa. 2Under the OSHAct, states may operate their own OSHA programs. Connecticut, Illinois, New Jersey and New York have state programs covering state and local employees only. Twenty-one states and one territory have state OSHA programs covering both public- and private-sector workers. 3Fatality inspections and average penalty data for these states and Puerto Rico were pulled from both IMIS and OIS in FY 2014. However, their median initial and median current penalties were calculated only from IMIS inspections. A total of 32 inspections in OIS for FY 2014 are not included in median penalty calculations. 4National fatality investigations for all federal OSHA and state OSHA plan states combined. Federal OSHA average is $11,309 per fatality investigation; for state plan OSHA states, the average is $9,629 per fatality investigation. Total investigations, total penalties and national average penalty per investigation includes investigations conducted in Puerto Rico and the District of Columbia. |
||||||
| AL | AK | AZ | AR | CA | CO | ||
| Fatality Rates1 |
2008 | 5.3 | 10.6 | 3.4 | 6.8 | 2.8 | 4.2 |
| 2009 | 4.3 | 5.6 | 2.9 | 6.4 | 2.6 | 3.4 | |
| 2010 | 5.1 | 11.5 | 2.8 | 7.6 | 2.1 | 3.7 | |
| 2011 | 4 | 11.1 | 2.7 | 8 | 2.4 | 3.9 | |
| 2012 | 4.3 | 8.9 | 2.3 | 5.4 | 2.3 | 3.5 | |
| 2013 | 4 | 7.9 | 3.5 | 5.6 | 2.4 | 2.7 | |
| Injury/ Illness Rates2 |
2008 | 4.1 | 5.1 | 3.7 | 4.5 | 3.9 | N/A |
| 2009 | 3.6 | 4.5 | 3.5 | 3.5 | 3.7 | N/A | |
| 2010 | 3.5 | 4.5 | 3.3 | 3.3 | 3.7 | N/A | |
| 2011 | 3.7 | 4.5 | 3.2 | 3.4 | 3.5 | N/A | |
| 2012 | 3.3 | 4.6 | 3.2 | 3.2 | 3.5 | N/A | |
| 2013 | 3.3 | 4.3 | 3.3 | 3 | 3.5 | N/A | |
| Average Penalties ($)3 |
FY09 | 1,257 | 812 | 1,086 | 1,364 | 4,617 | 888 |
| FY10 | 1,167 | 886 | 1,008 | 1,259 | 4,631 | 801 | |
| FY11 | 2,352 | 707 | 1,030 | 2,311 | 4,851 | 1,721 | |
| FY12 | 2,184 | 960 | 1,036 | 2,506 | 5,043 | 1,603 | |
| FY13 | 1,803 | 889 | 891 | 2,569 | 6,422 | 1,649 | |
| FY14 | 2,016 | 823 | 935 | 2,329 | 5,733 | 1,564 |
| CT | DE | FL | GA | HI | ID | ||
| Fatality Rates1 |
2008 | 1.6 | 2.3 | 3.5 | 4.2 | 2.4 | 5.1 |
| 2009 | 2 | 1.9 | 3.2 | 2.8 | 2.1 | 4.3 | |
| 2010 | 3 | 2.2 | 3 | 2.8 | 3.2 | 4.9 | |
| 2011 | 2.2 | 2.6 | 2.9 | 2.8 | 4.2 | 5.1 | |
| 2012 | 2.1 | 3.1 | 2.7 | 2.5 | 3.4 | 2.7 | |
| 2013 | 1.8 | 2.6 | 2.8 | 2.8 | 1.6 | 4.3 | |
| Injury/ Illness Rates2 |
2008 | 4.6 | 3.3 | 3.8 | 3.3 | 4.3 | N/A |
| 2009 | 4.2 | 3.1 | 3.5 | 3.1 | 4 | N/A | |
| 2010 | 4 | 3.2 | 3.4 | 3.1 | 3.9 | N/A | |
| 2011 | 4.5 | 2.9 | N/A | 2.9 | 3.5 | N/A | |
| 2012 | 3.9 | 2.8 | N/A | 2.8 | 3.8 | N/A | |
| 2013 | 3.8 | 2.7 | N/A | 2.8 | 3.7 | N/A | |
| Average Penalties ($)3 |
FY09 | 1,025 | 1,092 | 933 | 968 | 683 | 729 |
| FY10 | 1,249 | 1,895 | 1,025 | 1,036 | 779 | 1,018 | |
| FY11 | 1,831 | 2,569 | 1,997 | 2,002 | 907 | 1,919 | |
| FY12 | 1,985 | 3,053 | 1,926 | 2,114 | 1,002 | 1,347 | |
| FY13 | 1,735 | 2,406 | 1,821 | 2,061 | 964 | 1,449 | |
| FY14 | 1,794 | 1,985 | 2,181 | 2,127 | 1,279 | 1,639 |
| IL | IN | IA | KS | KY | LA | ME | MD | ||
| Fatality Rates1 |
2008 | 3.3 | 5 | 5.9 | 5.3 | 5.9 | 7.3 | 3.9 | 2.2 |
| 2009 | 2.9 | 4.7 | 5.6 | 5.8 | 6 | 8 | 2.8 | 2.5 | |
| 2010 | 3.7 | 4.2 | 5.2 | 6.5 | 4.1 | 6.2 | 3.3 | 2.7 | |
| 2011 | 3.1 | 4.5 | 6.3 | 5.9 | 5.4 | 6.3 | 4.2 | 2.6 | |
| 2012 | 2.5 | 4.2 | 6.6 | 5.7 | 4.9 | 6.4 | 3.2 | 2.6 | |
| 2013 | 3.1 | 4.4 | 4.7 | 4.2 | 4.7 | 6.3 | 3.1 | 2.7 | |
| Injury/ Illness Rates2 |
2008 | 3.6 | 4.7 | 5 | 4.5 | 4.7 | 2.8 | 6 | 3.3 |
| 2009 | 3.5 | 4.2 | 4.6 | 4.1 | 4.2 | 2.8 | 5.6 | 3.3 | |
| 2010 | 3.3 | 4.1 | 4.4 | 3.7 | 4.2 | 2.7 | 5.6 | 3.6 | |
| 2011 | 3.2 | 4.2 | 4.3 | 3.9 | 4.2 | 2.5 | 5.7 | 3 | |
| 2012 | 3.2 | 3.9 | 4.5 | 3.6 | 4.1 | 2.3 | 5.6 | 3.1 | |
| 2013 | 3.2 | 3.6 | 4.5 | 3.5 | 4 | 2.2 | 5.3 | 3 | |
| Average Penalties ($)3 |
FY09 | 891 | 819 | 977 | 872 | 1,279 | 979 | 1,072 | 688 |
| FY10 | 991 | 900 | 1,23 | 1,283 | 1,410 | 1,287 | 1,115 | 854 | |
| FY11 | 2,151 | 886 | 1,289 | 2,243 | 2,248 | 2,350 | 2,231 | 726 | |
| FY12 | 2,255 | 996 | 880 | 2,293 | 3,368 | 2,348 | 2,146 | 814 | |
| FY13 | 1,876 | 1,054 | 790 | 1,971 | 3,254 | 1,765 | 2,083 | 685 | |
| FY14 | 1,980 | 957 | 901 | 2,017 | 2,828 | 2,201 | 2,013 | 746 |
| MA | MI | MN | MS | MO | MT | NE | NV | ||
| Fatality Rates1 |
2008 | 2.2 | 2.8 | 2.5 | 6.3 | 5.4 | 8.2 | 5.7 | 3.3 |
| 2009 | 2.2 | 6 | 2.4 | 6.3 | 5.6 | 12 | 6.2 | 2 | |
| 2010 | 1.8 | 3.6 | 2.8 | 6.4 | 4.2 | 8.2 | 6.3 | 4 | |
| 2011 | 2.2 | 3.5 | 2.3 | 5.5 | 4.9 | 11.2 | 3.9 | 3 | |
| 2012 | 1.4 | 3.4 | 2.6 | 5.5 | 3.3 | 7.3 | 5.2 | 4 | |
| 2013 | 1.8 | 3.3 | 2.6 | 6.2 | 4.3 | 5.8 | 4 | 3 | |
| Injury/ Illness Rates2 |
2008 | 3.6 | 4.4 | 4.2 | N/A | 3.6 | 6.4 | 4.4 | 5 |
| 2009 | N/A | 4.2 | 3.8 | N/A | 3.5 | 5.3 | 4.1 | 4.3 | |
| 2010 | 3.2 | 4.2 | 3.8 | N/A | 3.4 | 5 | 4.2 | 3.8 | |
| 2011 | 3.2 | 3.8 | 3.7 | N/A | 3.4 | 5 | 3.9 | 3.9 | |
| 2012 | 3.1 | 4 | 3.8 | N/A | 3.3 | 5 | 3.9 | 4.1 | |
| 2013 | 2.9 | 3.7 | 3.7 | N/A | 3.2 | 4.7 | 3.8 | 4 | |
| Average Penalties ($)3 |
FY09 | 1,107 | 438 | 599 | 775 | 798 | 900 | 1,106 | 1,085 |
| FY10 | 1,119 | 392 | 631 | 991 | 849 | 1,021 | 1,279 | 1,161 | |
| FY11 | 2,183 | 463 | 730 | 1,851 | 2,014 | 2,597 | 2,984 | 2,263 | |
| FY12 | 2,351 | 537 | 847 | 1,521 | 2,076 | 2,336 | 2,835 | 2,054 | |
| FY13 | 1,929 | 542 | 768 | 1,515 | 1,931 | 1,983 | 2,565 | 2,133 | |
| FY14 | 2,104 | 585 | 752 | 1,726 | 1,877 | 1,938 | 2,569 | 2,244 |
| NH | NJ | NM | NY | NC | ND | OH | ||
| Fatality Rates1 |
2008 | 1.1 | 2.3 | 3.5 | 2.4 | 3.9 | 8.3 | 3.2 |
| 2009 | 0.9 | 2.6 | 5.2 | 2.2 | 3.3 | 7.9 | 2.8 | |
| 2010 | 0.9 | 2.2 | 4.9 | 2.2 | 3.5 | 8.5 | 3.2 | |
| 2011 | 1.2 | 2.6 | 6.6 | 2.5 | 3.7 | 12.4 | 3.1 | |
| 2012 | 2.2 | 2.4 | 4.8 | 2.4 | 3.5 | 17.7 | 3.1 | |
| 2013 | 2.1 | 2.6 | 6.7 | 2.1 | 2.5 | 14.9 | 3 | |
| Injury/ Illness Rates2 |
2008 | N/A | 3.2 | 3.8 | 2.8 | 3.4 | N/A | N/A |
| 2009 | N/A | 3.3 | 4.2 | 2.9 | 3.1 | N/A | N/A | |
| 2010 | N/A | 3.2 | 3.7 | 2.7 | 3.1 | N/A | N/A | |
| 2011 | N/A | 3 | 4.2 | 2.9 | 3.1 | N/A | N/A | |
| 2012 | N/A | 3.1 | 3.9 | 2.5 | 2.9 | N/A | 3.2 | |
| 2013 | N/A | 2.9 | 3.2 | 2.4 | 2.7 | N/A | 2.9 | |
| Average Penalties ($)3 |
FY09 | 1,002 | 1,057 | 867 | 1,005 | 508 | 754 | 912 |
| FY10 | 1,640 | 1,106 | 1,257 | 991 | 884 | 1,180 | 1,014 | |
| FY11 | 2,656 | 2,233 | 1,025 | 2,043 | 1,081 | 2,091 | 2,010 | |
| FY12 | 2,531 | 2,398 | 1,041 | 2,164 | 970 | 2,655 | 2,320 | |
| FY13 | 2,243 | 2,151 | 998 | 2,016 | 996 | 3,045 | 2,156 | |
| FY14 | 2,113 | 2,176 | 879 | 1,907 | 1,250 | 2,659 | 2,299 |
| OK | OR | PA | RI | SC | SD | TN | TX | ||
| Fatality Rates1 |
2008 | 6.4 | 3.1 | 4.1 | 1.2 | 4.5 | 6.9 | 5.1 | 4.4 |
| 2009 | 5.3 | 3.9 | 3.1 | 1.5 | 4 | 5.9 | 4.5 | 4.6 | |
| 2010 | 6.3 | 2.9 | 4 | 1.9 | 4 | 8.8 | 5.4 | 4.4 | |
| 2011 | 5.5 | 3.4 | 3.4 | 1.5 | 5 | 6.7 | 4.5 | 4 | |
| 2012 | 6.1 | 2.6 | 3.4 | 1.7 | 4 | 6.7 | 3.8 | 4.8 | |
| 2013 | 5.8 | 2.9 | 3.2 | 2.1 | 4 | 4.7 | 3.6 | 4.4 | |
| Injury/ Illness Rates2 |
2008 | 4.5 | 4.6 | N/A | N/A | 3.1 | N/A | 4.2 | 3.1 |
| 2009 | 4 | 4.4 | N/A | N/A | 3.2 | N/A | 3.8 | 2.9 | |
| 2010 | 4 | 3.9 | N/A | N/A | 3.1 | N/A | 3.7 | 2.7 | |
| 2011 | 3.9 | 3.8 | 4.1 | N/A | 3.3 | N/A | 3.5 | 2.7 | |
| 2012 | 3.6 | 3.9 | 3.9 | N/A | 3 | N/A | 3.5 | 2.7 | |
| 2013 | N/A | 4.1 | 3.9 | N/A | 2.9 | N/A | 3.3 | 2.6 | |
| Average Penalties ($)3 |
FY09 | 1,188 | 331 | 908 | 868 | 288 | 579 | 620 | 1,106 |
| FY10 | 1,169 | 305 | 1,105 | 1,032 | 298 | 898 | 824 | 1,132 | |
| FY11 | 2,098 | 346 | 2,197 | 1,758 | 519 | 2,107 | 894 | 2,540 | |
| FY12 | 2,196 | 388 | 2,090 | 2,332 | 597 | 3,574 | 710 | 2,328 | |
| FY13 | 1,872 | 363 | 1,916 | 2,023 | 492 | 2,346 | 727 | 2,187 | |
| FY14 | 1,880 | 364 | 1,796 | 1,895 | 521 | 2,309 | 687 | 2,154 |
| UT | VT | VA | WA | WV | WI | WY | National Average |
||
| Fatality Rates1 |
2008 | 5.1 | 3.2 | 4.1 | 2.6 | 7.2 | 2.7 | 12.4 | 3.7 |
| 2009 | 3.9 | 2.9 | 3.3 | 2.5 | 5.7 | 3.4 | 7.5 | 3.5 | |
| 2010 | 3.1 | 3.9 | 2.8 | 3.4 | 13.7 | 3.4 | 12.9 | 3.6 | |
| 2011 | 3.3 | 2.6 | 3.4 | 1.9 | 5.9 | 3.3 | 11.6 | 6.5 | |
| 2012 | 3 | 3.5 | 3.8 | 2.2 | 6.9 | 4 | 12.2 | 3.4 | |
| 2013 | 2.9 | 2.2 | 3.2 | 1.7 | 8.6 | 3.5 | 9.5 | 3.3 | |
| Injury/ Illness Rates2 |
2008 | 4.7 | 5.5 | 3.1 | 5.6 | 4.7 | 4.9 | 4.6 | 3.9 |
| 2009 | 4 | 5.2 | 2.9 | 5.1 | 4.4 | 4.2 | 4 | 3.6 | |
| 2010 | 3.4 | 5.2 | 3.1 | 4.8 | 4.4 | 4.3 | 4 | 3.5 | |
| 2011 | 3.6 | 5 | 2.9 | 4.9 | 3.9 | 4.2 | 3.6 | 3.5 | |
| 2012 | 3.4 | 5 | 2.7 | 4.8 | 4.1 | 4 | 3.5 | 3.4 | |
| 2013 | 3.4 | 5.2 | 2.6 | 4.8 | 3.7 | 4 | 3.4 | 3.3 | |
| Average Penalties ($)3 |
FY09 | 732 | 582 | 510 | 459 | 898 | 919 | 402 | $882 |
| FY10 | 1,019 | 732 | 663 | 595 | 1,007 | 1,025 | 482 | $972 | |
| FY11 | 974 | 886 | 798 | 737 | 1,636 | 2,094 | 1,147 | $1,576 | |
| FY12 | 963 | 1,064 | 770 | 745 | 2,177 | 2,343 | 1,612 | $1,603 | |
| FY13 | 1,053 | 1,008 | 726 | 791 | 1,798 | 2,207 | 1,777 | $1,489 | |
| FY14 | 1,173 | 889 | 660 | 896 | 1,685 | 2,121 | 1,911 | $1,972 | |
| 1Bureau of Labor Statistics, rate per 100,000 workers. 2Bureau of Labor Statistics; rate of total cases per 100 workers. Number and rate are for private sector only and national average includes Guam, Puerto Rico and the Virgin Islands. Due to revisions of the OSHA recordkeeping requirements, the estimates from the BLS 2002 survey and beyond are not comparable with those from previous years. 3U.S. Department of Labor, OSHA IMIS Inspection Reports, National by Region for 18(B) State (only) and/or National by Region for Federal (only), FY2009 through FY2014, and OIS inspection reports for FY2011 through FY2014. Penalties shown are averages per serious citation for conditions creating a substantial probability of death or serious physical harm to workers. For Connecticut, Illinois, New Jersey and New York, averages are based only on federal data. Penalty data for FY 2011 does not include penalty information from approximately 4,500 inspections conducted in federal states in several OSHA regional offices that converted from IMIS to the new OIS data system at some point during FY 2011. |
|||||||||
| 2005 | 2006 | 2007 | 2008 | 2009 | 2010 | 2011 | 2012 | 2013 | |
| AL | 128 | 100 | 108 | 107 | 75 | 92 | 75 | 84 | 78 |
| AK | 29 | 45 | 30 | 33 | 17 | 39 | 39 | 31 | 32 |
| AZ | 99 | 112 | 97 | 100 | 76 | 77 | 69 | 60 | 95 |
| AR | 80 | 78 | 89 | 85 | 75 | 88 | 93 | 63 | 63 |
| CA | 465 | 537 | 461 | 465 | 409 | 326 | 390 | 375 | 396 |
| CO | 125 | 137 | 126 | 105 | 83 | 85 | 92 | 82 | 65 |
| CT | 46 | 38 | 38 | 28 | 34 | 49 | 37 | 36 | 29 |
| DE | 11 | 15 | 10 | 11 | 7 | 8 | 10 | 14 | 11 |
| FL | 406 | 360 | 363 | 291 | 245 | 225 | 226 | 218 | 239 |
| GA | 200 | 201 | 193 | 182 | 110 | 108 | 111 | 101 | 117 |
| HI | 15 | 30 | 23 | 19 | 13 | 19 | 26 | 20 | 11 |
| ID | 35 | 38 | 31 | 36 | 27 | 33 | 37 | 19 | 30 |
| IL | 194 | 207 | 185 | 193 | 158 | 206 | 177 | 146 | 176 |
| IN | 157 | 148 | 127 | 143 | 125 | 118 | 125 | 115 | 127 |
| IA | 90 | 71 | 89 | 93 | 80 | 77 | 93 | 97 | 72 |
| KS | 81 | 85 | 101 | 73 | 76 | 85 | 78 | 76 | 55 |
| KY | 122 | 147 | 112 | 106 | 101 | 69 | 93 | 91 | 86 |
| LA | 111 | 118 | 139 | 135 | 140 | 111 | 111 | 116 | 114 |
| ME | 15 | 20 | 21 | 24 | 16 | 20 | 26 | 19 | 19 |
| MD | 95 | 106 | 82 | 60 | 65 | 71 | 71 | 72 | 79 |
| MA | 75 | 66 | 75 | 68 | 64 | 54 | 68 | 44 | 57 |
| MI | 110 | 157 | 120 | 123 | 94 | 146 | 141 | 137 | 135 |
| MN | 87 | 78 | 72 | 65 | 61 | 70 | 60 | 70 | 69 |
| MS | 112 | 96 | 93 | 80 | 67 | 68 | 63 | 63 | 68 |
| MO | 185 | 167 | 156 | 148 | 142 | 106 | 132 | 88 | 118 |
| MT | 50 | 45 | 54 | 40 | 52 | 36 | 49 | 34 | 28 |
| NE | 36 | 57 | 63 | 53 | 57 | 54 | 39 | 48 | 39 |
| NV | 57 | 49 | 71 | 41 | 24 | 38 | 38 | 42 | 42 |
| NH | 18 | 13 | 14 | 7 | 6 | 6 | 9 | 14 | 14 |
| NJ | 112 | 88 | 106 | 92 | 99 | 81 | 99 | 92 | 102 |
| NM | 44 | 59 | 52 | 31 | 42 | 38 | 52 | 39 | 54 |
| NY | 239 | 234 | 220 | 213 | 185 | 182 | 206 | 202 | 178 |
| NC | 165 | 168 | 167 | 161 | 129 | 139 | 148 | 146 | 109 |
| ND | 22 | 31 | 25 | 28 | 25 | 30 | 44 | 65 | 56 |
| OH | 168 | 193 | 165 | 168 | 137 | 161 | 155 | 161 | 149 |
| OK | 95 | 91 | 104 | 102 | 82 | 94 | 86 | 97 | 92 |
| OR | 65 | 87 | 69 | 55 | 66 | 47 | 58 | 43 | 49 |
| PA | 224 | 240 | 220 | 241 | 168 | 221 | 186 | 194 | 183 |
| RI | 6 | 10 | 5 | 6 | 7 | 9 | 7 | 8 | 10 |
| SC | 132 | 95 | 122 | 87 | 73 | 69 | 81 | 63 | 75 |
| SD | 31 | 37 | 22 | 30 | 24 | 36 | 31 | 31 | 20 |
| TN | 139 | 153 | 154 | 135 | 111 | 138 | 120 | 101 | 95 |
| TX | 495 | 489 | 528 | 463 | 482 | 461 | 433 | 536 | 508 |
| UT | 54 | 60 | 78 | 64 | 48 | 41 | 39 | 39 | 37 |
| VT | 7 | 14 | 10 | 10 | 12 | 12 | 8 | 11 | 7 |
| VA | 186 | 165 | 146 | 156 | 119 | 107 | 127 | 149 | 128 |
| WA | 85 | 87 | 90 | 84 | 76 | 104 | 60 | 67 | 56 |
| WV | 46 | 79 | 61 | 53 | 41 | 95 | 43 | 49 | 61 |
| WI | 125 | 91 | 104 | 77 | 94 | 91 | 89 | 114 | 97 |
| WY | 46 | 36 | 48 | 33 | 19 | 33 | 32 | 35 | 26 |
| Total | 5,734 | 5,840 | 5,657 | 5,214 | 4,551 | 4,690 | 4,693 | 4,628 | 4,585 |
| Source: U.S. Department of Labor, Bureau of Labor Statistics, in cooperation with state and federal agencies, Census of Fatal Occupational Injuries. | |||||||||
| State | Total Fatalities 2013 | Assaults and Violent Acts | Transportation Incidents | Fires and Explosions | Falls | Exposure to Harmful Substances or Environments | Contact with Objects and Equipment |
|---|---|---|---|---|---|---|---|
| AL | 78 | 11 | 42 | -- | 11 | 4 | 9 |
| AK | 32 | 6 | 19 | -- | -- | 3 | -- |
| AZ | 95 | 25 | 24 | 19 | 13 | 5 | 8 |
| AR | 63 | 2 | 29 | 3 | 11 | 8 | 10 |
| CA | 396 | 80 | 138 | 9 | 64 | 39 | 65 |
| CO | 65 | 11 | 28 | -- | 9 | 9 | 7 |
| CT | 29 | 7 | 10 | -- | 6 | -- | 5 |
| DE | 11 | -- | 3 | -- | 3 | -- | 2 |
| D.C. | 25 | 19 | -- | 1 | -- | -- | -- |
| FL | 239 | 47 | 91 | -- | 55 | 19 | 25 |
| GA | 117 | 16 | 49 | -- | 26 | 5 | 19 |
| HI | 11 | -- | 4 | -- | 4 | 2 | -- |
| ID | 30 | -- | 15 | -- | 5 | 3 | 5 |
| IL | 176 | 32 | 67 | 6 | 21 | 14 | 35 |
| IN | 127 | 27 | 59 | 4 | 10 | 10 | 16 |
| IA | 72 | 4 | 29 | 1 | 13 | 8 | 16 |
| KS | 55 | 3 | 31 | 3 | 6 | 4 | 8 |
| KY | 86 | 13 | 36 | -- | 13 | 9 | 13 |
| LA | 114 | 15 | 42 | -- | 21 | 14 | 17 |
| ME | 19 | 2 | 6 | -- | 4 | -- | 4 |
| MD | 79 | 17 | 23 | 3 | 17 | 7 | 12 |
| MA | 57 | 20 | 13 | 1 | 12 | 5 | 6 |
| MI | 135 | 40 | 43 | 2 | 17 | 7 | 25 |
| MN | 69 | 6 | 34 | -- | 11 | 4 | 12 |
| MS | 68 | 8 | 36 | 3 | 9 | 3 | 9 |
| MO | 118 | 23 | 50 | 3 | 18 | 7 | 17 |
| MT | 28 | 5 | 12 | 1 | 4 | -- | 5 |
| NE | 39 | 4 | 21 | -- | 4 | 1 | 9 |
| NV | 42 | 7 | 15 | 8 | 6 | -- | 4 |
| NH | 14 | -- | 1 | 1 | 4 | -- | 6 |
| NJ | 102 | 28 | 37 | -- | 16 | 8 | 11 |
| NM | 54 | 4 | 36 | -- | 5 | 3 | 6 |
| NY | 178 | 39 | 56 | 4 | 36 | 12 | 30 |
| NC | 109 | 20 | 46 | -- | 11 | 7 | 23 |
| ND | 56 | 3 | 32 | 3 | 5 | -- | 13 |
| OH | 149 | 23 | 52 | 4 | 33 | 7 | 30 |
| OK | 92 | 5 | 55 | -- | 14 | 7 | 8 |
| OR | 49 | 4 | 19 | 1 | 8 | 5 | 12 |
| PA | 183 | 30 | 74 | 4 | 25 | 19 | 31 |
| RI | 10 | -- | -- | -- | -- | -- | 3 |
| SC | 75 | 15 | 29 | 1 | 13 | 8 | 9 |
| SD | 20 | 3 | 12 | -- | 2 | 1 | 1 |
| TN | 95 | 15 | 41 | -- | 12 | 8 | 18 |
| TX | 508 | 66 | 228 | 32 | 74 | 31 | 76 |
| UT | 37 | 7 | 11 | -- | 5 | -- | 11 |
| VT | 7 | -- | 4 | -- | -- | -- | -- |
| VA | 128 | 27 | 56 | -- | 21 | 6 | 16 |
| WA | 56 | 8 | 23 | -- | 10 | 3 | 11 |
| WV | 61 | 6 | 24 | 7 | 6 | 3 | 15 |
| WI | 97 | 11 | 41 | -- | 23 | 6 | 15 |
| WY | 26 | -- | 13 | -- | -- | -- | 9 |
| Total1 | 4,585 | 773 | 1,865 | 149 | 724 | 335 | 721 |
| Source: U.S. Department of Labor, Bureau of Labor Statistics, in cooperation with state and federal agencies, Census of Fatal Occupational Injuries, 2013. | |||||||
| 1Includes three fatal injuries that occurred in Guam and 20 fatal injuries that occurred in Puerto Rico. | |||||||
Note: State totals include other events and exposures, such as bodily reaction, in addition to those shown separately. Dashes indicate no data reported or data that do not meet BLS publication criteria.
| State | Number of Injuries/Illnesses | |||
|---|---|---|---|---|
| All Industries | Private Industry | State Government | Local Government | |
| AL | 49,500 | 42,000 | N/A | 5,700 |
| AK | 10,900 | 9,100 | 700 | 1,200 |
| AZ | 70,600 | 59,100 | 1,600 | 10,000 |
| AR | 32,400 | 24,800 | 3,000 | 4,600 |
| CA | 468,400 | 360,500 | 20,300 | 87,500 |
| CO | N/A | N/A | N/A | N/A |
| CT | 53,200 | 43,200 | 2,400 | 7,600 |
| DE | 9,700 | 7,900 | 800 | 1,100 |
| FL | N/A | N/A | N/A | N/A |
| GA | 98,000 | 77,500 | N/A | N/A |
| HI | 16,500 | 13,500 | 1,700 | 1,400 |
| ID | N/A | N/A | N/A | N/A |
| IL | 155,600 | 125,100 | 4,100 | 26,400 |
| IN | 85,800 | 71,900 | 2,500 | 11,400 |
| IA | 57,400 | 47,100 | 1,700 | 8,600 |
| KS | 37,700 | 31,700 | N/A | 5,600 |
| KY | 58,300 | 48,700 | 2,300 | 7,300 |
| LA | 41,800 | 30,000 | 2,400 | 9,500 |
| ME | 23,600 | 20,100 | 1,000 | 2,500 |
| MD | 67,000 | 51,500 | 4,800 | 10,700 |
| MA | 78,700 | 66,500 | 4,400 | N/A |
| MI | 117,400 | 100,300 | 4,800 | 12,400 |
| MN | 81,200 | 68,500 | 2,500 | 10,200 |
| MS | N/A | N/A | N/A | N/A |
| MO | 70,100 | 58,300 | N/A | 7,500 |
| MT | 15,500 | 13,000 | 600 | 2,000 |
| NE | 29,200 | 24,700 | N/A | 3,300 |
| NV | 37,900 | 32,700 | 1,000 | 4,100 |
| NH | N/A | N/A | N/A | N/A |
| NJ | 103,400 | 78,000 | 5,600 | 19,800 |
| NM | 22,100 | 16,800 | 1,700 | 3,600 |
| NY | 208,200 | 143,400 | 15,700 | 49,100 |
| NC | 91,300 | 71,500 | 3,700 | 16,100 |
| ND | N/A | N/A | N/A | N/A |
| OH | 122,600 | 106,700 | 5,100 | 10,800 |
| OK | N/A | N/A | N/A | N/A |
| OR | 52,900 | 45,200 | 1,800 | 6,000 |
| PA | 174,100 | 156,600 | N/A | N/A |
| RI | N/A | N/A | N/A | N/A |
| SC | 47,100 | 35,300 | 2,100 | 9,700 |
| SD | N/A | N/A | N/A | N/A |
| TN | 75,200 | 62,900 | 1,900 | 10,400 |
| TX | 249,000 | 198,800 | N/A | N/A |
| UT | 32,600 | 27,500 | 1,100 | 4,000 |
| VT | 12,300 | 10,300 | 700 | 1,300 |
| VA | 83,000 | 65,100 | 3,700 | 14,200 |
| WA | 108,100 | 91,100 | 4,000 | 12,900 |
| WV | 22,400 | 17,600 | 1,700 | 3,100 |
| WI | 85,200 | 73,600 | 2,700 | 8,900 |
| WY | 8,300 | 6,300 | 400 | 1,600 |
| Total or National Average2 | 3.8 million | 3.0 million | 160,400 | 585,700 |
| Rate1 of Injuries/Illnesses | ||||
| State | All Industries | Private Industries | State Government | Local Government |
| AL | 3.2 | 3.3 | N/A | 3.2 |
| AK | 4.2 | 4.3 | 3.1 | 4.9 |
| AZ | 3.5 | 3.3 | 3.0 | 5.3 |
| AR | 3.2 | 3.0 | 4.7 | 4.7 |
| CA | 4.0 | 3.5 | 5.6 | 7.5 |
| CO | N/A | N/A | N/A | N/A |
| CT | 4.1 | 3.8 | 4.5 | 8.2 |
| DE | 3.0 | 2.7 | 3.4 | 5.7 |
| FL | N/A | N/A | N/A | N/A |
| GA | 3.0 | 2.8 | N/A | N/A |
| HI | 3.8 | 3.7 | 3.5 | 8.0 |
| ID | N/A | N/A | N/A | N/A |
| IL | 3.5 | 3.2 | 3.5 | 6.0 |
| IN | 3.8 | 3.6 | 2.7 | 6.0 |
| IA | 4.8 | 4.5 | 3.9 | 7.3 |
| KS | 3.7 | 3.5 | N/A | 5.3 |
| KY | 4.1 | 4.0 | 3.1 | 5.7 |
| LA | 2.6 | 2.2 | 3.0 | 5.5 |
| ME | 5.3 | 5.3 | 5.1 | 6.0 |
| MD | 3.4 | 3.0 | 5.1 | 6.4 |
| MA | 3.0 | 2.9 | 4.3 | N/A |
| MI | 3.8 | 3.7 | 3.8 | 5.0 |
| MN | 3.9 | 3.7 | 3.6 | 6.2 |
| MS | N/A | N/A | N/A | N/A |
| MO | 3.3 | 3.2 | N/A | 3.4 |
| MT | 4.8 | 4.7 | 3.4 | 6.2 |
| NE | 3.9 | 3.8 | N/A | 4.0 |
| NV | 4.1 | 4.0 | 3.7 | 5.8 |
| NH | N/A | N/A | N/A | N/A |
| NJ | 3.4 | 2.9 | 4.9 | 6.8 |
| NM | 3.5 | 3.2 | 3.9 | 5.8 |
| NY | 3.0 | 2.4 | 8.1 | 6.3 |
| NC | 2.9 | 2.7 | 2.6 | 4.5 |
| ND | N/A | N/A | N/A | N/A |
| OH | 3.0 | 2.9 | N/A | 4.0 |
| OK | N/A | N/A | N/A | N/A |
| OR | 4.1 | 4.1 | 3.0 | 4.9 |
| PA | 3.9 | 3.9 | N/A | N/A |
| RI | N/A | N/A | N/A | N/A |
| SC | 3.2 | 2.9 | 2.9 | 5.7 |
| SD | N/A | N/A | N/A | N/A |
| TN | 3.4 | 3.3 | 2.6 | 4.7 |
| TX | 2.7 | 2.6 | N/A | N/A |
| UT | 3.4 | 3.4 | 2.2 | 4.8 |
| VT | 5.3 | 5.2 | 5.3 | 6.1 |
| VA | 2.9 | 2.6 | 2.9 | 4.7 |
| WA | 4.9 | 4.8 | 3.6 | 6.6 |
| WV | 3.8 | 3.7 | 4.3 | 4.8 |
| WI | 4.0 | 4.0 | 3.6 | 4.9 |
| WY | 3.5 | 3.4 | 2.8 | 4.7 |
| Total or National Average2 | 3.5 | 3.3 | 3.9 | 5.7 |
| Source: U.S. Department of Labor, Bureau of Labor Statistics, Survey of Occupational Injuries and lllnesses, 2013. | ||||
| 1Rate of total cases of injuries and illnesses per 100 workers. 2Total number of injuries and illnesses and national average rate of injuries and illnesses includes the District of Columbia, Guam, Puerto Rico and the Virgin Islands. |
||||
| Fatalities | ||||||||||
|---|---|---|---|---|---|---|---|---|---|---|
| State | 1996 | 1997 | 1998 | 1999 | 2000 | 2001 | 2002 | 2003 | 2004 | 2005 |
| AL | -- | -- | -- | -- | -- | -- | 5 | 8 | 6 | 9 |
| AK | -- | -- | -- | -- | -- | -- | -- | -- | -- | 3 |
| AZ | 17 | 13 | 27 | 26 | 26 | 34 | 28 | 17 | 25 | 36 |
| AR | -- | -- | -- | 8 | 9 | -- | 5 | 9 | 5 | 8 |
| CA | 183 | 189 | 174 | 216 | 172 | 188 | 176 | 164 | 188 | 190 |
| CO | 10 | 22 | 15 | 19 | 27 | 25 | 16 | 25 | 25 | 19 |
| CT | -- | -- | 10 | -- | 12 | 9 | 7 | -- | 10 | 5 |
| DE | -- | -- | -- | -- | -- | -- | -- | -- | -- | -- |
| FL | 68 | 84 | 58 | 68 | 75 | 84 | 98 | 90 | 119 | 113 |
| GA | 7 | 11 | 19 | 17 | 26 | 36 | 16 | 26 | 29 | 25 |
| HI | -- | -- | -- | -- | -- | -- | -- | -- | -- | -- |
| ID | -- | -- | -- | 6 | 5 | -- | 9 | 3 | 6 | 3 |
| IL | 22 | 17 | 17 | 21 | 17 | 30 | 27 | 22 | 29 | 23 |
| IN | -- | -- | -- | -- | -- | 8 | 9 | 7 | 7 | 5 |
| IA | -- | -- | -- | -- | -- | -- | -- | -- | 7 | -- |
| KS | -- | 5 | 15 | 5 | 5 | 6 | 5 | 4 | 11 | 10 |
| KY | -- | -- | -- | -- | -- | -- | -- | 3 | -- | 6 |
| LA | -- | -- | -- | -- | 5 | 5 | -- | -- | 9 | 8 |
| ME | -- | -- | -- | -- | -- | -- | 14 | -- | -- | -- |
| MD | -- | -- | -- | -- | 6 | -- | 10 | 11 | 17 | 8 |
| MA | 6 | 10 | 5 | 7 | 11 | 3 | 3 | |||
| MI | -- | -- | 6 | 12 | 6 | 7 | 7 | 4 | 6 | 8 |
| MN | -- | -- | -- | -- | 5 | -- | -- | 5 | 3 | 6 |
| MS | -- | -- | -- | -- | 5 | 11 | 5 | -- | 4 | 3 |
| MO | -- | -- | -- | -- | -- | 8 | -- | 6 | 4 | -- |
| MT | -- | -- | -- | -- | -- | 5 | -- | -- | -- | 4 |
| NE | -- | -- | -- | -- | -- | -- | 9 | 3 | 4 | -- |
| NV | 5 | 9 | 9 | 6 | 10 | 10 | 8 | 10 | 17 | 9 |
| NH | -- | -- | -- | -- | -- | -- | -- | -- | -- | -- |
| NJ | 10 | 12 | 12 | 17 | 23 | 25 | 33 | 24 | 34 | 30 |
| NM | 23 | 23 | 17 | 13 | 9 | 27 | 21 | 9 | 12 | 19 |
| NY | 58 | 31 | 34 | 42 | 55 | 45 | 43 | 36 | 45 | 34 |
| NC | 12 | 18 | 14 | 12 | 22 | 20 | 25 | 21 | 26 | 27 |
| ND | -- | -- | -- | -- | -- | -- | -- | -- | -- | -- |
| OH | -- | -- | 5 | -- | 5 | 6 | -- | 15 | 5 | 5 |
| OK | -- | 8 | 5 | -- | -- | 16 | 8 | 3 | 13 | 8 |
| OR | -- | -- | 10 | -- | 6 | 5 | -- | 7 | 4 | 6 |
| PA | -- | 5 | 7 | 8 | 16 | 10 | 12 | 10 | 6 | 11 |
| RI | -- | -- | -- | -- | -- | -- | -- | -- | -- | -- |
| SC | -- | -- | -- | 7 | 12 | 9 | 7 | 18 | 13 | 10 |
| SD | 3 | -- | -- | -- | -- | -- | ||||
| TN | 5 | -- | -- | 5 | 12 | 5 | 7 | 8 | 9 | 5 |
| TX | 137 | 133 | 175 | 151 | 190 | 170 | 147 | 163 | 150 | 200 |
| UT | 6 | -- | 9 | 5 | 6 | 8 | 6 | 11 | 5 | 4 |
| VT | -- | -- | -- | -- | -- | -- | -- | -- | -- | -- |
| VA | 6 | 9 | 6 | 12 | 5 | 12 | 15 | 13 | 13 | 24 |
| WA | 11 | 11 | 17 | -- | 13 | 13 | 15 | 5 | 14 | 7 |
| WV | -- | -- | -- | -- | -- | -- | -- | -- | -- | 4 |
| WI | -- | -- | -- | -- | -- | 8 | -- | 3 | -- | 9 |
| WY | -- | -- | -- | -- | 5 | 5 | 8 | -- | 3 | -- |
| Totals2 | 638 | 658 | 707 | 730 | 815 | 891 | 840 | 794 | 902 | 923 |
| State | 2006 | 2007 | 2008 | 2009 | 2010 | 2011 | 2012 | 2013 |
|---|---|---|---|---|---|---|---|---|
| AL | 6 | 5 | 5 | -- | 5 | 3 | 5 | 6 |
| AK | 5 | -- | -- | -- | -- | 5 | 5 | 3 |
| AZ | 36 | 26 | 30 | 22 | 18 | 21 | 16 | 25 |
| AR | 3 | 5 | 9 | -- | 6 | 7 | 3 | 6 |
| CA | 231 | 179 | 180 | 161 | 142 | 154 | 137 | 194 |
| CO | 18 | 30 | 21 | 17 | 19 | 22 | 21 | 14 |
| CT | 7 | 4 | 7 | 4 | 5 | 7 | 6 | 5 |
| DE | -- | -- | -- | -- | -- | -- | -- | 3 |
| FL | 95 | 111 | 73 | 49 | 38 | 53 | 54 | 68 |
| GA | 35 | 28 | 26 | 10 | 16 | 14 | 10 | 14 |
| HI | -- | 4 | -- | -- | -- | -- | 1 | -- |
| ID | 7 | -- | 5 | 4 | 5 | -- | -- | 6 |
| IL | 30 | 27 | 25 | 16 | 25 | 25 | 19 | 26 |
| IN | 7 | 7 | 14 | 3 | 3 | 8 | 8 | 8 |
| IA | -- | 4 | 6 | 8 | 5 | 3 | 4 | -- |
| KS | 4 | 5 | 9 | 8 | 4 | 10 | 8 | 6 |
| KY | 7 | 6 | 7 | 3 | -- | 3 | 6 | -- |
| LA | 10 | 11 | 5 | 11 | 7 | 8 | 13 | 15 |
| ME | -- | -- | -- | -- | -- | -- | -- | -- |
| MD | 22 | 7 | 10 | 3 | 12 | 8 | 15 | 15 |
| MA | 7 | 11 | 3 | 3 | ||||
| MI | 12 | 7 | 8 | 4 | 10 | 4 | 4 | 3 |
| MN | 4 | -- | -- | -- | 3 | -- | -- | -- |
| MS | 3 | 7 | 7 | 4 | 5 | -- | -- | -- |
| MO | 4 | 7 | 4 | 6 | 3 | 4 | -- | 5 |
| MT | 3 | 3 | -- | 3 | 3 | -- | -- | -- |
| NE | -- | 4 | 5 | -- | 3 | 3 | 5 | 3 |
| NV | 12 | 12 | 13 | 6 | 9 | 8 | 8 | 9 |
| NH | -- | -- | -- | -- | -- | -- | -- | -- |
| NJ | 28 | 23 | 25 | 25 | 20 | 26 | 15 | 20 |
| NM | 30 | 21 | 10 | 16 | 17 | 23 | 22 | 20 |
| NY | 57 | 41 | 33 | 35 | 29 | 30 | 39 | 32 |
| NC | 23 | 14 | 20 | 12 | 13 | 21 | 13 | 16 |
| ND | -- | -- | -- | 4 | 5 | 3 | 12 | -- |
| OH | 8 | 6 | 4 | 4 | 8 | 1 | 8 | 2 |
| OK | 8 | 13 | 9 | 7 | 17 | 10 | 7 | 18 |
| OR | 11 | 6 | -- | 8 | 6 | 6 | -- | 9 |
| PA | 14 | 16 | 11 | 10 | 13 | 14 | 13 | 4 |
| RI | -- | -- | -- | -- | -- | 3 | -- | -- |
| SC | 10 | 7 | 8 | 10 | 10 | 10 | 4 | 7 |
| SD | -- | -- | -- | -- | ||||
| TN | 14 | 8 | 9 | 8 | 8 | 9 | 9 | 9 |
| TX | 174 | 211 | 148 | 185 | 165 | 171 | 201 | 192 |
| UT | 6 | 10 | 6 | 8 | 4 | 3 | 6 | 5 |
| VT | -- | -- | -- | -- | -- | 1 | -- | -- |
| VA | 13 | 18 | 16 | 7 | 9 | 14 | 15 | 22 |
| WA | 7 | 10 | 8 | 7 | 14 | 5 | 12 | 4 |
| WV | -- | -- | -- | -- | -- | -- | -- | -- |
| WI | 3 | 5 | -- | 5 | 4 | 4 | 7 | 7 |
| WY | -- | 8 | -- | -- | -- | -- | 3 | -- |
| Totals2 | 990 | 937 | 804 | 713 | 707 | 749 | 748 | 817 |
| Source: U.S. Department of Labor, Bureau of Labor Statistics, in cooperation with state and federal agencies, Census of Fatal Occupational Injuries. | ||||||||
| 1Latino includes both foreign-born and native-born. 2Total includes fatalities that may have occurred in the District of Columbia. |
||||||||
Note: Dashes indicate no data reported or data that do not meet BLS publication criteria.
| Fatalities | |||||||||
|---|---|---|---|---|---|---|---|---|---|
| State | 1996 | 1997 | 1998 | 1999 | 2000 | 2001 | 2002 | 2003 | 2004 |
| AL | -- | -- | -- | -- | -- | -- | 5 | 3 | 6 |
| AK | 9 | 5 | -- | -- | -- | 9 | -- | -- | 7 |
| AZ | 11 | 10 | 23 | 21 | 19 | 29 | 22 | 15 | 21 |
| AR | 7 | -- | -- | 5 | 9 | -- | -- | -- | 4 |
| CA | 167 | 134 | 111 | 223 | 195 | 208 | 170 | 146 | 174 |
| CO | 6 | 15 | 12 | 15 | 11 | 23 | 11 | 22 | 21 |
| CT | 8 | 6 | 13 | 5 | 14 | 20 | 7 | 7 | 15 |
| DE | -- | -- | -- | -- | -- | -- | -- | -- | -- |
| FL | 87 | 106 | 65 | 69 | 91 | 96 | 106 | 109 | 123 |
| GA | 16 | 14 | 22 | 14 | 28 | 57 | 20 | 34 | 24 |
| HI | -- | -- | -- | -- | 6 | 11 | 8 | 4 | 9 |
| ID | -- | -- | -- | 5 | 5 | -- | 8 | 3 | 4 |
| IL | 34 | 37 | 29 | 31 | 28 | 52 | 37 | 42 | 44 |
| IN | 5 | 7 | 8 | 5 | 7 | 11 | 11 | 9 | 10 |
| IA | -- | -- | -- | -- | -- | -- | -- | -- | 5 |
| KS | -- | -- | 8 | -- | 5 | 5 | 7 | 6 | 10 |
| KY | -- | -- | -- | -- | -- | -- | 8 | -- | 3 |
| LA | 8 | 6 | 7 | -- | 7 | 9 | -- | -- | 3 |
| ME | -- | -- | 5 | -- | -- | -- | 15 | -- | -- |
| MD | 9 | -- | 9 | 15 | 12 | 8 | 16 | 21 | 24 |
| MA | 9 | 7 | 6 | 16 | 5 | 7 | 14 | 14 | 22 |
| MI | 9 | 13 | 7 | 24 | 18 | 15 | 15 | 16 | 11 |
| MN | 6 | -- | -- | -- | -- | -- | 5 | 5 | 4 |
| MS | -- | 5 | -- | -- | -- | 6 | 5 | -- | 3 |
| MO | -- | -- | -- | 10 | 7 | 6 | 7 | 5 | 9 |
| MT | -- | -- | -- | -- | -- | -- | -- | -- | -- |
| NE | -- | -- | -- | -- | -- | -- | 12 | -- | 3 |
| NV | 5 | 6 | 7 | 9 | 9 | 12 | 13 | 9 | 15 |
| NH | -- | -- | -- | -- | -- | -- | -- | 3 | -- |
| NJ | 29 | 30 | 26 | 25 | 31 | 37 | 41 | 41 | 39 |
| NM | 13 | 11 | 8 | -- | -- | 15 | 6 | 4 | 6 |
| NY | 98 | 67 | 66 | 67 | 91 | 75 | 80 | 73 | 74 |
| NC | 11 | 19 | 13 | 17 | 7 | 22 | 26 | 26 | 25 |
| ND | -- | -- | -- | -- | -- | -- | -- | 4 | -- |
| OH | 6 | 12 | 8 | 9 | 12 | 7 | 13 | 18 | 10 |
| OK | -- | 8 | -- | -- | -- | 13 | 15 | 7 | 11 |
| OR | 5 | -- | 5 | 11 | -- | -- | 6 | 5 | 6 |
| PA | 8 | 10 | 9 | 11 | 16 | 16 | 13 | 15 | 19 |
| RI | -- | -- | -- | -- | -- | -- | -- | 4 | -- |
| SC | -- | 5 | 6 | 7 | 16 | 12 | 8 | 18 | 18 |
| SD | -- | -- | -- | -- | -- | -- | -- | -- | -- |
| TN | -- | -- | -- | -- | 5 | -- | 7 | 15 | 12 |
| TX | 93 | 102 | 111 | 100 | 115 | 122 | 110 | 121 | 101 |
| UT | 5 | 6 | 5 | 8 | 6 | 8 | 9 | 12 | 4 |
| VT | -- | -- | -- | -- | -- | -- | -- | -- | -- |
| VA | 8 | 20 | 10 | 18 | 17 | 22 | 20 | 22 | 41 |
| WA | 22 | 12 | 19 | 7 | 13 | 17 | 19 | 6 | 21 |
| WV | -- | -- | -- | -- | -- | -- | -- | -- | -- |
| WI | -- | -- | -- | 7 | -- | 9 | -- | 5 | 5 |
| WY | -- | -- | -- | -- | -- | -- | -- | -- | -- |
| Totals2 | 728 | 714 | 654 | 811 | 849 | 994 | 929 | 890 | 979 |
| State | 2005 | 2006 | 2007 | 2008 | 2009 | 2010 | 2011 | 2012 | 2013 |
|---|---|---|---|---|---|---|---|---|---|
| AL | 10 | -- | 5 | 3 | 7 | 10 | 5 | 8 | 7 |
| AK | 5 | 4 | 4 | 3 | -- | 6 | 7 | 4 | -- |
| AZ | 31 | 27 | 18 | 21 | 14 | 15 | 15 | 16 | 19 |
| AR | -- | -- | 9 | 7 | 3 | 12 | 5 | 4 | 8 |
| CA | 203 | 229 | 182 | 145 | 146 | 145 | 164 | 153 | 176 |
| CO | 11 | 21 | 24 | 14 | 16 | 13 | 16 | 14 | 9 |
| CT | 7 | 10 | 4 | -- | 3 | 10 | 9 | 8 | 8 |
| DE | -- | 5 | -- | -- | -- | -- | 5 | 4 | 4 |
| FL | 119 | 119 | 121 | 86 | 62 | 55 | 67 | 64 | 74 |
| GA | 31 | 35 | 28 | 27 | 4 | 4 | 18 | 16 | 13 |
| HI | 4 | 11 | 6 | 4 | 3 | 4 | 7 | 7 | 2 |
| ID | 3 | 7 | 3 | 5 | 3 | 6 | 3 | 1 | 5 |
| IL | 36 | 37 | 34 | 34 | 23 | 42 | 38 | 28 | 31 |
| IN | 13 | 12 | 6 | 13 | 5 | 8 | 8 | 11 | 16 |
| IA | -- | -- | 7 | 7 | 8 | 3 | 2 | 7 | 4 |
| KS | 12 | 4 | 5 | 10 | 5 | 4 | 9 | 8 | 6 |
| KY | 7 | 10 | 5 | 7 | 6 | -- | 4 | 6 | 6 |
| LA | 10 | 11 | 7 | 5 | 9 | 6 | 7 | 16 | 15 |
| ME | -- | -- | -- | -- | -- | 3 | -- | 1 | 2 |
| MD | 26 | 34 | 18 | 15 | 10 | 16 | 12 | 20 | 21 |
| MA | 22 | 11 | 18 | 16 | 13 | 15 | 16 | 7 | 16 |
| MI | 12 | 19 | 14 | 10 | 8 | 17 | 10 | 12 | 12 |
| MN | 10 | 6 | -- | -- | -- | 5 | 1 | 5 | 2 |
| MS | 8 | -- | 9 | 5 | 3 | 6 | 4 | 2 | 3 |
| MO | 6 | 9 | 12 | 8 | 9 | 4 | -- | -- | 19 |
| MT | -- | 4 | 3 | -- | 5 | -- | 1 | 4 | 3 |
| NE | -- | -- | 5 | 6 | 4 | 3 | 3 | 7 | 4 |
| NV | 8 | 9 | 11 | 11 | -- | 9 | 13 | 11 | 5 |
| NH | -- | -- | -- | -- | -- | -- | -- | 1 | -- |
| NJ | 47 | 34 | 36 | 40 | 41 | 20 | 40 | 27 | 31 |
| NM | 7 | 10 | 8 | 5 | 5 | 8 | 10 | 10 | 8 |
| NY | 79 | 90 | 66 | 71 | 57 | 63 | 57 | 65 | 60 |
| NC | 29 | 27 | 21 | 25 | 22 | 18 | 29 | 21 | 21 |
| ND | -- | -- | -- | -- | -- | 3 | 3 | 12 | 1 |
| OH | 11 | 13 | 8 | 10 | 10 | 13 | 8 | 19 | 13 |
| OK | -- | -- | 14 | 5 | 7 | 13 | 10 | 7 | 17 |
| OR | 8 | 9 | 7 | -- | 10 | 10 | 6 | 2 | 11 |
| PA | 24 | 23 | 28 | 25 | 22 | 34 | 28 | 19 | 11 |
| RI | -- | -- | -- | -- | -- | -- | -- | 4 | -- |
| SC | 13 | 11 | 10 | 8 | 8 | 13 | 11 | 4 | 7 |
| SD | -- | -- | -- | -- | -- | -- | -- | 1 | 3 |
| TN | 14 | 23 | 12 | 19 | 13 | 17 | 12 | 11 | 15 |
| TX | 135 | 112 | 153 | 104 | 125 | 117 | 115 | 107 | 134 |
| UT | 8 | 5 | 8 | 12 | 4 | 8 | 5 | 4 | 6 |
| VT | -- | -- | -- | -- | -- | -- | 1 | -- | -- |
| VA | 33 | 17 | 31 | 18 | 21 | 12 | 19 | 25 | 22 |
| WA | 9 | 12 | 23 | 15 | 9 | 11 | 12 | 15 | 8 |
| WV | -- | -- | 3 | -- | -- | -- | 1 | 2 | 2 |
| WI | 9 | -- | 5 | -- | 4 | -- | 9 | 13 | 8 |
| WY | -- | 4 | 7 | -- | -- | -- | 5 | 4 | 3 |
| Totals2 | 1,035 | 1,046 | 1,009 | 835 | 740 | 798 | 843 | 824 | 879 |
| Source: U.S. Department of Labor, Bureau of Labor Statistics, Census of Fatal Occupational Injuries, in cooperation with state, New York City, the District of Columbia and federal agencies. | |||||||||
| 1The definition of "foreign-born" employed by the Census of Fatal Occupational Injuries refers simply to workers not born in the United States or U.S. territories and does not convey information on citizenship at birth. 2Totals include fatalities that may have occurred in the District of Columbia. |
|||||||||
Note: Dashes indicate no data reported or data that do not meet BLS publication criteria
STATE PROFILES
ALABAMA
Worker Safety and Health
| Number of employees:1 | 1,845,086 | |
| Number of establishments:1 | 116,058 | |
| State or federal OSHA Program:2 | Federal | |
| Number of state and local public employees not covered by the OSH Act: | 304,955 | |
| Number of workplace fatalities, 2013:3 | 78 | |
| Rate per 100,000 workers:4 | 4.0 | |
| National Rate: | 3.3 | |
| Ranking of state fatality rate, 2013:5 | 31 | |
| Total cases of workplace injuries and illnesses, private industry, 2013:6 | 42,000 | |
| Rate per 100 workers: | 1.7 | |
| National Rate: | 1.7 | |
| Total injury and illness cases with days away from work, job transfer or restriction, private industry, 2013:7 | 20,900 | |
| Rate per 100 workers: | 1.7 | |
| National Rate: | 1.7 | |
| Number of workplace safety and health inspectors, FY 2015:8 | 25 | |
| Length of time it would take for OSHA to inspect each workplace once: | 111 yrs. | |
| Number of workplace safety and health inspections conducted, FY 2014:9 | 998 | |
| Construction: | 341 | |
| Non-construction: | 657 | |
| Average penalty assessed for serious violations of the OSH Act, FY 2014:9 | $2,016 | |
| National average: | $1,972 | |
| Average total penalty per fatality investigation, FY 2014:10 | $7,500 | |
| National average: | $10,640 |
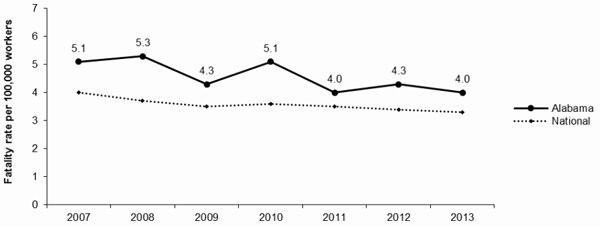
Prepared by AFL-CIO Safety and Health Department, April 2015
ALASKA
Worker Safety and Health
| Number of employees:1 | 328,716 | |
| Number of establishments:1 | 21,907 | |
| State or federal OSHA Program:2 | State | |
| Number of workplace fatalities, 2013:3 | 32 | |
| Rate per 100,000 workers:4 | 7.9 | |
| National Rate: | 3.3 | |
| Ranking of state fatality rate, 2013:5 | 47 | |
| Total cases of workplace injuries and illnesses, private industry, 2013:6 | 9,100 | |
| Rate per 100 workers: | 4.3 | |
| National Rate: | 3.3 | |
| Total injury and illness cases with days away from work, job transfer or restriction, private industry, 2013:7 | 4,300 | |
| Rate per 100 workers: | 2.0 | |
| National Rate: | 1.7 | |
| Number of workplace safety and health inspectors, FY 2015:8 | 12 | |
| Length of time it would take for OSHA to inspect each workplace once: | 66 yrs. | |
| Number of workplace safety and health inspections conducted, FY 2014:9 | 321 | |
| Construction: | 153 | |
| Non-construction: | 168 | |
| Average penalty assessed for serious violations of the OSH Act, FY 2014:9 | $823 | |
| National average: | $1,972 | |
| Average total penalty per fatality investigation, FY 2014:10 | $4,080 | |
| National average: | $10,640 |
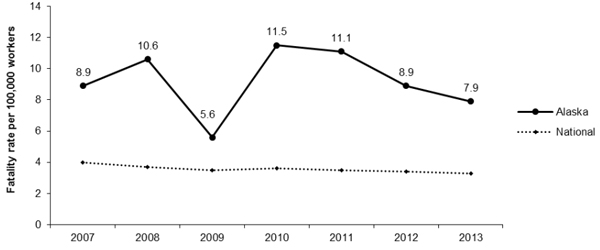
Prepared by AFL-CIO Safety and Health Department, April 2015
ARIZONA
Worker Safety and Health
| Number of employees:1 | 2,488,009 | |
| Number of establishments:1 | 143,496 | |
| State or federal OSHA Program: | State | |
| Number of workplace fatalities, 2013:3 | 95 | |
| Rate per 100,000 workers:4 | 3.5 | |
| National Rate: | 3.3 | |
| Ranking of state fatality rate, 2013:5 | 27 | |
| Total cases of workplace injuries and illnesses, private industry, 2013:6 | 59,100 | |
| Rate per 100 workers: | 3.3 | |
| National Rate: | 3.3 | |
| Total injury and illness cases with days away from work, job transfer or restriction, private industry, 2013:7 | 33,500 | |
| Rate per 100 workers: | 1.9 | |
| National Rate: | 1.7 | |
| Number of workplace safety and health inspectors, FY 2015:8 | 25 | |
| Length of time it would take for OSHA to inspect each workplace once: | 130 yrs. | |
| Number of workplace safety and health inspections conducted, FY 2014:9 | 1,092 | |
| Construction: | 627 | |
| Non-construction: | 465 | |
| Average penalty assessed for serious violations of the OSH Act, FY 2014:9 | $935 | |
| National average: | $1,972 | |
| Average total penalty per fatality investigation, FY 2014:10 | $36,969 | |
| National average: | $10,640 |
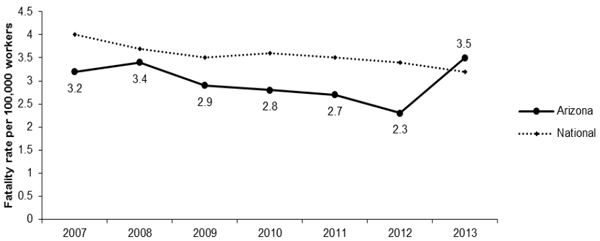
Prepared by AFL-CIO Safety and Health Department, April 2015
ARKANSAS
Worker Safety and Health
| Number of employees:1 | 1,146,274 | |
| Number of establishments:1 | 86,863 | |
| State or federal OSHA Program:2 | Federal | |
| Number of state and local public employees not covered by the OSH Act: | 181,271 | |
| Number of workplace fatalities, 2013:3 | 63 | |
| Rate per 100,000 workers:4 | 5.6 | |
| National Rate: | 3.3 | |
| Ranking of state fatality rate, 2013:5 | 41 | |
| Total cases of workplace injuries and illnesses, private industry, 2013:6 | 24,800 | |
| Rate per 100 workers: | 3.0 | |
| National Rate: | 3.3 | |
| Total injury and illness cases with days away from work, job transfer or restriction, private industry, 2013:7 | 11,500 | |
| Rate per 100 workers: | 1.4 | |
| National Rate: | 1.7 | |
| Number of workplace safety and health inspectors, FY 2015:8 | 9 | |
| Length of time it would take for OSHA to inspect each workplace once: | 245 yrs. | |
| Number of workplace safety and health inspections conducted, FY 2014:9 | 341 | |
| Construction: | 183 | |
| Non-construction: | 158 | |
| Average penalty assessed for serious violations of the OSH Act, FY 2014:9 | $2,329 | |
| National average: | $1,972 | |
| Average total penalty per fatality investigation, FY 2014:10 | $8,231 | |
| National average: | $10,640 |
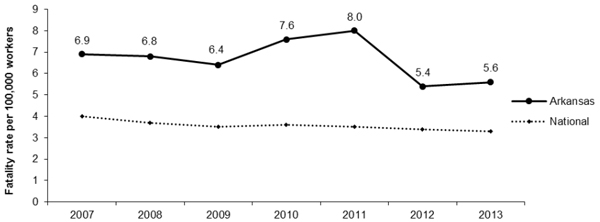
Prepared by AFL-CIO Safety and Health Department, April 2015
CALIFORNIA
Worker Safety and Health
| Number of employees:1 | 15,378,962 | |
| Number of establishments:1 | 1,330,600 | |
| State or federal OSHA Program:2 | State | |
| Number of workplace fatalities, 2013:3 | 396 | |
| Rate per 100,000 workers:4 | 2.4 | |
| National Rate: | 3.3 | |
| Ranking of state fatality rate, 2013:5 | 9 | |
| Total cases of workplace injuries and illnesses, private industry, 2013:6 | 360,500 | |
| Rate per 100 workers: | 3.5 | |
| National Rate: | 3.3 | |
| Total injury and illness cases with days away from work, job transfer or restriction, private industry, 2013:7 | 213,500 | |
| Rate per 100 workers: | 2.1 | |
| National Rate: | 1.7 | |
| Number of workplace safety and health inspectors, FY 2015:8 | 196 | |
| Length of time it would take for OSHA to inspect each workplace once: | 182 yrs. | |
| Number of workplace safety and health inspections conducted, FY 2014:9 | 7,309 | |
| Construction: | 2,365 | |
| Non-construction: | 4,944 | |
| Average penalty assessed for serious violations of the OSH Act, FY 2014:9 | $5,733 | |
| National average: | $1,972 | |
| Average total penalty per fatality investigation, FY 2014:10 | $16,567 | |
| National average: | $10,640 |
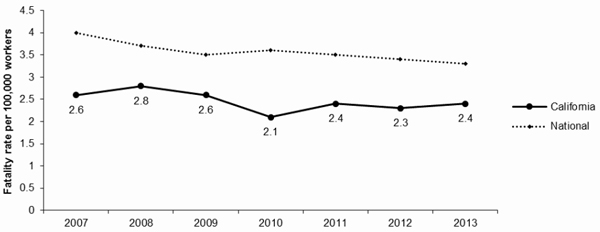
Prepared by AFL-CIO Safety and Health Department, April 2015
COLORADO
Worker Safety and Health
| Number of employees:1 | 2,335,803 | |
| Number of establishments:1 | 174,583 | |
| State or federal OSHA Program:2 | Federal | |
| Number of state and local public employees not covered by the OSH Act: | 330,095 | |
| Number of workplace fatalities, 2013:3 | 65 | |
| Rate per 100,000 workers:4 | 2.7 | |
| National Rate: | 3.3 | |
| Ranking of state fatality rate, 2013:5 | 14 | |
| Total cases of workplace injuries and illnesses, private industry, 2013:6 | N/A | |
| Rate per 100 workers: | N/A | |
| National Rate: | 3.3 | |
| Total injury and illness cases with days away from work, job transfer or restriction, private industry, 2013:7 | N/A | |
| Rate per 100 workers: | N/A | |
| National Rate: | 1.7 | |
| Number of workplace safety and health inspectors, FY 2015:8 | 26 | |
| Length of time it would take for OSHA to inspect each workplace once: | 128 yrs | |
| Number of workplace safety and health inspections conducted, FY 2014:9 | 1,350 | |
| Construction: | 793 | |
| Non-construction: | 557 | |
| Average penalty assessed for serious violations of the OSH Act, FY 2014:9 | $1,564 | |
| National average: | $1,972 | |
| Average total penalty per fatality investigation, FY 2014:10 | $9,811 | |
| National average: | $10,640 |
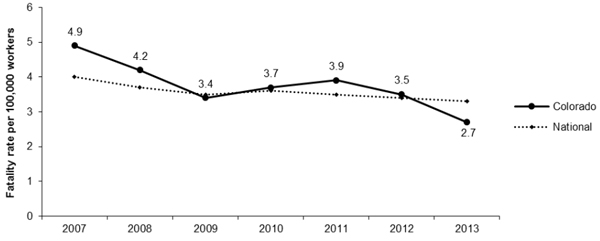
Prepared by AFL-CIO Safety and Health Department, April 2015
CONNECTICUT
Worker Safety and Health
| Number of employees:1 | 1,640,333 | |
| Number of establishments:1 | 112,751 | |
| State or federal OSHA Program:2 | Federal | |
| Number of workplace fatalities, 2013:3 | 29 | |
| Rate per 100,000 workers:4 | 1.8 | |
| National Rate: | 3.3 | |
| Ranking of state fatality rate, 2013:5 | 3 | |
| Total cases of workplace injuries and illnesses, private industry, 2013:6 | 43,200 | |
| Rate per 100 workers: | 3.8 | |
| National Rate: | 3.3 | Total injury and illness cases with days away from work, job transfer or restriction, private industry, 2013:7 | 23,900 |
| Rate per 100 workers: | 2.1 | |
| National Rate: | 1.7 | |
| Number of workplace safety and health inspectors, FY 2015:8 | 24 | |
| Length of time it would take for OSHA to inspect each workplace once: | 102 yrs | |
| Number of workplace safety and health inspections conducted, FY 2014:9 | 1,108 | |
| Construction: | 527 | |
| Non-construction: | 581 | |
| Average penalty assessed for serious violations of the OSH Act, FY 2014:9 | $1,794 | |
| National average: | $1,972 | |
| Average total penalty per fatality investigation, FY 2014:10 | $3,400 | |
| National average: | $10,640 |
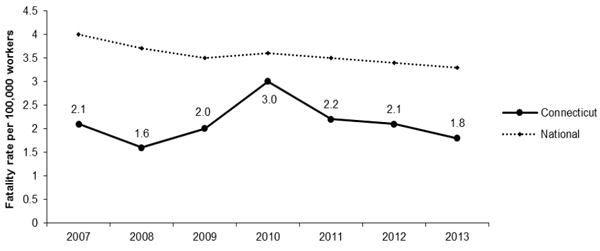
Prepared by AFL-CIO Safety and Health Department, April 2015
DELAWARE
Worker Safety and Health
| Number of employees:1 | 413,825 | |
| Number of establishments:1 | 28,363 | |
| State or federal OSHA Program:2 | Federal | |
| Number of state and local public employees not covered by the OSH Act: | 55,102 | |
| Number of workplace fatalities, 2013:3 | 11 | |
| Rate per 100,000 workers:4 | 2.6 | |
| National Rate: | 3.3 | |
| Ranking of state fatality rate, 2013:5 | 11 | |
| Total cases of workplace injuries and illnesses, private industry, 2013:6 | 7,900 | |
| Rate per 100 workers: | 2.7 | |
| National Rate: | 3.3 | |
| Total injury and illness cases with days away from work, job transfer or restriction, private industry, 2013:7 | 4,000 | |
| Rate per 100 workers: | 1.4 | |
| National Rate: | 1.7 | |
| Number of workplace safety and health inspectors, FY 2015:8 | 4 | |
| Length of time it would take for OSHA to inspect each workplace once: | 222 yrs | |
| Number of workplace safety and health inspections conducted, FY 2014:9 | 126 | |
| Construction: | 79 | |
| Non-construction: | 47 | |
| Average penalty assessed for serious violations of the OSH Act, FY 2014:9 | $1,985 | |
| National average: | $1,972 | |
| Average total penalty per fatality investigation, FY 2014:10 | $3,211 | |
| National average: | $10,640 |
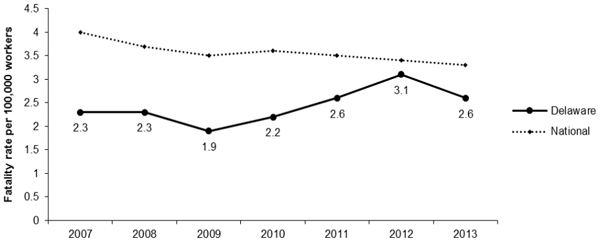
Prepared by AFL-CIO Safety and Health Department, April 2015
DISTRICT OF COLUMBIA

Worker Safety and Health
| Number of employees:1 | 742,270 | |
| Number of establishments:1 | 35,363 | |
| State or federal OSHA Program:2 | Federal | |
| Number of state and local public employees not covered by the OSH Act: | 33,992 | |
| Number of workplace fatalities, 2013:3 | 25 | |
| Rate per 100,000 workers:4 | 7.3 | |
| National Rate: | 3.3 | |
| Ranking of state fatality rate, 2013:5 | N/A | |
| Total cases of workplace injuries and illnesses, private industry, 2013:6 | 6,900 | |
| Rate per 100 workers: | 1.7 | |
| National Rate: | 3.3 | |
| Total injury and illness cases with days away from work, job transfer or restriction, private industry, 2013:7 | 3,300 | |
| Rate per 100 workers: | 0.8 | |
| National Rate: | 1.7 | |
| Number of workplace safety and health inspectors, FY 2015:8 | N/A | |
| Length of time it would take for OSHA to inspect each workplace once: | 91 yrs | |
| Number of workplace safety and health inspections conducted, FY 2014:9 | 389 | |
| Construction: | 327 | |
| Non-construction: | 62 | |
| Average penalty assessed for serious violations of the OSH Act, FY 2014:9 | $1,529 | |
| National average: | $1,972 | |
| Average total penalty per fatality investigation, FY 2014:10 | $1,750 | |
| National average: | $10,640 |
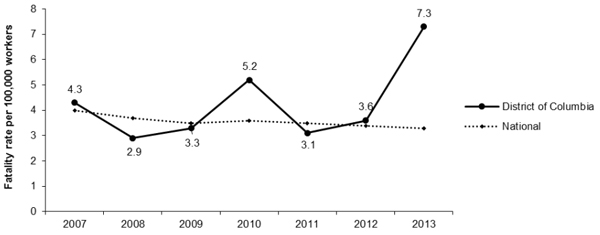
Prepared by AFL-CIO Safety and Health Department, April 2015
FLORIDA
Worker Safety and Health
| Number of employees:1 | 7,518,448 | |
| Number of establishments:1 | 624,558 | |
| State or federal OSHA Program:2 | Federal | |
| Number of state and local public employees not covered by the OSH Act: | 894,654 | |
| Number of workplace fatalities, 2013:3 | 239 | |
| Rate per 100,000 workers:4 | 2.8 | |
| National Rate: | 3.3 | |
| Ranking of state fatality rate, 2013:5 | 16 | |
| Total cases of workplace injuries and illnesses, private industry, 2013:6 | N/A | |
| Rate per 100 workers: | N/A | |
| National Rate: | 3.3 | |
| Total injury and illness cases with days away from work, job transfer or restriction, private industry, 2013:7 | N/A | |
| Rate per 100 workers: | N/A | |
| National Rate: | 1.7 | |
| Number of workplace safety and health inspectors, FY 2015:8 | 60 | |
| Length of time it would take for OSHA to inspect each workplace once: | 256 yrs | |
| Number of workplace safety and health inspections conducted, FY 2014:9 | 2,416 | |
| Construction: | 1,278 | |
| Non-construction: | 1,138 | |
| Average penalty assessed for serious violations of the OSH Act, FY 2014:9 | $2,181 | |
| National average: | $1,972 | |
| Average total penalty per fatality investigation, FY 2014:10 | $9,321 | |
| National average: | $10,640 |
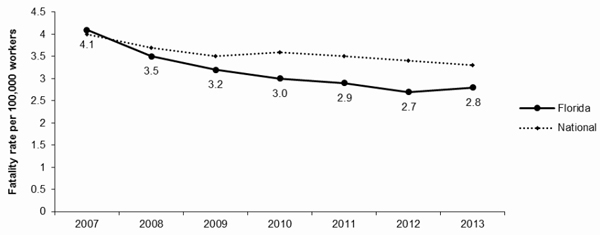
Prepared by AFL-CIO Safety and Health Department, April 2015
GEORGIA
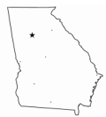
Worker Safety and Health
| Number of employees:1 | 3,918,085 | |
| Number of establishments:1 | 273,722 | |
| State or federal OSHA Program:2 | Federal | |
| Number of state and local public employees not covered by the OSH Act: | 539,838 | |
| Number of workplace fatalities, 2013:3 | 117 | |
| Rate per 100,000 workers:4 | 2.8 | |
| National Rate: | 3.3 | |
| Ranking of state fatality rate, 2013:5 | 16 | |
| Total cases of workplace injuries and illnesses, private industry, 2013:6 | 77,500 | |
| Rate per 100 workers: | 2.8 | |
| National Rate: | 3.3 | |
| Total injury and illness cases with days away from work, job transfer or restriction, private industry, 2013:7 | 39,300 | |
| Rate per 100 workers: | 1.4 | |
| National Rate: | 1.7 | |
| Number of workplace safety and health inspectors, FY 2015:8 | 45 | |
| Length of time it would take for OSHA to inspect each workplace once: | 163 yrs | |
| Number of workplace safety and health inspections conducted, FY 2014:9 | 1,637 | |
| Construction: | 733 | |
| Non-construction: | 904 | |
| Average penalty assessed for serious violations of the OSH Act, FY 2014:9 | $2,127 | |
| National average: | $1,972 | |
| Average total penalty per fatality investigation, FY 2014:10 | $8,748 | |
| National average: | $10,640 |
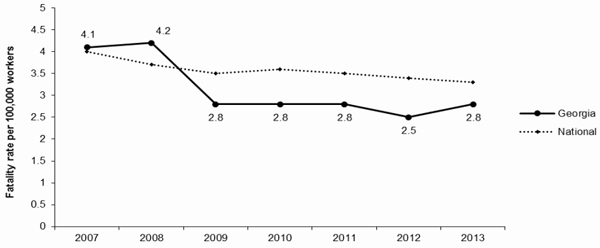
Prepared by AFL-CIO Safety and Health Department, April 2015
HAWAII

Worker Safety and Health
| Number of employees:1 | 618,195 | |
| Number of establishments:1 | 38,160 | |
| State or federal OSHA Program:2 | State | |
| Number of workplace fatalities, 2013:3 | 11 | |
| Rate per 100,000 workers: | 1.6 | |
| National Rate: | 3.3 | |
| Ranking of state fatality rate, 2013:5 | 1 | |
| Total cases of workplace injuries and illnesses, private industry, 2013:6 | 13,500 | |
| Rate per 100 workers: | 3.7 | |
| National Rate: | 3.3 | |
| Total injury and illness cases with days away from work, job transfer or restriction, private industry, 2013:7 | 8,200 | |
| Rate per 100 workers: | 2.3 | |
| National Rate: | 1.7 | |
| Number of workplace safety and health inspectors, FY 2015:8 | 18 | |
| Length of time it would take for OSHA to inspect each workplace once: | 72 yrs. | |
| Number of workplace safety and health inspections conducted, FY 2014:9 | 523 | |
| Construction: | 374 | |
| Non-construction: | 149 | |
| Average penalty assessed for serious violations of the OSH Act, FY 2014:9 | $1,279 | |
| National average: | $1,972 | |
| Average total penalty per fatality investigation, FY 2014:10 | $22,779 | |
| National average: | $10,640 |
Prepared by AFL-CIO Safety and Health Department, April 2015
IDAHO
Worker Safety and Health
| Number of employees:1 | 630,328 | |
| Number of establishments:1 | 53,283 | |
| State or federal OSHA Program:2 | Federal | |
| Number of state and local public employees not covered by the OSH Act: | 99,024 | |
| Number of workplace fatalities, 2013:3 | 30 | |
| Rate per 100,000 workers:4 | 4.3 | |
| National Rate: | 3.3 | |
| Ranking of state fatality rate, 2013:5 | 34 | |
| Total cases of workplace injuries and illnesses, private industry, 2013:6 | N/A | |
| Rate per 100 workers: | N/A | |
| National Rate: | 3.3 | |
| Total injury and illness cases with days away from work, job transfer or restriction, private industry, 2013:7 | N/A | |
| Rate per 100 workers: | N/A | |
| National Rate: | 1.7 | |
| Number of workplace safety and health inspectors, FY 2015:8 | 9 | |
| Length of time it would take for OSHA to inspect each workplace once: | 138 yrs | |
| Number of workplace safety and health inspections conducted, FY 2014:9 | 370 | |
| Construction: | 206 | |
| Non-construction: | 164 | |
| Average penalty assessed for serious violations of the OSH Act, FY 2014:9 | $1,639 | |
| National average: | $1,972 | |
| Average total penalty per fatality investigation, FY 2014:10 | $8,620 | |
| National average: | $10,640 |
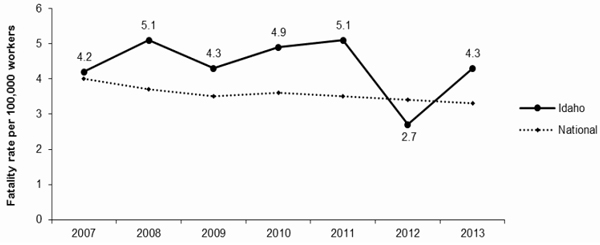
Prepared by AFL-CIO Safety and Health Department, April 2015
ILLINOIS
Worker Safety and Health
| Number of employees:1 | 5,687,541 | |
| Number of establishments:1 | 400,996 | |
| State or federal OSHA Program:2 | Federal | |
| Number of workplace fatalities, 2013:3 | 176 | |
| Rate per 100,000 workers:4 | 3.1 | |
| National Rate: | 3.3 | |
| Ranking of state fatality rate, 2013:5 | 22 | |
| Total cases of workplace injuries and illnesses, private industry, 2013:6 | 125,100 | |
| Rate per 100 workers: | 3.2 | |
| National Rate: | 3.3 | |
| Total injury and illness cases with days away from work, job transfer or restriction, private industry, 2013:7 | 66,000 | |
| Rate per 100 workers: | 1.7 | |
| National Rate: | 1.7 | |
| Number of workplace safety and health inspectors, FY 2015:8 | 72 | |
| Length of time it would take for OSHA to inspect each workplace once: | 137 yrs | |
| Number of workplace safety and health inspections conducted, FY 2014:9 | 2,932 | |
| Construction: | 1,293 | |
| Non-construction: | 1,639 | |
| Average penalty assessed for serious violations of the OSH Act, FY 2014:9 | $1,980 | |
| National average: | $1,972 | |
| Average total penalty per fatality investigation, FY 2014:10 | $31,640 | |
| National average: | $10,640 |
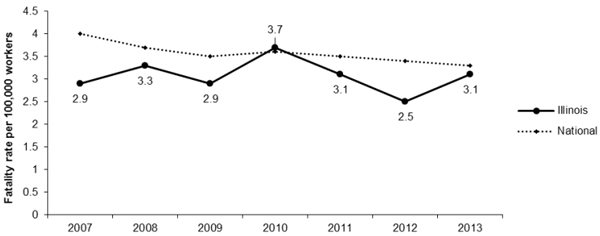
Prepared by AFL-CIO Safety and Health Department, April 2015
INDIANA
Worker Safety and Health
| Number of employees:1 | 2,849,311 | |
| Number of establishments:1 | 159,320 | |
| State or federal OSHA Program:2 | State | |
| Number of workplace fatalities, 2013:3 | 127 | |
| Rate per 100,000 workers: | 4.4 | |
| National Rate: | 3.3 | |
| Ranking of state fatality rate, 2013:5 | 36 | |
| Total cases of workplace injuries and illnesses, private industry, 2013:6 | 71,900 | |
| Rate per 100 workers: | 3.6 | |
| National Rate: | 3.3 | |
| Total injury and illness cases with days away from work, job transfer or restriction, private industry, 2013:7 | 35,800 | |
| Rate per 100 workers: | 1.8 | |
| National Rate: | 1.7 | |
| Number of workplace safety and health inspectors, FY 2015:8 | 40 | |
| Length of time it would take for OSHA to inspect each workplace once: | 138 yrs. | |
| Number of workplace safety and health inspections conducted, FY 2014:9 | 1,141 | |
| Construction: | 708 | |
| Non-construction: | 433 | |
| Average penalty assessed for serious violations of the OSH Act, FY 2014:9 | $957 | |
| National average: | $1,972 | |
| Average total penalty per fatality investigation, FY 2014:10 | $3,134 | |
| National average: | $10,640 |
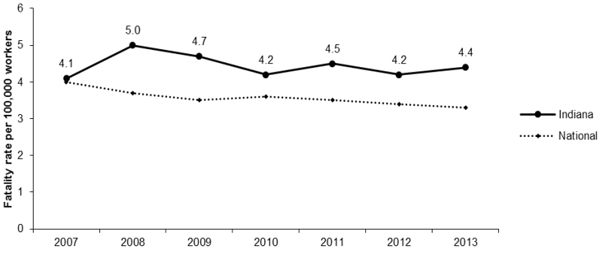
Prepared by AFL-CIO Safety and Health Department, April 2015
IOWA
Worker Safety and Health
| Number of employees:1 | 1,496,426 | |
| Number of establishments:1 | 97,645 | |
| State or federal OSHA Program:2 | State | |
| Number of workplace fatalities, 2013:3 | 72 | |
| Rate per 100,000 workers:4 | 4.7 | |
| National Rate: | 3.3 | |
| Ranking of state fatality rate, 2013:5 | 38 | |
| Total cases of workplace injuries and illnesses, private industry, 2013:6 | 47,100 | |
| Rate per 100 workers: | 4.5 | |
| National Rate: | 3.3 | |
| Total injury and illness cases with days away from work, job transfer or restriction, private industry, 2013:7 | 23,800 | |
| Rate per 100 workers: | 2.3 | |
| National Rate: | 1.7 | |
| Number of workplace safety and health inspectors, FY 2015:8 | 19 | |
| Length of time it would take for OSHA to inspect each workplace once: | 127 yrs. | |
| Number of workplace safety and health inspections conducted, FY 2014:9 | 757 | |
| Construction: | 416 | |
| Non-construction: | 341 | |
| Average penalty assessed for serious violations of the OSH Act, FY 2014:9 | $901 | |
| National average: | $1,972 | |
| Average total penalty per fatality investigation, FY 2014:10 | $2,496 | |
| National average: | $10,640 |
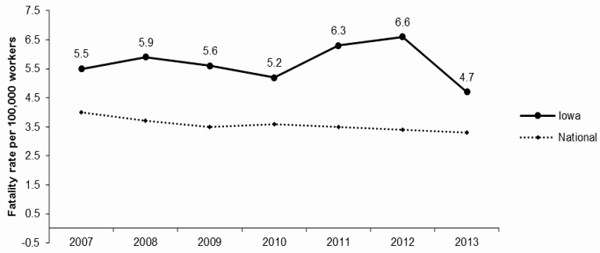
Prepared by AFL-CIO Safety and Health Department, April 2015
KANSAS
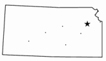
Worker Safety and Health
| Number of employees:1 | 1,336,946 | |
| Number of establishments:1 | 84,237 | |
| State or federal OSHA Program:2 | Federal | |
| Number of state and local public employees not covered by the OSH Act: | 218,671 | |
| Number of workplace fatalities, 2013:3 | 55 | |
| Rate per 100,000 workers:4 | 4.2 | |
| National Rate: | 3.3 | |
| Ranking of state fatality rate, 2013:5 | 33 | |
| Total cases of workplace injuries and illnesses, private industry, 2013:6 | 31,700 | |
| Rate per 100 workers: | 3.5 | |
| National Rate: | 3.3 | |
| Total injury and illness cases with days away from work, job transfer or restriction, private industry, 2013:7 | 15,000 | |
| Rate per 100 workers: | 1.7 | |
| National Rate: | 1.7 | |
| Number of workplace safety and health inspectors, FY 2015:8 | 32 | |
| Length of time it would take for OSHA to inspect each workplace once: | 117 yrs | |
| Number of workplace safety and health inspections conducted, FY 2014:9 | 689 | |
| Construction: | 232 | |
| Non-construction: | 457 | |
| Average penalty assessed for serious violations of the OSH Act, FY 2014:9 | $2,017 | |
| National average: | $1,972 | |
| Average total penalty per fatality investigation, FY 2014:10 | $8,316 | |
| National average: | $10,640 |
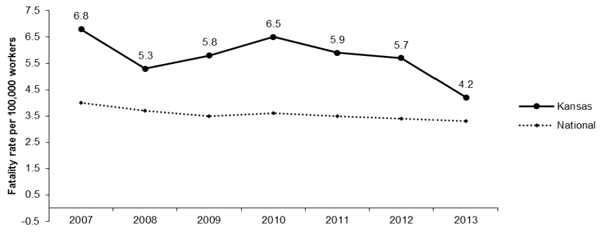
Prepared by AFL-CIO Safety and Health Department, April 2015
KENTUCKY
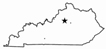
Worker Safety and Health
| Number of employees:1 | 1,779,777 | |
| Number of establishments:1 | 117,837 | |
| State or federal OSHA Program:2 | State | |
| Number of workplace fatalities, 2013:3 | 86 | |
| Rate per 100,000 workers: | 4.7 | |
| National Rate: | 3.3 | |
| Ranking of state fatality rate, 2013:5 | 38 | |
| Total cases of workplace injuries and illnesses, private industry, 2013:6 | 48,700 | |
| Rate per 100 workers: | 4.0 | |
| National Rate: | 3.3 | |
| Total injury and illness cases with days away from work, job transfer or restriction, private industry, 2013:7 | 24,900 | |
| Rate per 100 workers: | 2.1 | |
| National Rate: | 1.7 | |
| Number of workplace safety and health inspectors, FY 2015:8 | 39 | |
| Length of time it would take for OSHA to inspect each workplace once: | 116 yrs. | |
| Number of workplace safety and health inspections conducted, FY 2014:9 | 997 | |
| Construction: | 511 | |
| Non-construction: | 486 | |
| Average penalty assessed for serious violations of the OSH Act, FY 2014:9 | $2,828 | |
| National average: | $1,972 | |
| Average total penalty per fatality investigation, FY 2014:10 | $7,113 | |
| National average: | $10,640 |
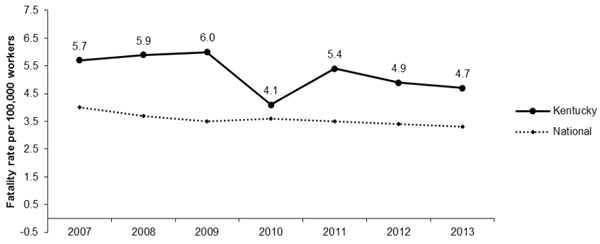
Prepared by AFL-CIO Safety and Health Department, April 2015
LOUISIANA
Worker Safety and Health
| Number of employees:1 | 1,893,823 | |
| Number of establishments:1 | 126,835 | |
| State or federal OSHA Program:2 | Federal | |
| Number of state and local public employees not covered by the OSH Act: | 291,202 | |
| Number of workplace fatalities, 2013:3 | 114 | |
| Rate per 100,000 workers:4 | 6.3 | |
| National Rate: | 3.3 | |
| Ranking of state fatality rate, 2013:5 | 45 | |
| Total cases of workplace injuries and illnesses, private industry, 2013:6 | 30,000 | |
| Rate per 100 workers: | 2.2 | |
| National Rate: | 3.3 | |
| Total injury and illness cases with days away from work, job transfer or restriction, private industry, 2013:7 | 15,200 | |
| Rate per 100 workers: | 1.1 | |
| National Rate: | 1.7 | |
| Number of workplace safety and health inspectors, FY 2015:8 | 15 | |
| Length of time it would take for OSHA to inspect each workplace once: | 207 yrs | |
| Number of workplace safety and health inspections conducted, FY 2014:9 | 590 | |
| Construction: | 312 | |
| Non-construction: | 278 | |
| Average penalty assessed for serious violations of the OSH Act, FY 2014:9 | $2,201 | |
| National average: | $1,972 | |
| Average total penalty per fatality investigation, FY 2014:10 | $5,670 | |
| National average: | $10,640 |
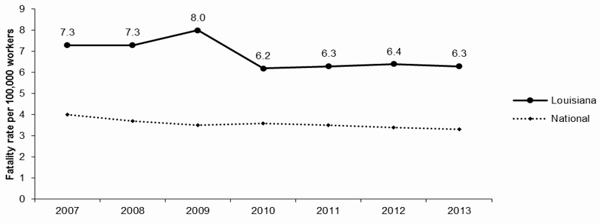
Prepared by AFL-CIO Safety and Health Department, April 2015
MAINE
Worker Safety and Health
| Number of employees:1 | 586,525 | |
| Number of establishments:1 | 49,212 | |
| State or federal OSHA Program:2 | Federal | |
| Number of state and local public employees not covered by the OSH Act: | 81,633 | |
| Number of workplace fatalities, 2013:3 | 19 | |
| Rate per 100,000 workers:4 | 3.1 | |
| National Rate: | 3.3 | |
| Ranking of state fatality rate, 2013:5 | 22 | |
| Total cases of workplace injuries and illnesses, private industry, 2013:6 | 20,100 | |
| Rate per 100 workers: | 5.3 | |
| National Rate: | 3.3 | |
| Total injury and illness cases with days away from work, job transfer or restriction, private industry, 2013:7 | 11,200 | |
| Rate per 100 workers: | 2.9 | |
| National Rate: | 1.7 | |
| Number of workplace safety and health inspectors, FY 2015:8 | 7 | |
| Length of time it would take for OSHA to inspect each workplace once: | 108 yrs | |
| Number of workplace safety and health inspections conducted, FY 2014:9 | 435 | |
| Construction: | 213 | |
| Non-construction: | 222 | |
| Average penalty assessed for serious violations of the OSH Act, FY 2014:9 | $2,013 | |
| National average: | $1,972 | |
| Average total penalty per fatality investigation, FY 2014:10 | $2,895 | |
| National average: | $10,640 |
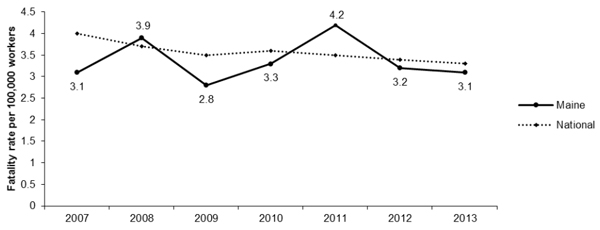
Prepared by AFL-CIO Safety and Health Department, April 2015
MARYLAND
Worker Safety and Health
| Number of employees:1 | 2,531,656 | |
| Number of establishments:1 | 169,030 | |
| State or federal OSHA Program:2 | State | |
| Number of workplace fatalities, 2013:3 | 79 | |
| Rate per 100,000 workers:4 | 2.7 | |
| National Rate: | 3.3 | |
| Ranking of state fatality rate, 2013:5 | 14 | |
| Total cases of workplace injuries and illnesses, private industry, 2013:6 | 51,500 | |
| Rate per 100 workers: | 3.0 | |
| National Rate: | 3.3 | |
| Total injury and illness cases with days away from work, job transfer or restriction, private industry, 2013:7 | 25,900 | |
| Rate per 100 workers: | 1.5 | |
| National Rate: | 1.7 | |
| Number of workplace safety and health inspectors, FY 2015:8 | 55 | |
| Length of time it would take for OSHA to inspect each workplace once: | 116 yrs. | |
| Number of workplace safety and health inspections conducted, FY 2014:9 | 1,450 | |
| Construction: | 1,051 | |
| Non-construction: | 399 | |
| Average penalty assessed for serious violations of the OSH Act, FY 2014:9 | $746 | |
| National average: | $1,972 | |
| Average total penalty per fatality investigation, FY 2014:10 | $2,450 | |
| National average: | $10,640 |
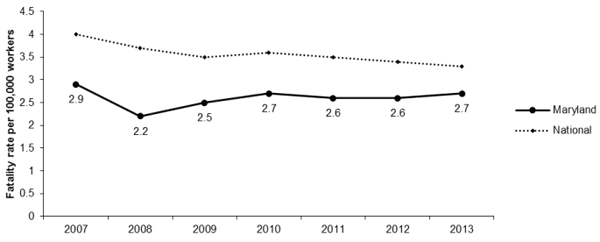
Prepared by AFL-CIO Safety and Health Department, April 2015
MASSACHUSETTS
Worker Safety and Health
| Number of employees:1 | 3,295,647 | |
| Number of establishments:1 | 226,350 | |
| State or federal OSHA Program:2 | Federal | |
| Number of state and local public employees not covered by the OSH Act: | 373,563 | |
| Number of workplace fatalities, 2013:3 | 57 | |
| Rate per 100,000 workers:4 | 1.8 | |
| National Rate: | 3.3 | |
| Ranking of state fatality rate, 2013:5 | 3 | |
| Total cases of workplace injuries and illnesses, private industry, 2013:6 | 66,500 | |
| Rate per 100 workers: | 2.9 | |
| National Rate: | 3.3 | |
| Total injury and illness cases with days away from work, job transfer or restriction, private industry, 2013:7 | 36,700 | |
| Rate per 100 workers: | 1.6 | |
| National Rate: | 1.7 | |
| Number of workplace safety and health inspectors, FY 2015:8 | 28 | |
| Length of time it would take for OSHA to inspect each workplace once: | 143 yrs | |
| Number of workplace safety and health inspections conducted, FY 2014:9 | 1,536 | |
| Construction: | 881 | |
| Non-construction: | 655 | |
| Average penalty assessed for serious violations of the OSH Act, FY 2014:9 | $2,104 | |
| National average: | $1,972 | |
| Average total penalty per fatality investigation, FY 2014:10 | $17,625 | |
| National average: | $10,640 |
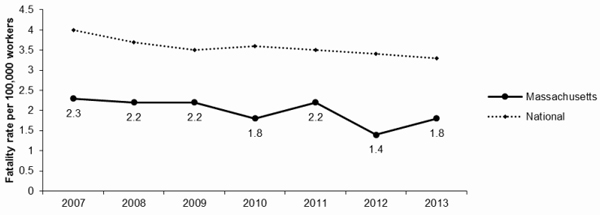
Prepared by AFL-CIO Safety and Health Department, April 2015
MICHIGAN
Worker Safety and Health
| Number of employees:1 | 4,018,602 | |
| Number of establishments:1 | 238,017 | |
| State or federal OSHA Program:2 | State | |
| Number of workplace fatalities, 2013:3 | 135 | |
| Rate per 100,000 workers:4 | 3.3 | |
| National Rate: | 3.3 | |
| Ranking of state fatality rate, 2013:5 | 26 | |
| Total cases of workplace injuries and illnesses, private industry, 2013:6 | 100,300 | |
| Rate per 100 workers: | 3.7 | |
| National Rate: | 3.3 | |
| Total injury and illness cases with days away from work, job transfer or restriction, private industry, 2013:7 | 49,900 | |
| Rate per 100 workers: | 1.8 | |
| National Rate: | 1.7 | |
| Number of workplace safety and health inspectors, FY 2015:8 | 62 | |
| Length of time it would take for OSHA to inspect each workplace once: | 50 yrs. | |
| Number of workplace safety and health inspections conducted, FY 2014:9 | 4,762 | |
| Construction: | 2,980 | |
| Non-construction: | 1,782 | |
| Average penalty assessed for serious violations of the OSH Act, FY 2014:9 | $585 | |
| National average: | $1,972 | |
| Average total penalty per fatality investigation, FY 2014:10 | $4,856 | |
| National average: | $10,640 |
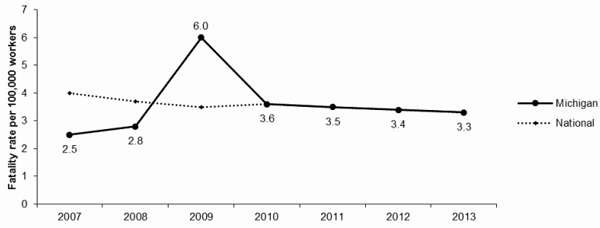
Prepared by AFL-CIO Safety and Health Department, April 2015
MINNESOTA
Worker Safety and Health
| Number of employees:1 | 4,018,602 | |
| Number of establishments:1 | 238,017 | |
| State or federal OSHA Program:2 | State | |
| Number of workplace fatalities, 2013:3 | 135 | |
| Rate per 100,000 workers:4 | 3.3 | |
| National Rate: | 3.3 | |
| Ranking of state fatality rate, 2013:5 | 26 | |
| Total cases of workplace injuries and illnesses, private industry, 2013:6 | 100,300 | |
| Rate per 100 workers: | 3.7 | |
| National Rate: | 3.3 | |
| Total injury and illness cases with days away from work, job transfer or restriction, private industry, 2013:7 | 49,900 | |
| Rate per 100 workers: | 1.8 | |
| National Rate: | 1.7 | |
| Number of workplace safety and health inspectors, FY 2015:8 | 62 | |
| Length of time it would take for OSHA to inspect each workplace once: | 50 yrs. | |
| Number of workplace safety and health inspections conducted, FY 2014:9 | 4,762 | |
| Construction: | 2,980 | |
| Non-construction: | 1,782 | |
| Average penalty assessed for serious violations of the OSH Act, FY 2014:9 | $585 | |
| National average: | $1,972 | |
| Average total penalty per fatality investigation, FY 2014:10 | $4,856 | |
| National average: | $10,640 |
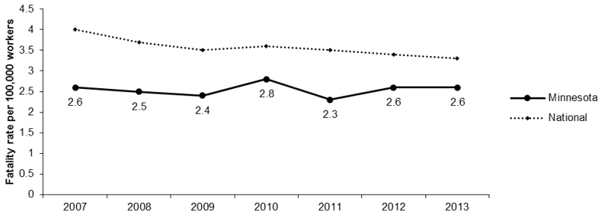
Prepared by AFL-CIO Safety and Health Department, April 2015
MISSISSIPPI
Worker Safety and Health
| Number of employees:1 | 1,093,581 | |
| Number of establishments:1 | 70,337 | |
| State or federal OSHA Program:2 | Federal | |
| Number of state and local public employees not covered by the OSH Act: | 212,465 | |
| Number of workplace fatalities, 2013:3 | 68 | |
| Rate per 100,000 workers:4 | 6.2 | |
| National Rate: | 3.3 | |
| Ranking of state fatality rate, 2013:5 | 44 | |
| Total cases of workplace injuries and illnesses, private industry, 2013:6 | N/A | |
| Rate per 100 workers: | N/A | |
| National Rate: | 3.3 | |
| Total injury and illness cases with days away from work, job transfer or restriction, private industry, 2013:7 | N/A | |
| Rate per 100 workers: | N/A | |
| National Rate: | 1.7 | |
| Number of workplace safety and health inspectors, FY 2015:8 | 12 | |
| Length of time it would take for OSHA to inspect each workplace once: | 122 yrs | |
| Number of workplace safety and health inspections conducted, FY 2014:9 | 553 | |
| Construction: | 253 | |
| Non-construction: | 300 | |
| Average penalty assessed for serious violations of the OSH Act, FY 2014:9 | $1,726 | |
| National average: | $1,972 | |
| Average total penalty per fatality investigation, FY 2014:10 | $12,595 | |
| National average: | $10,640 |
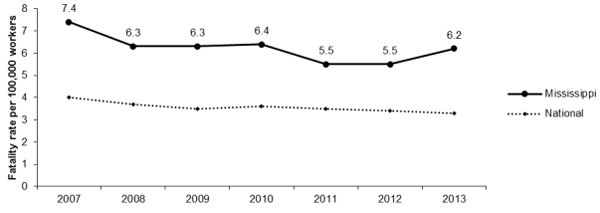
Prepared by AFL-CIO Safety and Health Department, April 2015
MISSOURI
Worker Safety and Health
| Number of employees:1 | 2,637,273 | |
| Number of establishments:1 | 180,695 | |
| State or federal OSHA Program:2 | Federal | |
| Number of state and local public employees not covered by the OSH Act: | 363,318 | |
| Number of workplace fatalities, 2013:3 | 118 | |
| Rate per 100,000 workers:4 | 4.3 | |
| National Rate: | 3.3 | |
| Ranking of state fatality rate, 2013:5 | 34 | |
| Total cases of workplace injuries and illnesses, private industry, 2013:6 | 58,300 | |
| Rate per 100 workers: | 3.2 | |
| National Rate: | 3.3 | |
| Total injury and illness cases with days away from work, job transfer or restriction, private industry, 2013:7 | 28,600 | |
| Rate per 100 workers: | 1.6 | |
| National Rate: | 1.7 | |
| Number of workplace safety and health inspectors, FY 2015:8 | 14 | |
| Length of time it would take for OSHA to inspect each workplace once: | 133 yrs | |
| Number of workplace safety and health inspections conducted, FY 2014:9 | 1,300 | |
| Construction: | 234 | |
| Non-construction: | 1,066 | |
| Average penalty assessed for serious violations of the OSH Act, FY 2014:9 | $1,877 | |
| National average: | $1,972 | |
| Average total penalty per fatality investigation, FY 2014:10 | $47,210 | |
| National average: | $10,640 |
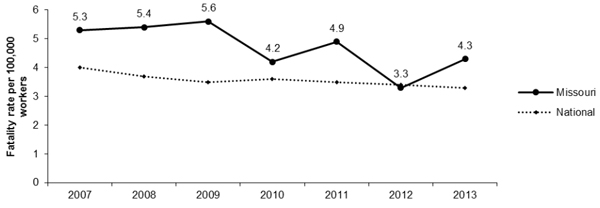
Prepared by AFL-CIO Safety and Health Department, April 2015
MONTANA
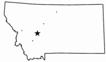
Worker Safety and Health
| Number of employees:1 | 436,867 | |
| Number of establishments:1 | 43,124 | |
| State or federal OSHA Program:2 | Federal | |
| Number of state and local public employees not covered by the OSH Act: | 99,023 | |
| Number of workplace fatalities, 2013:3 | 28 | |
| Rate per 100,000 workers:4 | 5.8 | |
| National Rate: | 3.3 | |
| Ranking of state fatality rate, 2013:5 | 42 | |
| Total cases of workplace injuries and illnesses, private industry, 2013:6 | 13,000 | |
| Rate per 100 workers: | 4.7 | |
| National Rate: | 3.3 | |
| Total injury and illness cases with days away from work, job transfer or restriction, private industry, 2013:7 | 5,700 | |
| Rate per 100 workers: | 2.1 | |
| National Rate: | 1.7 | |
| Number of workplace safety and health inspectors, FY 2015:8 | 5 | |
| Length of time it would take for OSHA to inspect each workplace once: | 120 yrs | |
| Number of workplace safety and health inspections conducted, FY 2014:9 | 348 | |
| Construction: | 213 | |
| Non-construction: | 135 | |
| Average penalty assessed for serious violations of the OSH Act, FY 2014:9 | $1,938 | |
| National average: | $1,972 | |
| Average total penalty per fatality investigation, FY 2014:10 | $7,230 | |
| National average: | $10,640 |
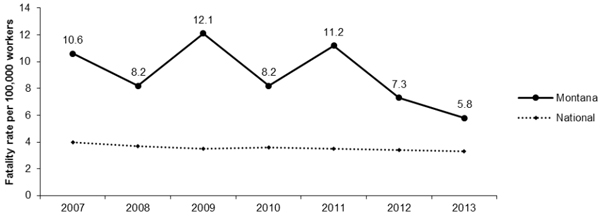
Prepared by AFL-CIO Safety and Health Department, April 2015
NEBRASKA
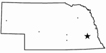
Worker Safety and Health
| Number of employees:1 | 932,768 | |
| Number of establishments:1 | 69,072 | |
| State or federal OSHA Program:2 | Federal | |
| Number of state and local public employees not covered by the OSH Act: | 141,159 | |
| Number of workplace fatalities, 2013:3 | 39 | |
| Rate per 100,000 workers:4 | 4.0 | |
| National Rate: | 3.3 | |
| Ranking of state fatality rate, 2013:5 | 31 | |
| Total cases of workplace injuries and illnesses, private industry, 2013:6 | 24,700 | |
| Rate per 100 workers: | 3.8 | |
| National Rate: | 3.3 | |
| Total injury and illness cases with days away from work, job transfer or restriction, private industry, 2013:7 | 11,700 | |
| Rate per 100 workers: | 1.8 | |
| National Rate: | 1.7 | |
| Number of workplace safety and health inspectors, FY 2015:8 | 9 | |
| Length of time it would take for OSHA to inspect each workplace once: | 163 yrs | |
| Number of workplace safety and health inspections conducted, FY 2014:9 | 406 | |
| Construction: | 147 | |
| Non-construction: | 259 | |
| Average penalty assessed for serious violations of the OSH Act, FY 2014:9 | $2,569 | |
| National average: | $1,972 | |
| Average total penalty per fatality investigation, FY 2014:10 | $22,389 | |
| National average: | $10,640 |
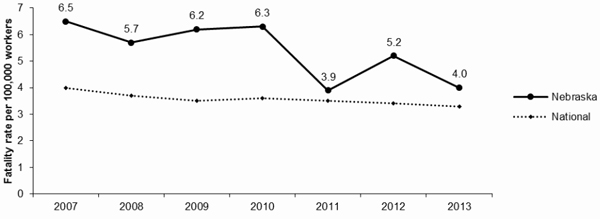
Prepared by AFL-CIO Safety and Health Department, April 2015
NEVADA

Worker Safety and Health
| Number of employees:1 | 1,160,115 | |
| Number of establishments:1 | 74,364 | |
| State or federal OSHA Program:2 | State | |
| Number of workplace fatalities, 2013:3 | 42 | |
| Rate per 100,000 workers:4 | 3.0 | |
| National Rate: | 3.3 | |
| Ranking of state fatality rate, 2013:5 | 20 | |
| Total cases of workplace injuries and illnesses, private industry, 2013:6 | 32,700 | |
| Rate per 100 workers: | 4.0 | |
| National Rate: | 3.3 | |
| Total injury and illness cases with days away from work, job transfer or restriction, private industry, 2013:7 | 17,500 | |
| Rate per 100 workers: | 2.1 | |
| National Rate: | 1.7 | |
| Number of workplace safety and health inspectors, FY 2015:8 | 44 | |
| Length of time it would take for OSHA to inspect each workplace once: | 43 yrs. | |
| Number of workplace safety and health inspections conducted, FY 2014:9 | 1,708 | |
| Construction: | 666 | |
| Non-construction: | 1,042 | |
| Average penalty assessed for serious violations of the OSH Act, FY 2014:9 | $2,244 | |
| National average: | $1,972 | |
| Average total penalty per fatality investigation, FY 2014:10 | $7,149 | |
| National average: | $10,640 |
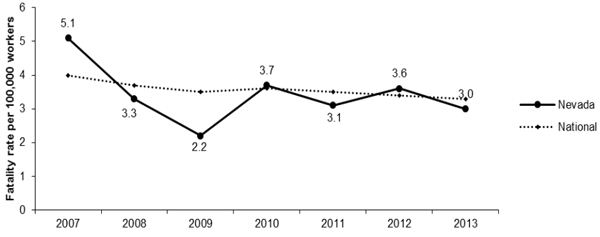
Prepared by AFL-CIO Safety and Health Department, April 2015
NEW HAMPSHIRE

Worker Safety and Health
| Number of employees:1 | 618,781 | |
| Number of establishments:1 | 9,330 | |
| State or federal OSHA Program:2 | Federal | |
| Number of state and local public employees not covered by the OSH Act: | 77,333 | |
| Number of workplace fatalities, 2013:3 | 14 | |
| Rate per 100,000 workers:4 | 2.1 | |
| National Rate: | 3.3 | |
| Ranking of state fatality rate, 2013:5 | 5 | |
| Total cases of workplace injuries and illnesses, private industry, 2013:6 | N/A | |
| Rate per 100 workers: | N/A | |
| National Rate: | 3.3 | |
| Total injury and illness cases with days away from work, job transfer or restriction, private industry, 2013:7 | N/A | |
| Rate per 100 workers: | N/A | |
| National Rate: | 1.7 | |
| Number of workplace safety and health inspectors, FY 2015:8 | 8 | |
| Length of time it would take for OSHA to inspect each workplace once: | 135 yrs | |
| Number of workplace safety and health inspections conducted, FY 2014:9 | 350 | |
| Construction: | 190 | |
| Non-construction: | 160 | |
| Average penalty assessed for serious violations of the OSH Act, FY 2014:9 | $2,113 | |
| National average: | $1,972 | |
| Average total penalty per fatality investigation, FY 2014:10 | $4,200 | |
| National average: | $10,640 |
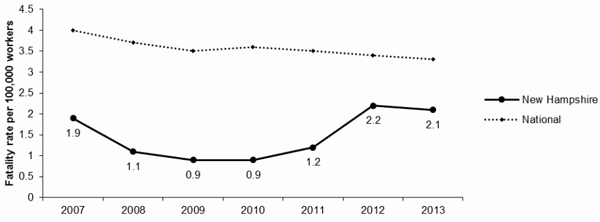
Prepared by AFL-CIO Safety and Health Department, April 2015
NEW JERSEY
Worker Safety and Health
| Number of employees:1 | 3,812,940 | |
| Number of establishments:1 | 256,499 | |
| State or federal OSHA Program:2 | Federal | |
| Number of workplace fatalities, 2013:3 | 102 | |
| Rate per 100,000 workers:4 | 2.6 | |
| National Rate: | 3.3 | |
| Ranking of state fatality rate, 2013:5 | 11 | |
| Total cases of workplace injuries and illnesses, private industry, 2013:6 | 78,000 | |
| Rate per 100 workers: | 2.9 | |
| National Rate: | 3.3 | |
| Total injury and illness cases with days away from work, job transfer or restriction, private industry, 2013:7 | 41,000 | |
| Rate per 100 workers: | 1.5 | |
| National Rate: | 1.7 | |
| Number of workplace safety and health inspectors, FY 2015:8 | 59 | |
| Length of time it would take for OSHA to inspect each workplace once: | 86 yrs. | |
| Number of workplace safety and health inspections conducted, FY 2014:9 | 2,995 | |
| Construction: | 516 | |
| Non-construction: | 2,479 | |
| Average penalty assessed for serious violations of the OSH Act, FY 2014:9 | $2,176 | |
| National average: | $1,972 | |
| Average total penalty per fatality investigation, FY 2014:10 | $10,179 | |
| National average: | $10,640 |
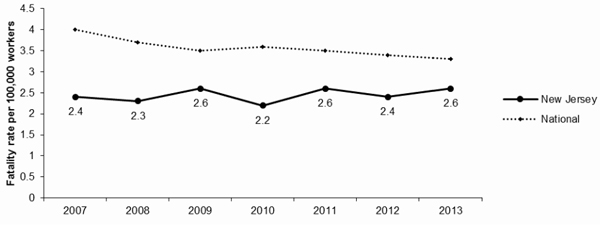
Prepared by AFL-CIO Safety and Health Department, April 2015
NEW MEXICO
Worker Safety and Health
| Number of employees:1 | 791,804 | |
| Number of establishments:1 | 55,299 | |
| State or federal OSHA Program:2 | State | |
| Number of workplace fatalities, 2013:3 | 54 | |
| Rate per 100,000 workers:4 | 6.7 | |
| National Rate: | 3.3 | |
| Ranking of state fatality rate, 2013:5 | 46 | |
| Total cases of workplace injuries and illnesses, private industry, 2013:6 | 16,800 | |
| Rate per 100 workers: | 3.2 | |
| National Rate: | 3.3 | |
| Total injury and illness cases with days away from work, job transfer or restriction, private industry, 2013:7 | 8,100 | |
| Rate per 100 workers: | 1.5 | |
| National Rate: | 1.7 | |
| Number of workplace safety and health inspectors, FY 2015:8 | 8 | |
| Length of time it would take for OSHA to inspect each workplace once: | 129 yrs. | |
| Number of workplace safety and health inspections conducted, FY 2014:9 | 420 | |
| Construction: | 228 | |
| Non-construction: | 192 | |
| Average penalty assessed for serious violations of the OSH Act, FY 2014:9 | $879 | |
| National average: | $1,972 | |
| Average total penalty per fatality investigation, FY 2014:10 | $2,592 | |
| National average: | $10,640 |
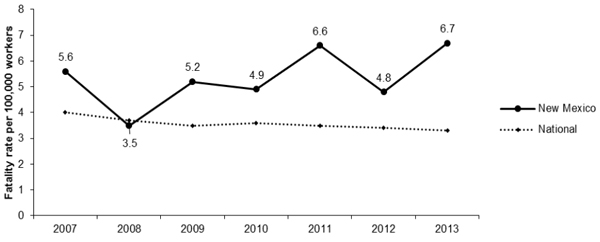
Prepared by AFL-CIO Safety and Health Department, April 2015
NEW YORK
| Number of employees:1 | 8,685,758 | |
| Number of establishments:1 | 609,706 | |
| State or federal OSHA Program:2 | Federal | |
| Number of workplace fatalities, 2013:3 | 178 | |
| Rate per 100,000 workers:4 | 2.1 | |
| National Rate: | 3.3 | |
| Ranking of state fatality rate, 2013:5 | 5 | |
| Total cases of workplace injuries and illnesses, private industry, 2013:6 | 143,400 | |
| Rate per 100 workers: | 2.4 | |
| National Rate: | 3.3 | |
| Total injury and illness cases with days away from work, job transfer or restriction, private industry, 2013:7 | 81,100 | |
| Rate per 100 workers: | 1.4 | |
| National Rate: | 1.7 | |
| Number of workplace safety and health inspectors, FY 2015:8 | 100 | |
| Length of time it would take for OSHA to inspect each workplace once: | 131 yrs. | |
| Number of workplace safety and health inspections conducted, FY 2014:9 | 4,638 | |
| Construction: | 1,649 | |
| Non-construction: | 2,989 | |
| Average penalty assessed for serious violations of the OSH Act, FY 2014:9 | $1,907 | |
| National average: | $1,972 | |
| Average total penalty per fatality investigation, FY 2014:10 | $8,513 | |
| National average: | $10,640 |
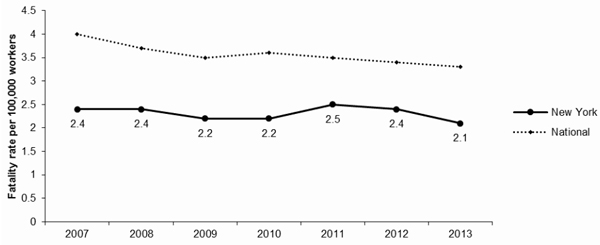
Prepared by AFL-CIO Safety and Health Department, April 2015
NORTH CAROLINA

Worker Safety and Health
| Number of employees:1 | 3,974,937 | |
| Number of establishments:1 | 256,033 | |
| State or federal OSHA Program:2 | State | |
| Number of workplace fatalities, 2013:3 | 109 | |
| Rate per 100,000 workers:4 | 2.5 | |
| National Rate: | 3.3 | |
| Ranking of state fatality rate, 2013:5 | 10 | |
| Total cases of workplace injuries and illnesses, private industry, 2013:6 | 71,500 | |
| Rate per 100 workers: | 2.7 | |
| National Rate: | 3.3 | |
| Total injury and illness cases with days away from work, job transfer or restriction, private industry, 2013:7 | 36,700 | |
| Rate per 100 workers: | 1.4 | |
| National Rate: | 1.7 | |
| Number of workplace safety and health inspectors, FY 2015:8 | 96 | |
| Length of time it would take for OSHA to inspect each workplace once: | 79 yrs. | |
| Number of workplace safety and health inspections conducted, FY 2014:9 | 3,229 | |
| Construction: | 1,394 | |
| Non-construction: | 1,835 | |
| Average penalty assessed for serious violations of the OSH Act, FY 2014:9 | $1,250 | |
| National average: | $1,972 | |
| Average total penalty per fatality investigation, FY 2014:10 | $2,941 | |
| National average: | $10,640 |
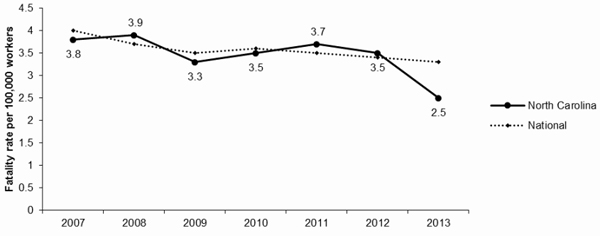
Prepared by AFL-CIO Safety and Health Department, April 2015
NORTH DAKOTA
Worker Safety and Health
| Number of employees:1 | 427,108 | |
| Number of establishments:1 | 30,746 | |
| State or federal OSHA Program:2 | Federal | |
| Number of state and local public employees not covered by the OSH Act: | 58,524 | |
| Number of workplace fatalities, 2013:3 | 56 | |
| Rate per 100,000 workers:4 | 14.9 | |
| National Rate: | 3.3 | |
| Ranking of state fatality rate, 2013:5 | 50 | |
| Total cases of workplace injuries and illnesses, private industry, 2013:6 | N/A | |
| Rate per 100 workers: | N/A | |
| National Rate: | 3.3 | |
| Total injury and illness cases with days away from work, job transfer or restriction, private industry, 2013:7 | N/A | |
| Rate per 100 workers: | N/A | |
| National Rate: | 1.7 | |
| Number of workplace safety and health inspectors, FY 2015:8 | 8 | |
| Length of time it would take for OSHA to inspect each workplace once: | 126 yrs | |
| Number of workplace safety and health inspections conducted, FY 2014:9 | 232 | |
| Construction: | 120 | |
| Non-construction: | 112 | |
| Average penalty assessed for serious violations of the OSH Act, FY 2014:9 | $2,659 | |
| National average: | $1,972 | |
| Average total penalty per fatality investigation, FY 2014:10 | $4,530 | |
| National average: | $10,640 |
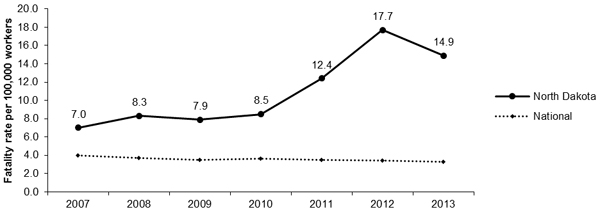
Prepared by AFL-CIO Safety and Health Department, April 2015
OHIO
Worker Safety and Health
| Number of employees:1 | 5,110,011 | |
| Number of establishments:1 | 288,453 | |
| State or federal OSHA Program:2 | Federal | |
| Number of state and local public employees not covered by the OSH Act: | 629,338 | |
| Number of workplace fatalities, 2013:3 | 149 | |
| Rate per 100,000 workers:4 | 3.0 | |
| National Rate: | 3.3 | |
| Ranking of state fatality rate, 2013:5 | 20 | |
| Total cases of workplace injuries and illnesses, private industry, 2013:6 | 106,700 | |
| Rate per 100 workers: | 2.9 | |
| National Rate: | 3.3 | |
| Total injury and illness cases with days away from work, job transfer or restriction, private industry, 2013:7 | 55,200 | |
| Rate per 100 workers: | 1.4 | |
| National Rate: | 1.7 | |
| Number of workplace safety and health inspectors, FY 2015:8 | 59 | |
| Length of time it would take for OSHA to inspect each workplace once: | 122 yrs | |
| Number of workplace safety and health inspections conducted, FY 2014:9 | 2,261 | |
| Construction: | 1,071 | |
| Non-construction: | 1,190 | |
| Average penalty assessed for serious violations of the OSH Act, FY 2014:9 | $2,299 | |
| National average: | $1,972 | |
| Average total penalty per fatality investigation, FY 2014:10 | $10,560 | |
| National average: | $10,640 |
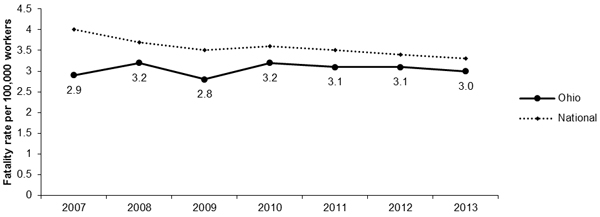
Prepared by AFL-CIO Safety and Health Department, April 2015
OKLAHOMA
Worker Safety and Health
| Number of employees:1 | 1,560,799 | |
| Number of establishments:1 | 105,779 | |
| State or federal OSHA Program:2 | Federal | |
| Number of state and local public employees not covered by the OSH Act: | 272,632 | |
| Number of workplace fatalities, 2013:3 | 92 | |
| Rate per 100,000 workers:4 | 5.8 | |
| National Rate: | 3.3 | |
| Ranking of state fatality rate, 2013:5 | 42 | |
| Total cases of workplace injuries and illnesses, private industry, 2013:6 | N/A | |
| Rate per 100 workers: | N/A | |
| National Rate: | 3.3 | |
| Total injury and illness cases with days away from work, job transfer or restriction, private industry, 2013:7 | N/A | |
| Rate per 100 workers: | N/A | |
| National Rate: | 1.7 | |
| Number of workplace safety and health inspectors, FY 2015:8 | 18 | |
| Length of time it would take for OSHA to inspect each workplace once: | 138 yrs | |
| Number of workplace safety and health inspections conducted, FY 2014:9 | 732 | |
| Construction: | 385 | |
| Non-construction: | 347 | |
| Average penalty assessed for serious violations of the OSH Act, FY 2014:9 | $1,880 | |
| National average: | $1,972 | |
| Average total penalty per fatality investigation, FY 2014:10 | $5,117 | |
| National average: | $10,640 |
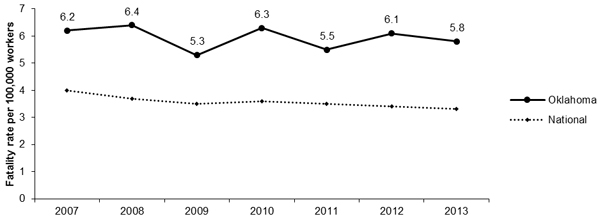
Prepared by AFL-CIO Safety and Health Department, April 2015
OREGON
Worker Safety and Health
| Number of employees:1 | 1,678,726 | |
| Number of establishments:1 | 131,213 | |
| State or federal OSHA Program:2 | State | |
| Number of workplace fatalities, 2013:3 | 49 | |
| Rate per 100,000 workers:4 | 2.9 | |
| National Rate: | 3.3 | |
| Ranking of state fatality rate, 2013:5 | 18 | |
| Total cases of workplace injuries and illnesses, private industry, 2013:6 | 45,200 | |
| Rate per 100 workers: | 4.1 | |
| National Rate: | 3.3 | |
| Total injury and illness cases with days away from work, job transfer or restriction, private industry, 2013:7 | 24,100 | |
| Rate per 100 workers: | 2.2 | |
| National Rate: | 1.7 | |
| Number of workplace safety and health inspectors, FY 2015:8 | 72 | |
| Length of time it would take for OSHA to inspect each workplace once: | 31 yrs. | |
| Number of workplace safety and health inspections conducted, FY 2014:9 | 4,241 | |
| Construction: | 1,227 | |
| Non-construction: | 3,014 | |
| Average penalty assessed for serious violations of the OSH Act, FY 2014:9 | $364 | |
| National average: | $1,972 | |
| Average total penalty per fatality investigation, FY 2014:10 | $1,897 | |
| National average: | $10,640 |
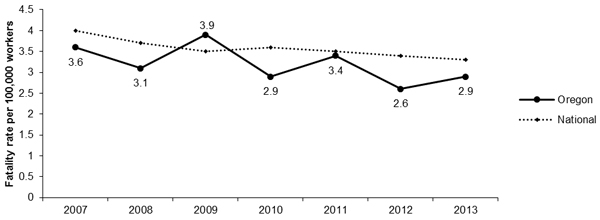
Prepared by AFL-CIO Safety and Health Department, April 2015
PENNSYLVANIA
Worker Safety and Health
| Number of employees:1 | 5,596,841 | |
| Number of establishments:1 | 340,579 | |
| State or federal OSHA Program:2 | Federal | |
| Number of state and local public employees not covered by the OSH Act: | 594,664 | |
| Number of workplace fatalities, 2013:3 | 183 | |
| Rate per 100,000 workers:4 | 3.2 | |
| National Rate: | 3.3 | |
| Ranking of state fatality rate, 2013:5 | 24 | |
| Total cases of workplace injuries and illnesses, private industry, 2013:6 | 156,600 | |
| Rate per 100 workers: | 3.9 | |
| National Rate: | 3.3 | |
| Total injury and illness cases with days away from work, job transfer or restriction, private industry, 2013:7 | 80,100 | |
| Rate per 100 workers: | 2.0 | |
| National Rate: | 1.7 | |
| Number of workplace safety and health inspectors, FY 2015:8 | 56 | |
| Length of time it would take for OSHA to inspect each workplace once: | 123 yrs | |
| Number of workplace safety and health inspections conducted, FY 2014:9 | 2,667 | |
| Construction: | 1,334 | |
| Non-construction: | 1,333 | |
| Average penalty assessed for serious violations of the OSH Act, FY 2014:9 | $1,796 | |
| National average: | $1,972 | |
| Average total penalty per fatality investigation, FY 2014:10 | $7,465 | |
| National average: | $10,640 |
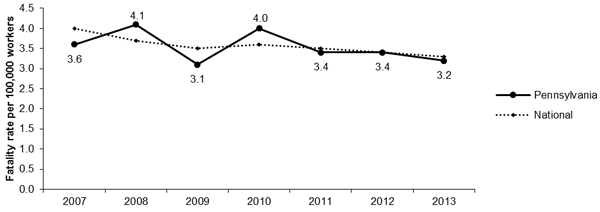
Prepared by AFL-CIO Safety and Health Department, April 2015
RHODE ISLAND
Worker Safety and Health
| Number of employees:1 | 456,112 | |
| Number of establishments:1 | 35,457 | |
| State or federal OSHA Program:2 | Federal | |
| Number of state and local public employees not covered by the OSH Act: | 48,503 | |
| Number of workplace fatalities, 2013:3 | 10 | |
| Rate per 100,000 workers:4 | 2.1 | |
| National Rate: | 3.3 | |
| Ranking of state fatality rate, 2013:5 | 5 | |
| Total cases of workplace injuries and illnesses, private industry, 2013:6 | N/A | |
| Rate per 100 workers: | N/A | |
| National Rate: | 3.3 | |
| Total injury and illness cases with days away from work, job transfer or restriction, private industry, 2013:7 | N/A | |
| Rate per 100 workers: | N/A | |
| National Rate: | 1.7 | |
| Number of workplace safety and health inspectors, FY 2015:8 | 6 | |
| Length of time it would take for OSHA to inspect each workplace once: | 118 yrs | |
| Number of workplace safety and health inspections conducted, FY 2014:9 | 297 | |
| Construction: | 167 | |
| Non-construction: | 130 | |
| Average penalty assessed for serious violations of the OSH Act, FY 2014:9 | $1,895 | |
| National average: | $1,972 | |
| Average total penalty per fatality investigation, FY 2014:10 | $667 | |
| National average: | $10,640 |
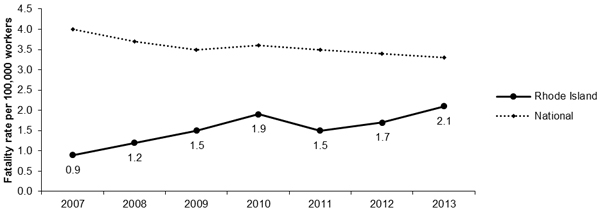
Prepared by AFL-CIO Safety and Health Department, April 2015
SOUTH CAROLINA

Worker Safety and Health
| Number of employees:1 | 1,846,621 | |
| Number of establishments:1 | 116,906 | |
| State or federal OSHA Program:2 | State | |
| Number of workplace fatalities, 2013:3 | 75 | |
| Rate per 100,000 workers:4 | 3.9 | |
| National Rate: | 3.3 | |
| Ranking of state fatality rate, 2013:5 | 30 | |
| Total cases of workplace injuries and illnesses, private industry, 2013:6 | 35,300 | |
| Rate per 100 workers: | 2.9 | |
| National Rate: | 3.3 | |
| Total injury and illness cases with days away from work, job transfer or restriction, private industry, 2013:7 | 18,600 | |
| Rate per 100 workers: | 1.5 | |
| National Rate: | 1.7 | |
| Number of workplace safety and health inspectors, FY 2015:8 | 22 | |
| Length of time it would take for OSHA to inspect each workplace once: | 118 yrs. | |
| Number of workplace safety and health inspections conducted, FY 2014:9 | 978 | |
| Construction: | 619 | |
| Non-construction: | 359 | |
| Average penalty assessed for serious violations of the OSH Act, FY 2014:9 | $521 | |
| National average: | $1,972 | |
| Average total penalty per fatality investigation, FY 2014:10 | $1,912 | |
| National average: | $10,640 |
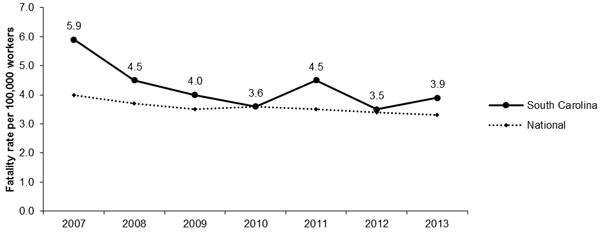
Prepared by AFL-CIO Safety and Health Department, April 2015
SOUTH DAKOTA
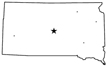
Worker Safety and Health
| Number of employees:1 | 404,652 | |
| Number of establishments:1 | 311,686 | |
| State or federal OSHA Program:2 | Federal | |
| Number of state and local public employees not covered by the OSH Act: | 60,219 | |
| Number of workplace fatalities, 2013:3 | 20 | |
| Rate per 100,000 workers:4 | 4.7 | |
| National Rate: | 3.3 | |
| Ranking of state fatality rate, 2013:5 | 38 | |
| Total cases of workplace injuries and illnesses, private industry, 2013:6 | N/A | |
| Rate per 100 workers: | N/A | |
| National Rate: | 3.3 | |
| Total injury and illness cases with days away from work, job transfer or restriction, private industry, 2013:7 | N/A | |
| Rate per 100 workers: | N/A | |
| National Rate: | 1.7 | |
| Number of workplace safety and health inspectors, FY 2015:8 | N/A | |
| Length of time it would take for OSHA to inspect each workplace once: | 280 yrs | |
| Number of workplace safety and health inspections conducted, FY 2014:9 | 57 | |
| Construction: | 30 | |
| Non-construction: | 27 | |
| Average penalty assessed for serious violations of the OSH Act, FY 2014:9 | $2,309 | |
| National average: | $1,972 | |
| Average total penalty per fatality investigation, FY 2014:10 | $23,390 | |
| National average: | $10,640 |
Prepared by AFL-CIO Safety and Health Department, April 2015
TENNESSEE
![]()
Worker Safety and Health
| Number of employees:1 | 2,694,288 | |
| Number of establishments:1 | 143,465 | |
| State or federal OSHA Program:2 | State | |
| Number of workplace fatalities, 2013:3 | 95 | |
| Rate per 100,000 workers:4 | 3.6 | |
| National Rate: | 3.3 | |
| Ranking of state fatality rate, 2013:5 | 29 | |
| Total cases of workplace injuries and illnesses, private industry, 2013:6 | 62,900 | |
| Rate per 100 workers: | 3.3 | |
| National Rate: | 3.3 | |
| Total injury and illness cases with days away from work, job transfer or restriction, private industry, 2013:7 | 30,600 | |
| Rate per 100 workers: | 1.6 | |
| National Rate: | 1.7 | |
| Number of workplace safety and health inspectors, FY 2015:8 | 34 | |
| Length of time it would take for OSHA to inspect each workplace once: | 85 yrs. | |
| Number of workplace safety and health inspections conducted, FY 2014:9 | 1,678 | |
| Construction: | 441 | |
| Non-construction: | 1,237 | |
| Average penalty assessed for serious violations of the OSH Act, FY 2014:9 | $687 | |
| National average: | $1,972 | |
| Average total penalty per fatality investigation, FY 2014:10 | $13,890 | |
| National average: | $10,640 |
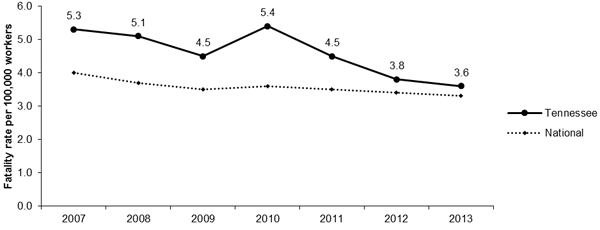
Prepared by AFL-CIO Safety and Health Department, April 2015
TEXAS
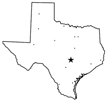
Worker Safety and Health
| Number of employees:1 | 11,031,907 | |
| Number of establishments:1 | 610,152 | |
| State or federal OSHA Program:2 | Federal | |
| Number of state and local public employees not covered by the OSH Act: | 1,571,495 | |
| Number of workplace fatalities, 2013:3 | 508 | |
| Rate per 100,000 workers:4 | 4.4 | |
| National Rate: | 3.3 | |
| Ranking of state fatality rate, 2013:5 | 36 | |
| Total cases of workplace injuries and illnesses, private industry, 2013:6 | 198,800 | |
| Rate per 100 workers: | 2.6 | |
| National Rate: | 3.3 | |
| Total injury and illness cases with days away from work, job transfer or restriction, private industry, 2013:7 | 107,400 | |
| Rate per 100 workers: | 1.4 | |
| National Rate: | 1.7 | |
| Number of workplace safety and health inspectors, FY 2015:8 | 100 | |
| Length of time it would take for OSHA to inspect each workplace once: | 155 yrs | |
| Number of workplace safety and health inspections conducted, FY 2014:9 | 3,845 | |
| Construction: | 2,172 | |
| Non-construction: | 1,673 | |
| Average penalty assessed for serious violations of the OSH Act, FY 2014:9 | $2,154 | |
| National average: | $1,972 | |
| Average total penalty per fatality investigation, FY 2014:10 | $9,593 | |
| National average: | $10,640 |
Prepared by AFL-CIO Safety and Health Department, April 2015
UTAH
Worker Safety and Health
| Number of employees:1 | 1,254,582 | |
| Number of establishments:1 | 87,524 | |
| State or federal OSHA Program:2 | State | |
| Number of workplace fatalities, 2013:3 | 37 | |
| Rate per 100,000 workers:4 | 2.9 | |
| National Rate: | 3.3 | |
| Ranking of state fatality rate, 2013:5 | 18 | |
| Total cases of workplace injuries and illnesses, private industry, 2013:6 | 27,500 | |
| Rate per 100 workers: | 3.4 | |
| National Rate: | 3.3 | |
| Total injury and illness cases with days away from work, job transfer or restriction, private industry, 2013:7 | 13,000 | |
| Rate per 100 workers: | 1.6 | |
| National Rate: | 1.7 | |
| Number of workplace safety and health inspectors, FY 2015:8 | 19 | |
| Length of time it would take for OSHA to inspect each workplace once: | 118 yrs. | |
| Number of workplace safety and health inspections conducted, FY 2014:9 | 735 | |
| Construction: | 348 | |
| Non-construction: | 387 | |
| Average penalty assessed for serious violations of the OSH Act, FY 2014:9 | $1,173 | |
| National average: | $1,972 | |
| Average total penalty per fatality investigation, FY 2014:10 | $1,750 | |
| National average: | $10,640 |
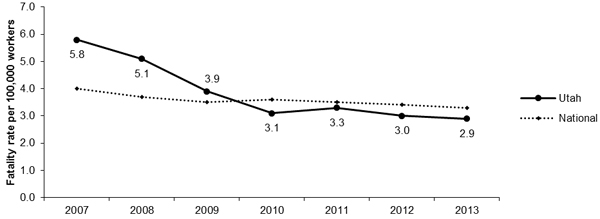
Prepared by AFL-CIO Safety and Health Department, April 2015
VERMONT
Worker Safety and Health
| Number of employees:1 | 301,586 | |
| Number of establishments:1 | 24,433 | |
| State or federal OSHA Program:2 | State | |
| Number of workplace fatalities, 2013:3 | 7 | |
| Rate per 100,000 workers:4 | 2.2 | |
| National Rate: | 3.3 | |
| Ranking of state fatality rate, 2013:5 | 8 | |
| Total cases of workplace injuries and illnesses, private industry, 2013:6 | 10,300 | |
| Rate per 100 workers: | 5.2 | |
| National Rate: | 3.3 | |
| Total injury and illness cases with days away from work, job transfer or restriction, private industry, 2013:7 | 4,400 | |
| Rate per 100 workers: | 2.2 | |
| National Rate: | 1.7 | |
| Number of workplace safety and health inspectors, FY 2015:8 | 8 | |
| Length of time it would take for OSHA to inspect each workplace once: | 80 yrs. | |
| Number of workplace safety and health inspections conducted, FY 2014:9 | 298 | |
| Construction: | 141 | |
| Non-construction: | 157 | |
| Average penalty assessed for serious violations of the OSH Act, FY 2014:9 | $889 | |
| National average: | $1,972 | |
| Average total penalty per fatality investigation, FY 2014:10 | $5,460 | |
| National average: | $10,640 |
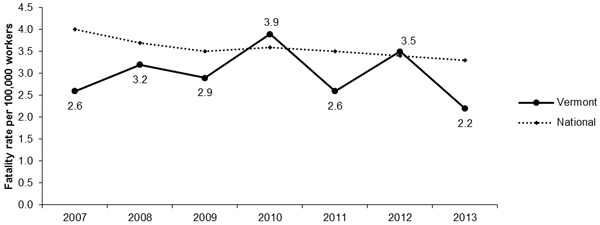
Prepared by AFL-CIO Safety and Health Department, April 2015
VIRGINIA

Worker Safety and Health
| Number of employees:1 | 3,640,209 | |
| Number of establishments:1 | 237,810 | |
| State or federal OSHA Program:2 | State | |
| Number of workplace fatalities, 2013:3 | 128 | |
| Rate per 100,000 workers:4 | 3.2 | |
| National Rate: | 3.3 | |
| Ranking of state fatality rate, 2013:5 | 24 | |
| Total cases of workplace injuries and illnesses, private industry, 2013:6 | 65,100 | |
| Rate per 100 workers: | 2.6 | |
| National Rate: | 3.3 | |
| Total injury and illness cases with days away from work, job transfer or restriction, private industry, 2013:7 | 34,200 | |
| Rate per 100 workers: | 1.4 | |
| National Rate: | 1.7 | |
| Number of workplace safety and health inspectors, FY 2015:8 | 51 | |
| Length of time it would take for OSHA to inspect each workplace once: | 84 yrs. | |
| Number of workplace safety and health inspections conducted, FY 2014:9 | 2,794 | |
| Construction: | 1,665 | |
| Non-construction: | 1,129 | |
| Average penalty assessed for serious violations of the OSH Act, FY 2014:9 | $660 | |
| National average: | $1,972 | |
| Average total penalty per fatality investigation, FY 2014:10 | $5,581 | |
| National average: | $10,640 |
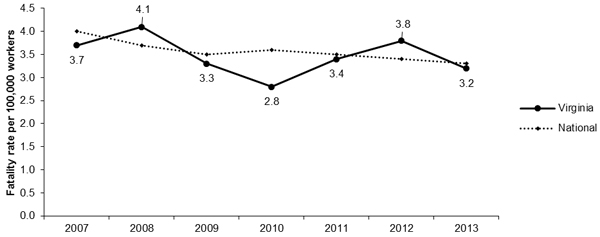
Prepared by AFL-CIO Safety and Health Department, April 2015
WASHINGTON
Worker Safety and Health
| Number of employees:1 | 2,960,123 | |
| Number of establishments:1 | 247,071 | |
| State or federal OSHA Program:2 | State | |
| Number of workplace fatalities, 2013:3 | 56 | |
| Rate per 100,000 workers:4 | 1.7 | |
| National Rate: | 3.3 | |
| Ranking of state fatality rate, 2013:5 | 2 | |
| Total cases of workplace injuries and illnesses, private industry, 2013:6 | 91,100 | |
| Rate per 100 workers: | 4.8 | |
| National Rate: | 3.3 | |
| Total injury and illness cases with days away from work, job transfer or restriction, private industry, 2013:7 | 48,500 | |
| Rate per 100 workers: | 2.5 | |
| National Rate: | 1.7 | |
| Number of workplace safety and health inspectors, FY 2015:8 | 110 | |
| Length of time it would take for OSHA to inspect each workplace once: | 49 yrs. | |
| Number of workplace safety and health inspections conducted, FY 2014:9 | 5,033 | |
| Construction: | 2,007 | |
| Non-construction: | 3,026 | |
| Average penalty assessed for serious violations of the OSH Act, FY 2014:9 | $896 | |
| National average: | $1,972 | |
| Average total penalty per fatality investigation, FY 2014:10 | $4,721 | |
| National average: | $10,640 |
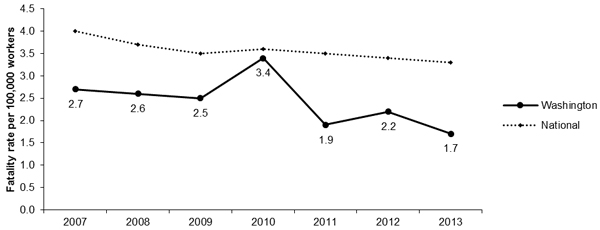
Prepared by AFL-CIO Safety and Health Department, April 2015
WEST VIRGINIA
Worker Safety and Health
| Number of employees:1 | 703,916 | |
| Number of establishments:1 | 49,625 | |
| State or federal OSHA Program:2 | Federal | |
| Number of state and local public employees not covered by the OSH Act: | 119,877 | |
| Number of workplace fatalities, 2013:3 | 6 | |
| Rate per 100,000 workers:4 | 8.6 | |
| National Rate: | 3.3 | |
| Ranking of state fatality rate, 2013:5 | 48 | |
| Total cases of workplace injuries and illnesses, private industry, 2013:6 | 17,600 | |
| Rate per 100 workers: | 3.7 | |
| National Rate: | 3.3 | |
| Total injury and illness cases with days away from work, job transfer or restriction, private industry, 2013:7 | 8,900 | |
| Rate per 100 workers: | 1.9 | |
| National Rate: | 1.7 | |
| Number of workplace safety and health inspectors, FY 2015:8 | 6 | |
| Length of time it would take for OSHA to inspect each workplace once: | 207 yrs | |
| Number of workplace safety and health inspections conducted, FY 2014:9 | 224 | |
| Construction: | 88 | |
| Non-construction: | 136 | |
| Average penalty assessed for serious violations of the OSH Act, FY 2014:9 | $1,685 | |
| National average: | $1,972 | |
| Average total penalty per fatality investigation, FY 2014:10 | $10,413 | |
| National average: | $10,640 |
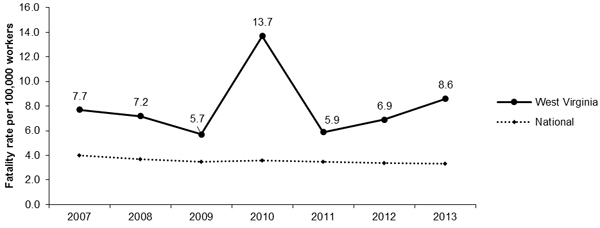
Prepared by AFL-CIO Safety and Health Department, April 2015
WISCONSIN
Worker Safety and Health
| Number of employees:1 | 2,721,960 | |
| Number of establishments:1 | 162,158 | |
| State or federal OSHA Program:2 | Federal | |
| Number of state and local public employees not covered by the OSH Act: | 349,154 | |
| Number of workplace fatalities, 2013:3 | 97 | |
| Rate per 100,000 workers:4 | 3.5 | |
| National Rate: | 3.3 | |
| Ranking of state fatality rate, 2013:5 | 27 | |
| Total cases of workplace injuries and illnesses, private industry, 2013:6 | 73,600 | |
| Rate per 100 workers: | 4.0 | |
| National Rate: | 3.3 | |
| Total injury and illness cases with days away from work, job transfer or restriction, private industry, 2013:7 | 35,800 | |
| Rate per 100 workers: | 1.9 | |
| National Rate: | 1.7 | |
| Number of workplace safety and health inspectors, FY 2015:8 | 36 | |
| Length of time it would take for OSHA to inspect each workplace once: | 107 yrs | |
| Number of workplace safety and health inspections conducted, FY 2014:9 | 1,449 | |
| Construction: | 606 | |
| Non-construction: | 843 | |
| Average penalty assessed for serious violations of the OSH Act, FY 2014:9 | $2,121 | |
| National average: | $1,972 | |
| Average total penalty per fatality investigation, FY 2014:10 | $25,373 | |
| National average: | $10,640 |
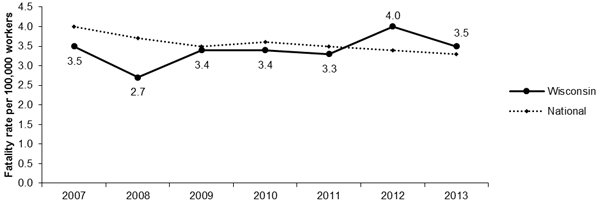
Prepared by AFL-CIO Safety and Health Department, April 2015
WYOMING

Worker Safety and Health
| Number of employees:1 | 279,748 | |
| Number of establishments:1 | 25,494 | |
| State or federal OSHA Program:2 | State | |
| Number of workplace fatalities, 2013:3 | 26 | |
| Rate per 100,000 workers:4 | 9.5 | |
| National Rate: | 3.3 | |
| Ranking of state fatality rate, 2013:5 | 49 | |
| Total cases of workplace injuries and illnesses, private industry, 2013:6 | 6,300 | |
| Rate per 100 workers: | 3.4 | |
| National Rate: | 3.3 | |
| Total injury and illness cases with days away from work, job transfer or restriction, private industry, 2013:7 | 3,100 | |
| Rate per 100 workers: | 1.6 | |
| National Rate: | 1.7 | |
| Number of workplace safety and health inspectors, FY 2015:8 | 9 | |
| Length of time it would take for OSHA to inspect each workplace once: | 115 yrs. | |
| Number of workplace safety and health inspections conducted, FY 2014:9 | 217 | |
| Construction: | 109 | |
| Non-construction: | 108 | |
| Average penalty assessed for serious violations of the OSH Act, FY 2014:9 | $1,911 | |
| National average: | $1,972 | |
| Average total penalty per fatality investigation, FY 2014:10 | $12,184 | |
| National average: | $10,640 |
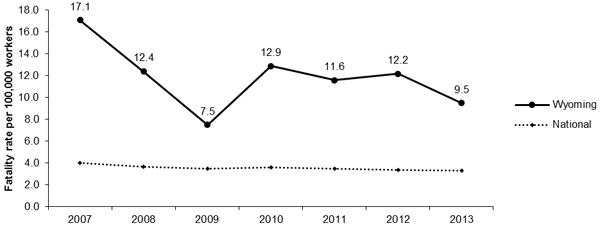
Prepared by AFL-CIO Safety and Health Department, April 2015
SOURCES AND METHODOLOGY FOR STATE PROFILES
Employment and Establishment Data: Employment and Wages, Annual Averages, 2013, Bureau of Labor Statistics, U.S. Department of Labor.
Coverage of State and Local Employees: OSHA coverage of state and local employees depends on whether the state has adopted and runs its own OSHA program. States that run their own OSHA programs are required, as a condition of gaining federal approval, to cover state and local employees. Public employees in the 25 states that do not run their own OSHA programs are not covered by the OSH Act. Statistics on the number of state and local employees are from Employment and Wages, Annual Averages, 2013.
Workplace Fatality Information: Census of Fatal Occupational Injuries, 2013, Bureau of Labor Statistics, U.S. Department of Labor. Rate reflects fatalities per 100,000 workers.
Private-Sector Injury and Illness Data: Survey of Occupational Injuries and Illnesses, 2013, Bureau of Labor Statistics, U.S. Department of Labor. Rate reflects injuries and illnesses per 100 workers.
Inspector Information: The number of federal OSHA inspectors comes from OSHA’s Directorate of Enforcement Programs records and reflects the number of inspectors, excluding supervisors and discrimination complaint inspectors. For the state-by-state profiles, inspectors are counted for the state in which the area office is located. Inspector data for state plan states is from OSHA's Directorate of Cooperative and State Programs, and reflects the number of “on board” inspectors included in the states’ FY 2015 state plan grant applications. The number of “on board” inspectors may not accurately reflect the true number of inspectors that are hired and in place conducting enforcement inspections due to possible budgetary and staffing changes in individual states. National total for inspectors includes inspectors from the Virgin Islands and Puerto Rico.
Inspection Information: The number of inspections comes from the new OIS (OSHA Information System) and OSHA’s Integrated Management Information System (IMIS). Federal inspection information was provided by OSHA for FY 2014 from the OIS. State inspection information was obtained from two reports in IMIS—Region by State for 18(b) State (only) for all inspections, and State by Year for 18(b) State (only) for fatality inspections, both for FY 2014— and one report from OIS: State by Year for 18(b) State (only) for fatality inspections, FY 2014.
The inspection ratio is determined by dividing the number of inspections conducted in the state into the number of establishments in the state under the jurisdiction of the agency (as determined by the Bureau of Labor Statistics data cited above). For states covered by federal OSHA, the number of covered establishments includes private-sector establishments (excluding mines, which are covered by the Mine Safety and Health Act) and federal establishments. For states that run their own OSHA programs, the number of establishments includes all private- sector establishments (excluding mines), state and local establishments and federal establishments. (Federal OSHA conducts a limited number of inspections in state plan states, presumably in federal facilities and maritime operations, for which state OSHA programs are not responsible. These inspections and establishments are included in the state profiles). It should be noted that the national average includes inspection data from the District of Columbia, the Virgin Islands, Puerto Rico, Guam, American Samoa and the Marshall Islands.
Penalty Information: Data on average penalties comes from the above referenced OIS and IMIS reports. Average penalty data is divided into individual state penalties, federal OSHA states penalties, state OSHA states penalties and a national average of penalties. The average penalty numbers are ascertained by dividing the total cost for serious penalties by the total number of serious violations. It should be noted that the national average includes penalty data from the District of Columbia and U.S. territories and protectorates: the Virgin Islands, Puerto Rico, Guam, American Samoa and the Marshall Islands.
The Length of Time It Would Take for OSHA to Inspect Each Establishment Once: This information is calculated separately for each federal OSHA state, each state plan OSHA state, the average for federal OSHA states, the average for state plan OSHA states and the national average for all states for one-time inspections. Establishment data is obtained from Employment and Wages, Annual Averages, 2013, at www.bls.gov/cew/cewbultn13.htm.
For individual federal OSHA states, the total number of private-industry (except mines) plus federal establishments is divided by the number of inspections per federal OSHA state. For Connecticut, Illinois, New Jersey and New York, the total number of establishments (except mines) is divided by the number of federal inspections plus the number of 18(b) state inspections.
For individual state plan OSHA states, the total number of establishments (except mines) is divided by the number of inspections per state.
For the average of federal or state plans to inspect establishments one time, the total number of establishments calculated above for individual federal or state plan states are added together and then divided by the total number of federal or state inspections, respectively. For federal states, Connecticut, Illinois, New Jersey and New York, the number of establishments includes the total number of private-industry (minus mines) plus federal establishments, and the number of inspections includes only federal inspections conducted in those states.
For the national average for one-time inspections, the total number of establishments from the number calculated for both federal states and state plan states are added together and then divided by the total number of federal and state inspections.
NOTES: Due to the revised recordkeeping rule, which became effective Jan. 1, 2002, the estimates from the 2002 BLS Survey of Occupational Injuries and Illnesses are not comparable with those from previous years. Among the changes that could affect comparisons are: changes to the list of low-hazard industries that are exempt from recordkeeping; employers are no longer required to record all illnesses regardless of severity; a new category of injuries/illnesses diagnosed by a physician or health care professional; changes to the definition of first aid; and days away from work are recorded as calendar days.
Beginning with the 2003 reference year, both CFOI and the Survey of Occupational Injuries and Illnesses began using the 2002 North American Industry Classification System (NAICS) for industries and the Standard Occupation Classification system (SOC) for occupations. Prior to 2003, the surveys used the Standard Industrial Classification (SIC) system and the Bureau of the Census occupational classification system. The substantial differences between these systems result in breaks in series for industry and occupational data. Therefore, this report makes no comparisons of industry and occupation data from BLS for years beginning with 2003 and beyond with industry and occupation data reported by BLS prior to 2003.
FOOTNOTES FOR STATE PROFILES
1U.S. Department of Labor, Bureau of Labor Statistics, Employment and Wages: Annual Averages, 2013.
2Under §18 of the Occupational Safety and Health Act, a state may elect to run its own occupational safety and health program, provided it is as effective as the federal program. One condition of operating a state plan is that the program must cover state and local employees who otherwise are not covered by the OSH Act. Currently, 21 states and one territory administer their own OSHA programs for both public- and private-sector workers. Connecticut, Illinois, New Jersey, New York and the Virgin Islands have state programs for public employees only.
3U.S. Department of Labor, Bureau of Labor Statistics, Census of Fatal Occupational Injuries, 2013.
4U.S. Department of Labor, Bureau of Labor Statistics, Census of Fatal Occupational Injuries, 2013, Final Release, April 22, 2015.
5Ranking based on best to worst (1=best; 50=worst).
6U.S. Department of Labor, Bureau of Labor Statistics, Survey of Occupational Injuries and Illnesses, 2013 private sector only.
7U.S. Department of Labor, Bureau of Labor Statistics, State Data, Nonfatal Occupational Injuries and Illnesses Requiring Days Away from Work, Job Transfer or Restriction, 2013 private industry only.
8U.S. Department of Labor, OSHA. Federal Compliance Safety and Health Officer Totals by State, Jan. 1, 2015. State plan state Compliance Safety and Health Officers “on board” from FY 2015 State Plan Grant Applications.
9U.S. Department of Labor, OSHA. Inspection data provided by the Directorate of Enforcement programs, OIS Inspection Report; and the Directorate of Cooperative and State programs, IMIS State by Year for 18(b) State (only) and OIS State by Year for 18(b) State (only).
10U.S. Department of Labor, OSHA, FY 2014. Fatality inspection penalty data provided by the Directorate of Enforcement programs, OIS Inspection Report; and the Directorate of Cooperative and State programs, State by Year for 18(b) State (only) from IMIS and OIS State by Year for 18(b) State (only).
©Copyright AFL-CIO 2015. No portion of this publication may be reproduced by anyone other than an affiliate of the AFL-CIO without express written permission.
AFL-CIO
815 16th St., N.W., Washington,DC 200006
202-637-5000
RICHARD L. TRUMKA
President
ELIZABETH H. SHULER
Secretary-Treasurer
TEFERE GEBRE
Executive Vice President