
Results of a Pilot Study of Dust Control Technology for Asphalt Milling (Payne & Dolan)
Summary Statement
The results of a NIOSH performed to evaluate the effectiveness of water spray controls for a cold milling machine. The objective of this study was to quantify the dust exposure reduction that could be achieved through the use of higher flow water-spray nozzles during pavement milling.
October 25, 2004
RESULTS OF A PILOT STUDY OF DUST CONTROL TECHNOLOGY FOR ASPHALT MILLING
At
Payne & Dolan, Inc.
US Route 12 Project, Wisconsin
With assistance from
The National Asphalt Pavement Association Silica Partnership
REPORT DATE: October 25, 2004
REPORT NO: EPHB282-11b
U.S. DEPARTMENT OF HEALTH AND HUMAN SERVICES
Centers for Disease Control and Prevention
National Institute for Occupational Safety and Health
Division of Applied Research and Technology
Engineering and Physical Hazards Branch
4676 Columbia Parkway, Mail Stop R-5
Cincinnati, Ohio 45226-1998
SITES SURVEYED:
Payne & Dolan, Inc.
Route 12 Maintenance Project
Wisconsin
SIC CODE: 1611 (Highway and Street Construction)
SURVEY DATE: October 7-9,2003
SURVEY CONDUCTED BY:
Alan Echt, NIOSH DART
Stanley Shulman, NIOSH DART
Jay Colinet, NIOSR PRL
Gerrit Goodman, NIOSH PRL
EMPLOYER REPRESENTATIVE CONTACTED:
Carl Thiesen
Payne & Dolan, Inc.
DISCLAIMER
Mention of company names or products does not constitute endorsement by the Centers for Disease Control and Prevention
.ACKNOWLEDGMENT
The authors thank the National Asphalt Pavement Association Silica Partnership for their efforts on behalf of this study and for their assistance in arranging this site visit.
ABSTRACT
A pilot study was performed to. evaluate the effectiveness of water spray controls for a cold milling machine. The objective of this study was to quantify the exposure reduction that could be achieved through the use of higher flow water-spray nozzles during pavement milling. The effectiveness of the dust controls examined in this study was evaluated by measuring the reduction in the respirable dust and respirable quart exposures in personal and area samples collected during a typical milling job. Use of the higher flow nozzles resulted in reductions in respirable dust and respirable quartz exposures, but the differences were not statistically significant. During this study the higher flow nozzles were only installed on the cutter drum and the cutter drum extension.
INTRODUCTION
The National Institute for Occupational Safety and Health (NIOSH) is located in the Centers for Disease Control and Prevention (CDC), part of the Department of Health and Human Services (DHHS). NIOSH was established in 1970 by the Occupational Safety and Health Act, at the same time that the Occupational Safety and Health Administration (OSHA) was established in the Department of Labor (DOL). The OSH Act legislation mandated NIOSH to conduct research and education programs separate from the standard-setting and enforcement functions conducted by OSHA. An important area of NIOSH research deals with methods for controlling occupational exposure to potential chemical and physical hazards.
The Engineering and Physical Hazards Branch (EPHB) of the Division of Applied Research and Technology (DART) has been given the lead within NIOSH to study and develop engineering controls and assess their impact on reducing occupational illness. Since 1976, EPHB (and its predecessor, the Engineering Control Technology Branch) has conducted a large number of studies to evaluate engineering control technology based upon industry, process, or control technique. The objective of each of these studies has been to evaluate and document control techniques and to determine their effectiveness in reducing potential health hazards in an industry or for a specific process.
The primary aim of this project is to determine if the engineering controls supplied with new milling machines and operated according to the manufacturers' recommendations are adequate to control worker exposures to respirable dust and respirable crystalline silica (in the front of quartz). The long term goal of this project is to reduce worker exposures to silica by providing data to support the development of a set of best practice guidelines for the equipment if the engineering controls are adequate, or to develop a set of recommendations to improve the performance of controls if they are not adequate.
Many construction tasks have been associated with overexposure to crystalline silica (Rappaport et al. 2003). Among these tasks are tuck pointing, concrete sawing, concrete grinding, and abrasive blasting (NIOSH 2000, Thorpe et aL 1999, Akbar-Kanadeh and Brillhart 2002, Glindmeyer and Hammad 1988). Road milling has also been shown to result in overexposures to respirable crystalline silica (Linch 2002, Rappaport et aL 2003, NJ Dept. of Health and Senior Services 2001). However, all three of the milling studies are limited because they do not provide enough information about the operating parameters and engineering controls present on the milling machines to determine if the . overexposures were due to a lack of effective controls or poor work practices. This study will attempt to fill that knowledge gap.
A variety of machinery and work practices are employed in asphalt pavement recycling, including cold-planers, heater planers, cold-millers, and heater-scarifiers (public Works 1995). Cold-milling, which uses a toothed, rotating drum to grind and remove the pavement to be recycled, is primarily used to remove surface deterioration on both asphalt and Portland cement concrete road surfaces (public Works 1995). The milling machines used in cold milling are the focus of this investigation.
The cold milling work observed during this pilot study was part of the US 12 reconstruction project from CTH KP to STH 19 west in Wisconsin. This was a section of old US 12 that was rehabilitated and will be transferred to the local township. There was a 20 ft. wide concrete pavement placed in the early 1900's. Above that was a layer of crushed aggregate base course of varying thickness; about 0 inches to 10 inches. Above that was varying asphalt pavement thickness of about 8 to more than 12 inches which had been placed at various times in about the last 60 years. The asphaltic pavement was rutted and cracked to varying degrees. The portion of old US 12 from Simpson Road to the south where it meets the new US 12 was re-graded on new alignment; this pavement removal was specified by a Common Excavation item The Common Excavation item specification enables the contractor to remove the pavement in any way they see fit. In this case, the contractor chose to mill the pavement because it was of value as a recycled product. The existing concrete was also removed and disposed of. In the area from Simpson to the north, this section was not re-graded, but the entire existing asphaltic pavement was removed under the item of Removing Asphaltic Surface, This specifies the removal of only the asphaltic pavement. Again, the contractor chose to salvage this pavement and recycle it (Neuhauser 2004).
This study was facilitated by a partnership in cooperation with the National Asphalt Pavement Association that includes milling machine manufacturers, contractors, employee representatives, NIOSH, and other interested parties. One of the milling machine manufacturers, manufacturer A, had initially arranged to perform the pilot study on a 2003 milling machine model with the latest, "state-of-the-ar" water spraying system produced by the manufacturer. The mill is a half-lane milling machine rated at 560HP with a water spray system capable of l5gpm at 200psI. This system was put into production in 2001 - before initial discussions on testing airborne dust concentration.
About one week before the pilot study was to be performed; manufacturer A learned that the 2003 mil would not be available for the test. Instead, an older machine was substituted. The replacement machine was a half-lane milling machine rated at 800 HP with an eight-foot cutter and an older model water system designed for 10gpm at 50psi.
Manufacturer A knew that the lower water flow at much lower pressure would result in higher airborne dust content, hut Manufacturer A was still confident that the dust suppression system even on the older model machines should still be very effective if properly maintained and operated. Therefore Manufacturer A agreed to perform the test (even with the last minute changes) as a means of getting at least a good baseline for this type of airborne dust test.
Occupational Exposure to Crystalline Silica
Silicosis is an occupational respiratory disease caused by inhaling respirable crystalline silica dust. Silicosis is irreversible, often progressive (even after exposure has ceased), and potentially fataL. Because no effective treatment exists for silicosis, prevention though exposure control is essentiaL. Exposure to respirable crystalline silica dust occurs in many occupations, including construction. Crystalline silica refers to a group of minerals composed of silicon and oxygen; a crystalline structure is one in which the atoms are arranged in a repeating three-dimensional pattern (Bureau of Mines 1992). The three major forms of crystalline silica are quartz, cristobalite, and tridymite; quartz is the most common form (Bureau of Mines 1992). Respirable refers to that portion of airborne crystalline silica that is capable of entering the gas-exchange regions of the lungs if inhaled; this includes particles with aerodynamic diameters less than approximately 10 µm (NIOSH 2002).
When proper practices are not followed or controls are not maintained, respirable crystalline silica exposures can exceed the NIOSH Recommended Exposure Limit (REL), the OSHA Permissible Exposure Limit (PEL), or the American Conference of Governmental Industrial Hygienists (ACGIH) Threshold Limit Value (TLV) [NIOSH 2002, ACGIH 2001]. NIOSH recommends an exposure limit of 0.05 mg/m3 to reduce the risk of developing silicosis, lung cancer, and other adverse health effects.
The OSHA PEL for respirable dust containing 1 % quartz or more in general industry is expressed as an equation (29 CFR 1910.1000):
| Respirable PEL = | 10 mg/m3 % Silica + 2 |
If, for example, the dust contain no crystalline silica, the PEL is 5 mg/m3, and if the dust is 100% crystalline silica, the PEL is 0.1 mg/m3. For tridymite and cristobalite, OSHA uses half the value calculated using the formula for quartz (29 CPR 1910.1000).
The current OSHA permissible .exposure limit (PEL) for respirable dust containing crystalline silica (quartz) for the construction industry is measured by impinger sampling. The PEL is expressed in millions of particles per cubic foot (mppcf) and is calculated using the following formula (29 CFR 1926.55):
| Respirable PEL = | 250 mppcf % Silica + 5 |
Since the PELs were adopted, the impinger sampling method has been rendered obsolete by gravimetric sampling (OSHA 1996). OSHA is not aware of any government agencies or employers in this country that are currently using impinger sampling to assess worker exposure to dust containing crystalline silica, and impinger samples are generally recognized as being less reliable than gravimetric samples (OSHA 1996). OSHA has determined that sampling procedures in the construction industry should be the same as in general industry, and that the mppcf PEL in 29 CFR 1926.55(a) is equivalent to the mg/m3 PEL in 29 CFR 1910.1000 (OSHA 1996).
The ACGIH TLV®'s for cristobalite, quartz, and tridymite are all 0.05 mg/m3 (ACGIH: 2004). The ACGIH® has published a notice of their intent to change the TLV® for a-quartz and cristobalite (respirable fraction) to 0.025 mg/m3, and to withdraw the documentation and adopted TLV® for tridymite (ACGIH 2004).
METHODS
Descriptive data about the milling machine were gathered during the afternoon and evening prior to the fist day of sampling, while the machine was undergoing repairs at the Payne & Dolan shop. Information was collected about the number, type, condition, and placement of water spray nozzles on the drum and at the conveyor belt transitions; the cutter drum rotation rate (measured using a non-contact tachometer (TAC2K, Dwyer Instruments, Inc., Michigan City, Indiana) while the mill was rug); the hours on the machine; the cutter drum condition; and the cutter bits, including their spacing, condition, make, and model number. NIOSH personnel worked with Payne & Dolan staff and the manufacturer's representative to install water flow meters and pressure gauges, install new water spray nozzles and cutter bits, and restore the water spray nozzles at the secondary conveyor transition to the manufacturer's specification. This tie was also used to learn about the operation of the machine and safe work practices.
Water flow rate was measured using two water flow meters (Conflowmeter II, Conflow, Inc., Washington,PA) installed in the water supply lies on the mill. One meter was installed in the line between the water pump and the cutter drum spray bar. The second meter was installed in the line between the water pump and the conveyor transition sprays (Figure 1). Water pressure was measured using pressure gauges attached to tee-fittings installed in the water line supplying the cutter drum spray bar (Figure 2), in the water line supplyig.the spray bar for the first conveyor belt transition, and in the water line supplying the nozzles on the secondary conveyor transition. The readings on these meters and gauges were observed and recorded periodically throughout both days of milling.
Vehicle speed and direction of travel was measured using a Trimble GeoXT handheld data-logging global positioning system (GPS) unit (Trimble Navigation Ltd., Sunnyvale, CA) receiver on the second day of milling. The GPS unit was placed on padding on the top of the milling machine in an empty fire extinguisher bracket (the extinguisher had been relocated previously) in front of the operator's station (Figure 3). Speed was also recorded during both days of milling by a NIOSH researcher observing and recording the foot speed reading on the instrument panel of the mil every two minutes. As a measure of productivity, the time was recorded when each dump truck was loaded and pulled away from the milling machine.
Depth of cut was measured every fifteen minutes during both milling days using a tape measure held at the edge of the cut pavement. The width of the cut was measured as well. Bulk samples of the milled pavement were collected on a periodic basis from material left in or next to the cut by the milling machine. Wind speed and direction and temperature were recorded using a data-logging weather station (MultiLog Weather Station, Fourier Systems, Inc., Atlanta, GA). A hand-held multi-directional impeller wind meter was also used during the survey (Skywatch Meteos, JDC Electronic SA, Yverdon-Ies-Bains, Switzerland).
The work practices and use of personal protective equipment were recorded for each worker sampled, including the worker's position and distance relative to the milling machine (e.g., walking alongside, following behind, riding). Information obtained from conversations with workers to determine if the sampling days were typical of the nominal work load helped to place the sampling results in proper perspective. Data were recorded describing other operations nearby that generated dust, including the process, its location relative to the milling machine, and whether it was upwind or downwind of the milling machine.
Dust and silica Sampling Methods
On both days of sampling, personal breathing zone samples on the three members of the milling crew were collected at a flow rate of 4.2 liters per minute (L/min) using a battery operated sampling pump at the employee's waist connected via flexible tubing to a: preweighed, 37-mm diameter, 5-micron (~m) pore-size polyvinyl chloride filter supported by a backup pad in a three-piece filter cassette sealed with a cellulose shrink band in accordance with NIOSH Methods 0600 and 7500, and a cyclone (GK 2.69 Respirable/Thoracic Cyclone, BGI Inc., Waltham, MA) placed in the employee's breathing zone (NIOSH 1994, HSE 1997).
Area samples were collected on both days of sampling at six locations on the milling machine using an array of instruments mounted on a metal frame (Figure 4). The locations included the dashboard on the operator's platform, near the level controls on both sides of the mil, near the cutter drum on both sides of the mil, and on the right side near the transition from the primary conveyor to the loading conveyor (Figure 5). The sampling instruments in each array included a Iight-scattering aerosol photometer (pDR, Thermo Electron Corp., Franklin, MA) with a 10 millimeter (mm) nylon cyclone connected to the inlet via flexible tubing. The pDR was in turn connected via flexible tubing to a battery-operated sampling pump calibrated at a flow rate of 1.7 L/min. A preweighed 5 µm pore-size polyvinyl chloride filter supported by a backup pad in a two piece filter cassette sealed with a cellulose shrink band was placed in line between the pDR and the pump. Also included in each sampling array were two battery-operated sampling pumps, both connected though flexible tubing to a 10-mm nylon cyclone and a pre-weighed, 37-mm diameter, 5-¡.m pore-size polyvinyl chloride filter supported by a backup pad in a two-piece filter cassette sealed with a cellulose shrink band, in accordance with NIOSH Methods 0600 and 7500.
On the second day of sampling, additional area samples were collected at the six locations described above at a flow rate of 4.2 liters/minute using a battery-operated sampling pump connected via flexible tubing to a pre-weighed, 37-mm diameter, 5- micron (¡.m) pore-size polyvinyl chloride filter supported by a backup pad in a three piece filter cassette sealed with a cellulose shrink band in accordance with NIOSH Methods 0600 and 7500, and a cyclone (OK 2.69 Respirable/Thoracic Cyclone, BGI Inc., Waltham, MA) attached to the metal frame.
Gravimetric analysis for respirable particulate was cared out with the following modifications to NIOSH Method 0600: 1) the filters and backup pads were stored in an environmentally controlled room (20:1 1°C and 50:i5% relative humidity) and were subjected to the room conditions for at least two hours for stabilization prior to tare and gross weighing, and, 2) two weighings of the tare weight and gross weight were performed (NIOSH 1994). The difference between the average gross weight and the average tare weight was the result of the analysis. The limit of detection for this method was 0.02 mg.
Crystalline silica analysis of the hìgher-flow filter and all bulk samples was performed using X-ray diffraction. NIOSH Method 7500 was used with the following modifications: 1) filters were dissolved in tetrahydrofuran rather than being ashed in a furnace; and, 2) standards and samples were run concurrently and an external calibration curve was prepared from the integrated intensities rather than using the suggested normalization procedure (NIOSH 1994). These samples were analyzed for quartz and cristobalite. The limits of detection for quartz and cristobalite on filters were 0.01 and 0.02 mg, respectively. The limit of quantitation is 0.03 mg for both quartz and cristobalite. The lower-flow filter samples were not analyzed for silica.
The silica content of the pavement was determined though testing of bulk samples collected from milled pavement left in or next to the cut by the milling machine. The limit of detection for quartz in bulk samples was 0.8%. The limit of quantitation was 2%.
Experimental design
Initial activities on site, such as installing new water spray nozzles and new cutter-drum teeth, were devoted to returning the mil to the manufacturer's specifications. During the first day of sampling, samples were collected over thee sampling periods during a typical milling job. The second day of sampling was divided into four 2-hour periods. During the first period, the manufacturer-specified nozzles (UniJet® model 11005 SS, Spraying Systems Co., Wheaton, IL) rated at 0.5 gallons per minute (gpm) at 40 pounds per square inch (psi) were used. For the second and third period, higher-flow nozzles (UniJet® model 11008, Spraying System Co., Wheaton, IL) rated at 0.8 gpm at 40 psi were installed on the cutter-dr spray bar. during the final period, the manufacturer-specified nozzles were used again. This design was used instead of a randomized design because of the length of time and effort required to change the nozzles in the field. The spray nozzles for the primary conveyor and the material transfer conveyor were not changed. Personal and high-flow area samples for respirable dust and respirable crystalline silica were changed approximately every two hours during both sampling days. The lower-flow area samples were collected for the full shift on both days.
RESULTS AND DISCUSSION
Description of the Mill and the Controls
The milling machine used at this site had 3560 hours on the machine at the beginning of the site visit. It was equipped with water spray nozzles at three places, including dr spraying nozzles, primary conveyor spraying nozzles, and material transfer conveying nozzles. There were 18 flat fan spray nozzles (UniJet® model 11005 SS, Spraying Systems Co., Wheaton, IL) mounted on a spray bar in the cutter drum housing. This type of nozzle was used at all of the installations on this milL. The first thee nozzles on the cutter drum spray bar were mounted 2 inches (in) apart, the third and fourth nozzle were mounted 3 % in apart, and the remaining nozzles were 5 1/2 in. apart. The cutter drum extension was served by a separate spray bar equipped with thee nozzles. The first two nozzles were 2in apart, while the second and third nozzle were 5 1/2 in apart. There were a total of nine nozzles at the primary conveyor, installed at the transition from the cutter drum to the primary conveyor; four were mounted on each side and one on the extension. These nozzles were 1 foot apart. There were two nozzles mounted above the material transfer conveyor at the transition from the primary conveyor. Those nozzles were 32 in apart. New nozzles were installed on the evening before the first sampling day. The water pump for the spraying system is rated at 40 L/min (10.6 gallons) of water at 3 1/2 bar (51 psi).
The 8 ft 6 in wide cutter drum held 193 bits arranged in a helical coil around the drum. The drum and holders were in factory spec condition, with 50 hrs on the holders. New bits were installed on the evening before the first sampling day, and were changed several times during the next two days. The dr rotation was measured and found to agree with the manufacturer's specification of92.8 rpm.
Personal protective equipment and work practices
The milling crew members wore hard hats (except the operator), safety glasses, and traffic safety vests. The operator was the only employee who spent all of his time on the mil, operating the mil from either the right or left side of the operator's station. The foreman spent the majority of the first day operating the rear controls, while the third crewman performed tasks such as operating a skid-steer loader and daring the water truck (Figure 6). However, in the afternoon, the foreman operated the skid steer loader while the third crewman ran the rear controls. For the most par, the skid-steer loader was not operated near the milling machine on the first day. On one occasion a road grader passed by, and for a brief period in the afternoon, milling took place alongside a field while a farmer was running a combine. On the second day, the skid-steer loader was idle for the majority of the day and the third crew member spent most of the day running one of the rear controls. The foreman left the mill periodically to attend to matters such as truck scheduling. On both days, the trucks assigned to take away the milled material drove on the paved portion of the road, until that was no longer possible, lessening the potential of dust being generated by the trucks as they passed the milling machine.
Respirable dust and crystalline silica sampling results
The results of personal breathing zone sampling for respirable dust and crystalline silica conducted on October 8 are presented in Table 1. On October 8, which represented a typical milling day, respirable dust results ranged from 0.14 to 1.83 mg/m . The TW A respirable dust exposures for the three employees were 0.26 mg/m3 (499 minutes) for the operator, 1.0 mg/m3 (495 minutes) for the foreman, and 0.38 mg/m3 (438 minutes) for the third employee, who began the day operating~ the skid steer loader. Their 8-hour TWAs were 0.27 mg/m3 for the operator, 1.0 mg/m for the foreman, and 0.35 mg/m3 for the third crew member. The OSHA PELs for these employees, calculated based upon the percent silica in their samples, were 1.42 mg/m 3 for the operator, 1.17 mg/m3 for the foreman, and 1.13 mg/m3 for the third member of the milling crew. The PELs were calculated using the value of the LOD/.J for quartz values below the LOD (Hornung and Reed 1990). None of the employee's exposures exceeded the OSHA PEL on October 8 as a TW A, but excursions above the PEL did take place during the first two sampling periods for the foreman, who spent most of those periods operating the rear controls on the mill.
Respirable quartz results from personal samples ranged from below the limit of to detection 0.1 1 inglm3. The TW A respirable quartz exposures for October 8 were 0.013 mg/m3 for the operator, 0.064 mg/m3 for the foreman, and 0.030 mg/m3 for the third milling Crew member. The TWAs were also calculated using the value of LOD/.. for quartz results less than the LOD of 0.01 mg. Their 8-hour quartz TWAs were 0.014 mg/m3. 0.066 mg/m3, and 0.027 mg/m3. respectively. On October 8. the foreman's TWA and 8-hour TWA exposure exceeded the NIOSH quartz REL of 0.05 mg/m3.
Table 2 lists the results of the milling crew's respirable dust and respirable quartz samples on October 9. Calculating TWA respirable dust exposures by nozzle type and employee results in TWAs of2.1 mg/m3 for the operator, 0.62 mg/m3 for the foreman, and 1.1 mg/m3 for the rear control operator for the UniJet® 11005 nozzle, versus 1.4 mg/m3, 0.65 mg/m3, and 0.89 mg/m , respectively, for the UniJet® 11008 nozzle. TWA quartz results for the UniJet® 11005 nozzle were 0.12 mg/m3 for the operator, 0.041 mg/m3 for the foreman, and 0.050 mg/in3 for the worker operating the rear controls. 8 TW A quartz results for the UníJetlIII008 nozzle were 0.081 mg/m3 for the operator, 0.041 mg/m3 for the foreman, and 0.043 mg/m3 for the third crewman. In contrast to October 8, the operator received the highest exposures on the second sampling day, regardless of the nozzle type. Inspection of Table 3 shows that the highest emissions were associated with the left side of the mil and the upper conveyor. Unfortunately, the weather station did not log data, so the effect of the wind direction on those results is unknown.
Table 4 reports the results of the area samples collected on October 8 with the lower-flow respirable dust samplers (1.7 L/min) and the pdR direct-reading instruments. Those results indicate that for both sampling methods, that exposures were lowest in the operator's station and highest at the upper conveyor (the material transfer conveyor). This table also lists the gravimetric/pDR ratios calculated for each sampling location. These ratios were used to adjust pDR short term sampling concentrations, which are provided later in this report. Table 5 presents the results for the lower-flow respirable dust samples and the pdR samples for October 9, including the results from all nozzle types. The upper conveyor produced the highest exposure on that day as welL. Perhaps the operator's personal exposures differ from the area sample at his work station because he spends most of the time on one or the other side of the mm, while the sampler was in the center of his work station (Figure 7). Table 5, which provides the results of the lower-flow and pDR area samples, shows that, as in Table 3, the highest emissions were associated with the left side of the mill and the upper conveyor. The mill removed material from the right side of the road, so the left side of the mill was facing the paved edge of the road, while the right side faced the previous cut. This orientation may explain in par why the exposures were higher on the left side of the milL. The manufacturer's representative attributed this result to passing truck traffic, Table 6 relates area sampling results to productivity, water flow, and water spray pressure while Table 7 describes the work done on October 9.
When reviewing the results of sampling conducted on October 9, for the purpose of this study it is useful to compare the results obtained when the different water spray nozzles were used. For the purpose of this analysis, the results were converted to the natural log (In) scale because on the log scale the variability of the data did not vary with concentration. From the In scale analysis of the respirable dust results (Tables 8~ II), the ratio of the UniJet® 11005 nozzle to the UniJet® 11008 nozzle. results is the ratio of their geometric means, 1.2. This indicates that the respirable dust measurements obtained while the UniJet® 11005 nozzle was used are about 20% higher, though the result is not statistically significant, even at the lO% significance leveL. Results for the pDRs are similar. Those results are also about 20% higher for the UniJet® 11005 and are also not statistically significant at the 10% leveL. Examination of the tables indicates that for most groupings, the UniJetlIl1005 nozzle does give higher results. Review of all of the respirable dust data from October 9 shows that 59% of the UniJet® 11005 nozzle results exceeded the PEL, while 50% of the UniJet!I 11008 nozzle results did so. For personal breathing zone samples, half of the results while the UniJet® 11005 was in use exceeded the PEL; one third of the UniJet® 11008 results exceeded the PEL.
From the In scale analysis of the quartz sampling results (Tables 12-15), the ratio of the UniJet® 11005 nozzle to the UniJet® 11008 nozzle results is the ratio of their geometric means, 1.16. Thus, for respirable quartz, the results while UniJet® 11005 nozzles were installed on the cutter drum were about 16% higher, though the result is not statistically significant, .even at the 10% significance leveL. Examination of the tables indicates that the quartz results are not as consistent as those for respirable dust. For data from both days, 7 respirable quartz results were less than the LOD and 13 values were between LOD and LOQ. For the seven quartz values' below the LOD, the value Lan/.. was substituted.
Quartz in bulk samples
The results of 10 bulk samples ranged from 12 to 28%, with a mean of 19.9% and a median of 18.5%.
CONCLUSIONS AND RECOMMENDATIONS
Conclusions from this pilot study regarding the effect of increasing the water flow to the spray nozzles on dust and quart exposures are limited by several factors.. First, the higher flow nozzles were only installed on the cutter drum and the cutter drum extension. Second, the nozzles selected represent a difference of only 30% more flow when the higher-flow nozzles were installed. Nevertheless, the respirable dust measurements obtained while the UniJet® 11005 nozzles were used were about 20% higher than when the higher-flow UniJet®11008 nozzles were used. The respirable quartz results while UniJet® 11005 nozzles were installed on the cutter drum were about 16% higher. Neither the reductions in respirable dust concentrations nor those for the quartz results were statistically significant, even at the lO% significance leveL. Statistical significance mean that the difference is not due to chance alone.
Research on dust controls in mining has shown that water sprays have two roles, wetting of broken material being transported, and airborne capture (NIOSH 2003). Uniformly wetting the broken material during the breakage process is far more effective, and ensures that dust particles stay attached to the material (NQSH 2003). Increasing the water flow rate and increasing the number of sprays have both been shown to be effective; it is too early in this project to recommend an approach. In one instance, dust from a shearer dr was reduced by 60% when the 46 smaller orifice nozzles were substituted for the originall7 nozzles, with the pressure and flow held constant (NIOSH 2003). The shape of the spray is another important factor in its effectiveness.
Future studies might test the water system on a newer-model machine to begin to explore the relationship between water flow and pressure and airborne dust concentrations. Variables related to the site and job might obscure this relationship, but it is hoped that a trend might emerge.
REFERENCES
29 CFR 1910.1000 (2001) Occupational Safety and Health Administration: air contaminants.
29 CFR 1926.55 (2003). Occupational Safety and Health Administration: gases, vapors, fumes, dusts, and mists.
ACGIH (2004). Threshold limit values for chemical substances. Cincinnati,OH: American Conference of Governmental Industrial Hygienists.
Akbar-Khanzadeh F, Brillhart RL (2002). Respirable crystalline silica dust exposure during concrete finishing (grinding) using hand-held grinders in the construction industry. An. occup. Hyg. 46:341-346.
Bureau of Mines (1992). crystalline silica primer. Washington, DC: U.S. Department of the Interior, Bureau of Mines, Branch of Industrial Minerals, Special Publication.
Glindmeyer HW, Hammad YY (1988). Contributing factors to sandblasters' Silicosis: inadequate respiratory protection equipment and standards. J Occup Med. 30:917-921.
HSE (1997). MDHS 14/2. General methods for sampling and gravimetric analysis of respirable and total inhalable dust. Methods for the determination of hazardous substances. Health and safety laboratory. Sudbury, Suffolk, UK: Health and Safety Executive.
Hornung R, Reed L (1990). Estimation of average concentration in the presence of nondetectable values. Applied Occupational and Environmental Hygiene, 5(1):46-51.
Linch, KD (2002). Respirable concrete dust-Silicosis hazard in the construction industry. Appl. Occup. and Environ. Hyg. 17: 209-221.
Neuhauser, Curt (curt.neuhauser@dot.state.wi.us) (2004) RE: US 12 project. Private email message to Alan Echt (AEcht@cdc.gov), January 7.
New Jersey Department of Health and Senior Services (2001) New Jersey silica partnership In: Occupational Health Surveillance Update, February. Trenton, NJ: NJ Department of Health and Senior Services; Division of Epidemiology, Environmental and Occupational Health, Occupational Health Service, Occupational Health Surveillance Program.
NIOSH (1994). NIOSH manual of analytical methods. 4th rev. ed., Eller PM, ed. Cincinnati, OH: U.s. Department of Health and Human Services, Public Health Service, Centers for Disease Control and Prevention, National Institute for Occupational Safety and Health, DHHS (NIOSH) Publication No. 94-113.
NJOSH (2000). Respirable crystalline silica exposures during tuck pointing. Cincinnati, OH: U.S. Department of Health and Human Services, Public Health Service, Centers for Disease Control and Prevention, National Institute for Occupational Safety and Health. DHHS (NIOSH) Publication No. 2000-113.
NIOSH (2002). NIOSH hazard review: health effects of occupational exposure to respirable crystalline silica. Cincinnati, OH: U.S. Department of Health and Human Services, Centers for Disease Control and Prevention, National Institute for Occupational Safety and Health. DHHS (NIOSH) Publication No. 2002-129.
NIOSH (2003). Information Circular/2003: Handbook for dust control in mining. Pittsburgh, P A: U.S. Department of Health and Human Services, Public Health Service, Centers for Disease Control and Prevention, National Institute for Occupational Safety and Health, Pittsburgh Research Laboratory. IC 9465. DHHS (NIOSH) Publication No. 2003-147.
OSHA (1996). Memorandum for regional administrators from: Joseph A. Dear. Subject: special emphasis program (SEP) for Silicosis. May 2nd 1996. Appendix F: Permissible Exposure Limits for construction and Maritime. Retrieved May 24, 2004, from: http://www.osha.gov/SLTC/etools/silica/spec_emph_prog/spec_emph_prog.html
Public Works (1995). Pavement recycling. Public Works 126: April 15, 1995.
Rappaport 8M, Goldberg M, Susi P, Herrick RF (2003). Excessive exposure to silica in the U.S. construction industry. An. occup. Hyg. 47:111-122.
Thorpe A, Ritchie AS, Gibson MJ, Brown RC (1999). Measurements of the effectiveness of dust control on cut-off saws used in the construction industry. Ann. occup. Hyg. 43:443-456.
Table 1: Results of Personal Breathing Zone Samples
Payne and Dolan
October 8, 2003
| Job | Time (min) | Respirable Dust (mg) | Respirable Quartz (mg) | Percent Quartz | Volume (L) | Respirable Dust (mg/m3) | OSHA PEL (mg/m3) | Respirable Quartz (mg/m3) |
|---|---|---|---|---|---|---|---|---|
| Operator | 146 | 0.19 | (0.01) | (5.26) | 598 | 0.32 | 1.38 | (0.02) |
| Foreman | 142 | 0.69 | 0.05 | 7.54 | 549 | 1.26 | 1.05 | 0.09 |
| Skid Steer | 137 | 0.37 | 0.03 | 8.92 | 569 | 0.65 | 0.92 | 0.06 |
| Operator | 156 | 0.087 | ND | 639 | 0.14 | 5.00 | ||
| Foreman | 155 | 1.1 | 0.07 |
6.09 | 600 | 1.83 | 1.24 | 0.11 |
| Skid Steer | 153 | 0.22 | (0.01) | (4.55) | 636 | 0.35 | 1.53 | (0.02) |
| Operator | 197 | 0.26 | (0.01) | (3.85) | 807 | 0.32 | 1.71 | (0.01) |
| Foreman | 198 | 0.15 | ND | 766 | 0.20 | 5.00 | ||
| Skid Steer | 148 | 0.098 | ND | 615 | 0.16 | 5.00 |
ND indicates a result less than the limit of detection for this method of 1 O¡.g of quartz per sample. Results in parentheses indicate a semi-quantitative value between the limit of detection and the limit of quantitation.
Table 2: Results of Personal Breathing Zone Samples
Payne and Dolan
October 9,2003
| Job | Time (min) | Respirable Dust (mg) | Respirable Quartz (mg) | Percent Quartz | Volume (L) | Respirable Dust (mg/m3) | OSHA PEL (mg/m3) | Respirable Quartz (mg/m3) |
|---|---|---|---|---|---|---|---|---|
| UniJet® 11005 Nozzle | ||||||||
| Operator | 138 | 1.3 | 0.08 | 6.00 | 572 | 2.27 | 1.25 | 0.14 |
| Foreman | 117 | 0.4 | (0.03) | (7.50) | 499 | 0.80 | 1.05 | (0.06) |
| Rear Control | 105 | 0.23 | (0.01) | (4.35) | 435 | 0.53 | 1.58 | (0.02) |
| UniJet® 11008 Nozzle | ||||||||
| Operator | 111 | 0.69 | 0.03 | 4.93 | 460 | 1.50 | 1.44 | 0.07 |
| Foreman | 114 | 0.22 | (0.01) | (4.55) | 486 | 0.45 | 1.53 | (0.02) |
| Rear Control | 111 | 0.59 | (0.03) | (5.08) | 460 | 1.28 | 1.41 | (0.07) |
| UniJet® 11008 Nozzle | ||||||||
| Operator | 132 | 0.69 | 0.05 | 6.81 | 547 | 1.26 | 1.13 | 0.09 |
| Foreman | 125 | 0.44 | 0.03 | 7.50 | 533 | 0.83 | 1.05 | 0.06 |
| Rear Control | 134 | 0.31 | (0.01) | (3.23) | 556 | 0.56 | 1.91 | (0.02) |
| UniJet® 11005 Nozzle | ||||||||
| Operator | 114 | 0.93 | 0.05 | 4.95 | 472 | 1.97 | 1.44 | 0.10 |
| Foreman | 111 | 0.21 | (0.01) | (4.76) | 473 | 0.44 | 1.48 |
(0.02) |
| Rear Control | 107 | 0.72 | 0.03 | 4.72 | 444 | 1.62 | 1.49 | 0.08 |
ND indicates a result less than the limit of detection for this method of 10 µg of quartz per sample.
Results in parentheses indicate a semi-quantitative value between the limit of detection and the limit of quantitation.
Table 3: High~Flow Area Sample Results
Payne and Dolan
October 9, 2003
| Location | Nozzle | Respirable Dust (mg) | Respirable Quartz (mg) | % Quartz | Time (min) | Volume (L) | Respirable Dust (mg/m3) | Respirable Quartz (mg/m3) |
|---|---|---|---|---|---|---|---|---|
| Operator | UniJet® 11005 | ND | ** | |||||
| Operator | UniJet® 11008 | 0.18 | ND | 32 | 134 | 1.35 | ||
| Operator | UniJet® 11008 | 0.43 | ND | 128 | 535 | 0.80 | ||
| Operator | UniJet® 11005 | 0.76 | (0.2) | (2.63) | 123 | 514 | 1.48 | (0.04) |
| Cutter Drum Right | UniJet® 11005 | 0.36 | (0.2) | (5.56) | 117 | 491 | 0.73 | (0.04) |
| Cutter Drum Right | UniJet® 11008 | 0.35 | (0.2) | (5.71) | 110 | 461 | 0.76 | (0.04) |
| Cutter Drum Right | UniJet® 11008 | 0.65 | 0.06 | 8.62 | 134 | 562 | 1.16 | 0.10 |
| Cutter Drum Right | UniJet® 11005 | 0.87 | 0.04 | 4.71 | 125 | 524 | 1.66 | 0.08 |
| Rear Controls Right | UniJet® 11005 | 0.12 | ND | 117 | 490 | 0.24 | ||
| Rear Controls Right | UniJet® 11008 | 0.27 | ND | 114 | 477 | 0.57 | ||
| Rear Controls Right | UniJet® 11008 | 0.2 | (0.2) | (10.00) | 130 | 545 | 0.37 | (0.04) |
| Rear Controls Right | UniJet® 11005 | 0.6 | (0.2) | (3.33) | 125 | 524 | 1.15 | (0.04) |
| Rear Controls Left | UniJet® 11005 | 1.3 | 0.07 | 5.23 | 109 | 454 | 2.86 | 0.15 |
| Rear Controls Left | UniJet® 11008 | 0.58 | 0.04 | 6.03 | 58 | 242 | 2.40 | 0.14 |
| Rear Controls Left | UniJet® 11008 | 1.6 | 0.12 | 7.50 | 126 | 525 | 3.05 | 0.23 |
| Rear Controls Left | UniJet® 11005 | 2.8 | 0.12 | 4.29 | 131 | 546 | 5.13 | 0.22 |
| Cutter Drum Left | UniJet® 11005 | 1.6 | 0.10 | 6.25 | 113 | 475 | 3.37 | 0.21 |
| Cutter Drum Left | UniJet® 11008 | 1.6 | 0.10 | 6.25 | 114 | 479 | 3.34 | 0.21 |
| Cutter Drum Left | UniJet® 11008 | 0.86 | 0.05 | 6.76 | 130 | 546 | 1.57 | 0.10 |
| Cutter Drum Left | UniJet® 11005 | 0.87 | 0.04 | 4.94 | 130 | 546 | 1.59 | 0.08 |
| Upper Conveyor | UniJet® 11005 | 3 | 0.35 | 11.67 | 124 | 525 | 5.71 | 0.67 |
| Upper Conveyor | UniJet® 11008 | 1.9 | 0.10 | 5.16 | 106 | 449 | 4.23 | 0.22 |
| Upper Conveyor | UniJet® 11008 | 1.9 | 0.21 | 11.05 | 140 | 593 | 3.20 | 0.35 |
| Upper Conveyor | UniJet® 11005 | 1.8 | 0.11 | 6.11 | 132 | 559 | 3.22 | 0.20 |
ND indicates a result less than the lit of detection for this method of 10µg of quartz per sample.
Results in parentheses indicate a semi-quantitative value between the lit of detection and the lit of quantitation.
Table 4: Low-Flow and pDR Area Sample Results
Payne and Dolan
October 8, 2003
| Sampling Location | Sample Time (min.) | Gravimetric Respirable Dust (mg/m3) | Average Respirable Dust at Location (mg/m3) | pDR Respirable Dust (mg/m3) | Gravimetric/pDR Ratio |
|---|---|---|---|---|---|
| Operator | 498 | 0.0309 | 0.32 | 0.216 | 1.469 |
| 501 | 0.325 | ||||
| Cutter Drum Right | 514 | 0.753 | 0.72 | 0.0633 | 1.133 |
| 515 | 0.681 | ||||
| Cutter Drum Left | 507 | 0.486 | 0.50 | 0.722 | 0.692 |
| 507 | 0.513 | ||||
| Rear Controls Right | 505 | 0.714 | 0.85 | 0.856 | 0.989 |
| 505 | 0.980 | ||||
| Upper Conveyor | 522 | 3.333 | 2.79 | 3.315 | 0.841 |
| 522 | 2.244 | ||||
| Rear Controls Left | 518 | 1.742 | 1.70 | 1.750 | 0.973 |
| 522 | 1.664 |
Table 5: Low-Flow and pDR Area Sample Results
Payne and Dolan
October 9, 2003
| Sampling Location | Sample Time (min.) | Gravimetric Respirable Dust (mg/m3) | Average Respirable Dust at Location (mg/m3) | pDR Respirable Dust (mg/m3) | Gravimetric/pDR Ratio |
|---|---|---|---|---|---|
| Operator | 505 | 0.964 | 1.00 | 0.989 | 1.015 |
| 505 | 1.043 | ||||
| Cutter Drum Right | 498 | 1.938 | 1.82 | 1.839 | 0.992 |
| 499 | 1.709 | ||||
| Cutter Drum Left | 506 | 2.882 | 2.88 |
2.939 | 0.980 |
| 504 | 1.850 | pinched hose | |||
| Rear Controls Right | 498 | 0.519 | 0.65 | 0.746 | 0.867 |
| 498 | 0.775 | ||||
| Upper Conveyor | 507 | 3.169 | 2.68 | 3.297 | 0.812 |
| 507 | 2.184 | ||||
| Rear Controls Left | 506 | 2.696 | 2.62 | 2.459 | 1.066 |
| 506 | 2.545 |
Table 7: Descriptions of Milling Machine Cuts
Payne and Dolan
October 9, 2003
| Cut ID | Elapsed Time (minutes) | Distance Cut (feet) | GPS Average Velocity (ft/min) | Average speed from time study | Average Cut Depth (inches) | Average Cut Width (inches) | Nozzle Type | |
|---|---|---|---|---|---|---|---|---|
| m/min | ft/min | |||||||
1 |
17.6 |
446 |
25.3 |
9 | 29.5 | 9 | 98 | UniJet® 11005 |
Back up |
5.9 |
1412 |
238.7 |
|||||
2 |
67.3 |
1255 |
18.6 |
7.1 | 23.3 | 7.4 | 98 | UniJet® 11005 |
2A |
34.1 |
690 |
20.2 |
7.4 | 24.3 | 9.5 | 98 | UniJet® 11008 |
Back up |
7.2 |
1893 |
264.8 |
|||||
3 |
68.5 |
1805 |
26,4 |
7.1 | 23.2 | 7.8 | 98 | UniJet® 11008 |
Back up |
7.1 |
1877 |
264.9 |
|||||
4 |
28.7 |
1117 |
39.0 |
10.4 | 34 | 6.7 | UniJet® 11008 | |
4A |
44.9 |
771 |
17.2 |
5.2 | 17.1 | 10.9 | 97 | UniJet® 11005 |
| Back up | 6.8 | 1778 | 263.4 | |||||
| 5 | 42.8 | 1582 | 36.9 | 9.4 | 30.7 | 6.3 | 98 | UniJet® 11005 |
Elapsed times are actual operating times.
Table 8: Respirable Dust Mean by UniJet® Nozzle Type
Payne and Dolan
October 9, 2003
| # of 11005 Samples | Fraction of 11005 Samples > PEL | Mean (SD) 11005 | Number of 11008 Samples | Fraction of 11008 Samples > PEL | Mean (SD), 11008 | Geom Mean (GSD) 11005 | Geom Mean (GSD), 11008 | 11005 GM/ 11008 GM |
|---|---|---|---|---|---|---|---|---|
| 17 | 0.59 | 2.05 (1.58) | 18 | 0.50 | 1.59(1.15) | 1.50 (2.39) | 1.25 (2.07) | 1.5/1.25=1.2 |
Table 9: Respirable Dust Means and Geometric Mean by Area or Personal Sample
Payne and Dolan
October 8 and 9, 2003
| Date | Personal or Area Sample | UniJet ® 11005 Number of Samples | Fraction of UniJet® 11005 Samples > PEL | Mean (SD), UniJet® 11005 | UniJet® 11008 Number of Samples | Fraction of UniJet® Samples > PEL | Mean (SD), UniJet® 11008 | Geom Mean (GSD), UniJet® 11005 | Geom Mean (GSD), UniJet® 11008 | UniJet® 11005 GM/ UniJet® 11008 GM |
|---|---|---|---|---|---|---|---|---|---|---|
| 10-08 | P | 9 | 0.22 | 0.58(0.58) | 0.40(2.45) | |||||
| 10-09 | P | 6 | 0.50 | 1.27(0.78) | 6 | 0.33 | 0.98(0.43) | 1.05(2.02) | 0.89(1.64) | 1.05/0.89=1.18 |
| 10-09 | A | 11 | 0.64 | 2.47(1.77) | 12 | 0.58 | 1.90(1.29) | 1.82(2.52) | 1.47(2.20) | 1.82/1.47=1.24 |
Table 10: Respirable Dust Mean and Geometric Mean by Worker
Payne and Dolan
October 8 and 9, 2003
| Date | Worker | Number of |
Mean (SD), UniJet® 11005 | Number of UniJet® 11008 Samples | Mean (SD), UniJet® 11008 | Geom Mean (GSD), UniJet® 11005 | Geom Mean (GSD), UniJet® 11008 | UniJet® 11005 GM/ UniJet® 11008 GM |
|---|---|---|---|---|---|---|---|---|
| 10-08 | Foreman | 3 | 1.10 (0.83) | 0.77(3.27) | ||||
| 10-08 | Operator | 3 | 0.26(0.10) | 0.24(1.61) | ||||
| 10-08 | Skid Steer | 3 | 0.39(0.25) | 0.33(2.02) | ||||
| 10-09 | Foreman | 2 | 0.62(0.25) | 2 | 0.64(0.27) | 0.59(1.53) | 0.61(1.54) | 0.59/0.61=0.97 |
| 10-09 | Operator | 2 | 2.12(0.21) | 2 | 1.38(0.17) | 2.11(1.11) | 1.37(1.13) | 2.11/1.37=1.54 |
| 10-09 | Rear Control | 2 | 1.08(0.77) | 2 | 0.92(0.51) | 0.93(2.20) | 0.85(1.79) | 0.93/0.85=1.09 |
Table 11: Respirable Dust Mean and Geometric Mean by Location
Payne and Dolan
October 8 and 9, 2003
| Date | Location | Number of UniJet ® 11005 Samples |
Mean (SD), UniJet® 11005 | Number of UniJet® 11008 Samples | Mean (SD), UniJet® 11008 | Geom Mean (GSD), UniJet® 11005 | Geom Mean (GSD), UniJet® 11008 | UniJet® 11005 GM/ UniJet® 11008 GM |
|---|---|---|---|---|---|---|---|---|
| 10-09 | Cutter Drum Left | 2 | 2.48(1.26) | 2 | 2.46(1.25) | 2.31(1.70) | 2.29(1.71) | 2.31/2.29=1.01 |
| 10-09 | Rear Controls Left | 2 | 4.00(1.61) | 2 | 2.73(0.46) | 3.83(1.51) | 2.71(1.18) | 3.83/2.71=1.41 |
| 10-09 | Operator | 1 | 1.48 | 2 | 1.08(0.39) | 1.48 | 1.04(1.45) | 1.48/1.04=1.42 |
| 10-09 | Cutter Drum Right | 2 | 1.20(0.66) | 2 | 0.96(0.28) | 1.10(1. 79) | 0.94(1.35) | 1.10/0.94=1.17 |
| 10-09 | Upper Conveyor | 2 | 4.47(1.76) | 2 | 3.72(0.73) | 4.29(1.50) | 3.68(1.22) | 4.29/3.68=1.17 |
| 10-09 | Rear Controls Right | 2 | 0.70(0.64) | 2 | 0.47(0.14) | 0.53(3.03) | 0.46(1.36) | 0.53/0.46=1.15 |
Table 12: Respirable Quartz Means by UniJet® Nozzle Type
Payne and Dolan
October 9, 2003
| # of 11005 Samples | Mean (SD) 11005 | # of 11008 Samples | Mean (SD) 11008 | Geom Mean (GSD) 11005 | Geom Mean (GSD) 11008 | 11005 GM/ 11008 GM |
|---|---|---|---|---|---|---|
| 17 | 0.13(0.16) | 18 | 0.10(0.094) | 0.078(2.69) | 0.067(2.64) | .078/.067=1.16 |
Table 13: Respirable Quartz Means and Geometric Means by Area or Personal Sample Payne and Dolan October 8 and 9,2003
| Date | Personal or Area Sample | Number of UniJet ® 11005 Samples |
Mean (SD), UniJet® 11005 | Number of UniJet® 11008 Samples | Mean (SD), UniJet® 11008 | Geom Mean (GSD), UniJet® 11005 | Geom Mean (GSD), UniJet® 11008 | UniJet® 11005 GM/ UniJet® 11008 GM |
|---|---|---|---|---|---|---|---|---|
| 10-08 | P | 9 | 0.040(0.039) | |||||
| 10-09 | P | 6 | 4.00(1.61) | 6 | 0.054(0.026) | 0.057(2.02) | 0.048(1.81) | 0.057/0.048=1.19 |
| 10-09 | A | 11 | 0.16(0.19) | 12 | 0.13(0.11) | 0.092(3.03) | 0.080(2.99) | 0.092/0.80=1.15 |
Table 14: Respirable Quartz Means and Geometric Mean by Worker
Payne and Dolan
October 8 and 9, 2003
| Date | Worker | Number of |
Mean (SD), UniJet® 11005 | Number of UniJet® 11008 Samples | Mean (SD), UniJet® 11008 | Geom Mean (GSD), UniJet® 11005 | Geom Mean (GSD), UniJet® 11008 | UniJet® 11005 GM/ UniJet® 11008 GM |
|---|---|---|---|---|---|---|---|---|
| 10-08 | Foreman | 3 | 0.072(0.55) | 3 | 0.046(4.03) | |||
| 10-08 | Operator | 3 | 0.018(0.0062) | 3 | 0.017(1.46) | |||
| 10-08 | Skid Steer | 3 | 0.029(0.025) | 3 | 0.023(2.29) | |||
| 10-09 | Foreman | 2 | 0.039(0.022) | 2 | 0.041(0.029) | 0.035(1.82) | 0.036(2.18) | 0.035/0.036=0.97 |
| 10-09 | Operator | 2 | 2.12(0.21) | 2 | 0.080(0.0085) | 0.12(1.27) | 0.080(1.11) | 0.12/0.080=1.5 |
| 10-09 | Rear Control | 2 | 0.052(0.035) | 2 | 0.041(0.022) | 0.046(2.06) | 0.038(1.77) | 0.046/0.038=1.21 |
Table 15: Respirable Quartz Means and Geometric Means by Location
Payne and Dolan
October 8 and 9, 2003
| Date | Location | Number of UniJet ® 11005 Samples |
Mean (SD), UniJet® 11005 | Number of UniJet® 11008 Samples | Mean (SD), UniJet® 11008 | Geom Mean (GSD), UniJet® 11005 | Geom Mean (GSD), UniJet® 11008 | UniJet® 11005 GM/ UniJet® 11008 GM |
|---|---|---|---|---|---|---|---|---|
| 10-09 | Cutter Drum Left | 2 | 0.14(0.093) | 2 | 0.15(0.079) | 0.13(2.01) | 0.14(1.72) | 0.13/0.14=0.93 |
| 10-09 | Rear Controls Left | 2 | 0.18(0.050) | 2 | 0.19(0.059) | 0.18(1.31) | 0.18 (1.38) | 0.18/0.18=1 |
| 10-09 | Operator | 1 | 0.049() | 2 | 0.033(0.028) | 0.049 | 0.026(2.67) | 0.049/0.026=1.88 |
| 10-09 | Cutter Drum Right | 2 | 0.054(0.034) | 2 | 0.067(0.046) | 0.049(1.94) | 0.059(2.11) | 0.049/0.059=0.83 |
| 10-09 | Upper Conveyor | 2 | 0,43(0.33) | 2 | 0.29(0.096) | 0.36(2.37) | 0.28(1.41) | 0.36/0.28=1.29 |
| 10-09 | Rear Controls Right | 2 | 0..024(0.014) | 2 | 0.027(0.01 7) | 0.022(1.85) | 0.024(1.97) | 0.022/0.024=0.92 |
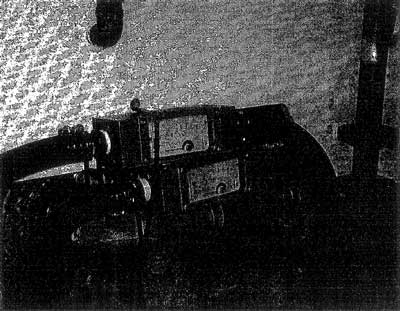
Figure 1: Water flow meters
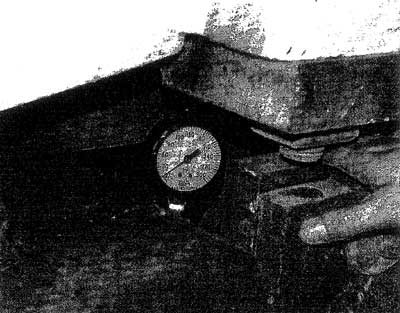
Figure 2: Cutter drum water supply pressure gauge 27
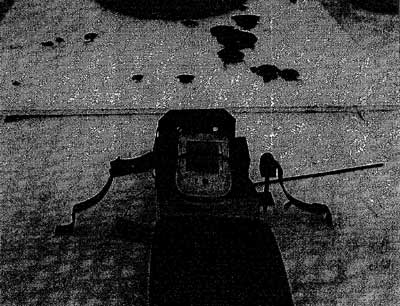
Figure 3: GPS instrument location.
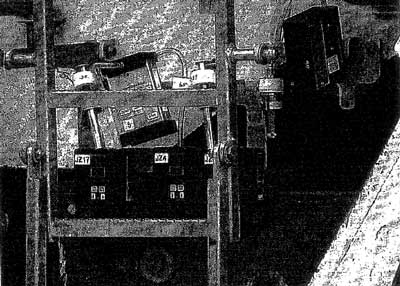
Figure 4: Area sampling array
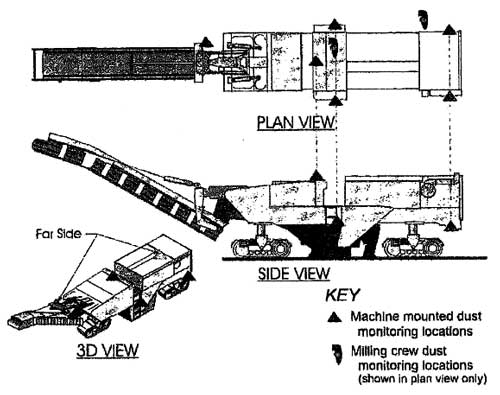
Figure 5: Area Sample Locations
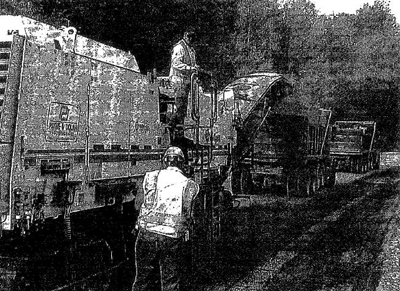
Figure 6: Operator and foreman, Foreman is operating right rear controls.
Figure 7: Position of operator and locations of personal and area samplers
National Institute for Occupational Safety and Health
RESULTS OF A PILOT STUDY OF DUST CONTROL TECHNOLOGY FOR ASPHALT MILLING
At
Payne & Dolan, Inc.
US Route 12 Project, Wisconsin
With assistance from
The National Asphalt Pavement Association Silica Partnership
REPORT DATE: October 25, 2004
REPORT NO: EPHB282-11b
U.S. DEPARTMENT OF HEALTH AND HUMAN SERVICES
Centers for Disease Control and Prevention
National Institute for Occupational Safety and Health
Division of Applied Research and Technology
Engineering and Physical Hazards Branch
4676 Columbia Parkway, Mail Stop R-5
Cincinnati, Ohio 45226-1998
SITES SURVEYED:
Payne & Dolan, Inc.
Route 12 Maintenance Project
Wisconsin
SIC CODE: 1611 (Highway and Street Construction)
SURVEY DATE: October 7-9,2003
SURVEY CONDUCTED BY:
Alan Echt, NIOSH DART
Stanley Shulman, NIOSH DART
Jay Colinet, NIOSR PRL
Gerrit Goodman, NIOSH PRL
EMPLOYER REPRESENTATIVE CONTACTED:
Carl Thiesen
Payne & Dolan, Inc.
DISCLAIMER
Mention of company names or products does not constitute endorsement by the Centers for Disease Control and Prevention
.ACKNOWLEDGMENT
The authors thank the National Asphalt Pavement Association Silica Partnership for their efforts on behalf of this study and for their assistance in arranging this site visit.
ABSTRACT
A pilot study was performed to. evaluate the effectiveness of water spray controls for a cold milling machine. The objective of this study was to quantify the exposure reduction that could be achieved through the use of higher flow water-spray nozzles during pavement milling. The effectiveness of the dust controls examined in this study was evaluated by measuring the reduction in the respirable dust and respirable quart exposures in personal and area samples collected during a typical milling job. Use of the higher flow nozzles resulted in reductions in respirable dust and respirable quartz exposures, but the differences were not statistically significant. During this study the higher flow nozzles were only installed on the cutter drum and the cutter drum extension.
INTRODUCTION
The National Institute for Occupational Safety and Health (NIOSH) is located in the Centers for Disease Control and Prevention (CDC), part of the Department of Health and Human Services (DHHS). NIOSH was established in 1970 by the Occupational Safety and Health Act, at the same time that the Occupational Safety and Health Administration (OSHA) was established in the Department of Labor (DOL). The OSH Act legislation mandated NIOSH to conduct research and education programs separate from the standard-setting and enforcement functions conducted by OSHA. An important area of NIOSH research deals with methods for controlling occupational exposure to potential chemical and physical hazards.
The Engineering and Physical Hazards Branch (EPHB) of the Division of Applied Research and Technology (DART) has been given the lead within NIOSH to study and develop engineering controls and assess their impact on reducing occupational illness. Since 1976, EPHB (and its predecessor, the Engineering Control Technology Branch) has conducted a large number of studies to evaluate engineering control technology based upon industry, process, or control technique. The objective of each of these studies has been to evaluate and document control techniques and to determine their effectiveness in reducing potential health hazards in an industry or for a specific process.
The primary aim of this project is to determine if the engineering controls supplied with new milling machines and operated according to the manufacturers' recommendations are adequate to control worker exposures to respirable dust and respirable crystalline silica (in the front of quartz). The long term goal of this project is to reduce worker exposures to silica by providing data to support the development of a set of best practice guidelines for the equipment if the engineering controls are adequate, or to develop a set of recommendations to improve the performance of controls if they are not adequate.
Many construction tasks have been associated with overexposure to crystalline silica (Rappaport et al. 2003). Among these tasks are tuck pointing, concrete sawing, concrete grinding, and abrasive blasting (NIOSH 2000, Thorpe et aL 1999, Akbar-Kanadeh and Brillhart 2002, Glindmeyer and Hammad 1988). Road milling has also been shown to result in overexposures to respirable crystalline silica (Linch 2002, Rappaport et aL 2003, NJ Dept. of Health and Senior Services 2001). However, all three of the milling studies are limited because they do not provide enough information about the operating parameters and engineering controls present on the milling machines to determine if the . overexposures were due to a lack of effective controls or poor work practices. This study will attempt to fill that knowledge gap.
A variety of machinery and work practices are employed in asphalt pavement recycling, including cold-planers, heater planers, cold-millers, and heater-scarifiers (public Works 1995). Cold-milling, which uses a toothed, rotating drum to grind and remove the pavement to be recycled, is primarily used to remove surface deterioration on both asphalt and Portland cement concrete road surfaces (public Works 1995). The milling machines used in cold milling are the focus of this investigation.
The cold milling work observed during this pilot study was part of the US 12 reconstruction project from CTH KP to STH 19 west in Wisconsin. This was a section of old US 12 that was rehabilitated and will be transferred to the local township. There was a 20 ft. wide concrete pavement placed in the early 1900's. Above that was a layer of crushed aggregate base course of varying thickness; about 0 inches to 10 inches. Above that was varying asphalt pavement thickness of about 8 to more than 12 inches which had been placed at various times in about the last 60 years. The asphaltic pavement was rutted and cracked to varying degrees. The portion of old US 12 from Simpson Road to the south where it meets the new US 12 was re-graded on new alignment; this pavement removal was specified by a Common Excavation item The Common Excavation item specification enables the contractor to remove the pavement in any way they see fit. In this case, the contractor chose to mill the pavement because it was of value as a recycled product. The existing concrete was also removed and disposed of. In the area from Simpson to the north, this section was not re-graded, but the entire existing asphaltic pavement was removed under the item of Removing Asphaltic Surface, This specifies the removal of only the asphaltic pavement. Again, the contractor chose to salvage this pavement and recycle it (Neuhauser 2004).
This study was facilitated by a partnership in cooperation with the National Asphalt Pavement Association that includes milling machine manufacturers, contractors, employee representatives, NIOSH, and other interested parties. One of the milling machine manufacturers, manufacturer A, had initially arranged to perform the pilot study on a 2003 milling machine model with the latest, "state-of-the-ar" water spraying system produced by the manufacturer. The mill is a half-lane milling machine rated at 560HP with a water spray system capable of l5gpm at 200psI. This system was put into production in 2001 - before initial discussions on testing airborne dust concentration.
About one week before the pilot study was to be performed; manufacturer A learned that the 2003 mil would not be available for the test. Instead, an older machine was substituted. The replacement machine was a half-lane milling machine rated at 800 HP with an eight-foot cutter and an older model water system designed for 10gpm at 50psi.
Manufacturer A knew that the lower water flow at much lower pressure would result in higher airborne dust content, hut Manufacturer A was still confident that the dust suppression system even on the older model machines should still be very effective if properly maintained and operated. Therefore Manufacturer A agreed to perform the test (even with the last minute changes) as a means of getting at least a good baseline for this type of airborne dust test.
Occupational Exposure to Crystalline Silica
Silicosis is an occupational respiratory disease caused by inhaling respirable crystalline silica dust. Silicosis is irreversible, often progressive (even after exposure has ceased), and potentially fataL. Because no effective treatment exists for silicosis, prevention though exposure control is essentiaL. Exposure to respirable crystalline silica dust occurs in many occupations, including construction. Crystalline silica refers to a group of minerals composed of silicon and oxygen; a crystalline structure is one in which the atoms are arranged in a repeating three-dimensional pattern (Bureau of Mines 1992). The three major forms of crystalline silica are quartz, cristobalite, and tridymite; quartz is the most common form (Bureau of Mines 1992). Respirable refers to that portion of airborne crystalline silica that is capable of entering the gas-exchange regions of the lungs if inhaled; this includes particles with aerodynamic diameters less than approximately 10 µm (NIOSH 2002).
When proper practices are not followed or controls are not maintained, respirable crystalline silica exposures can exceed the NIOSH Recommended Exposure Limit (REL), the OSHA Permissible Exposure Limit (PEL), or the American Conference of Governmental Industrial Hygienists (ACGIH) Threshold Limit Value (TLV) [NIOSH 2002, ACGIH 2001]. NIOSH recommends an exposure limit of 0.05 mg/m3 to reduce the risk of developing silicosis, lung cancer, and other adverse health effects.
The OSHA PEL for respirable dust containing 1 % quartz or more in general industry is expressed as an equation (29 CFR 1910.1000):
| Respirable PEL = | 10 mg/m3 % Silica + 2 |
If, for example, the dust contain no crystalline silica, the PEL is 5 mg/m3, and if the dust is 100% crystalline silica, the PEL is 0.1 mg/m3. For tridymite and cristobalite, OSHA uses half the value calculated using the formula for quartz (29 CPR 1910.1000).
The current OSHA permissible .exposure limit (PEL) for respirable dust containing crystalline silica (quartz) for the construction industry is measured by impinger sampling. The PEL is expressed in millions of particles per cubic foot (mppcf) and is calculated using the following formula (29 CFR 1926.55):
| Respirable PEL = | 250 mppcf % Silica + 5 |
Since the PELs were adopted, the impinger sampling method has been rendered obsolete by gravimetric sampling (OSHA 1996). OSHA is not aware of any government agencies or employers in this country that are currently using impinger sampling to assess worker exposure to dust containing crystalline silica, and impinger samples are generally recognized as being less reliable than gravimetric samples (OSHA 1996). OSHA has determined that sampling procedures in the construction industry should be the same as in general industry, and that the mppcf PEL in 29 CFR 1926.55(a) is equivalent to the mg/m3 PEL in 29 CFR 1910.1000 (OSHA 1996).
The ACGIH TLV®'s for cristobalite, quartz, and tridymite are all 0.05 mg/m3 (ACGIH: 2004). The ACGIH® has published a notice of their intent to change the TLV® for a-quartz and cristobalite (respirable fraction) to 0.025 mg/m3, and to withdraw the documentation and adopted TLV® for tridymite (ACGIH 2004).
METHODS
Descriptive data about the milling machine were gathered during the afternoon and evening prior to the fist day of sampling, while the machine was undergoing repairs at the Payne & Dolan shop. Information was collected about the number, type, condition, and placement of water spray nozzles on the drum and at the conveyor belt transitions; the cutter drum rotation rate (measured using a non-contact tachometer (TAC2K, Dwyer Instruments, Inc., Michigan City, Indiana) while the mill was rug); the hours on the machine; the cutter drum condition; and the cutter bits, including their spacing, condition, make, and model number. NIOSH personnel worked with Payne & Dolan staff and the manufacturer's representative to install water flow meters and pressure gauges, install new water spray nozzles and cutter bits, and restore the water spray nozzles at the secondary conveyor transition to the manufacturer's specification. This tie was also used to learn about the operation of the machine and safe work practices.
Water flow rate was measured using two water flow meters (Conflowmeter II, Conflow, Inc., Washington,PA) installed in the water supply lies on the mill. One meter was installed in the line between the water pump and the cutter drum spray bar. The second meter was installed in the line between the water pump and the conveyor transition sprays (Figure 1). Water pressure was measured using pressure gauges attached to tee-fittings installed in the water line supplying the cutter drum spray bar (Figure 2), in the water line supplyig.the spray bar for the first conveyor belt transition, and in the water line supplying the nozzles on the secondary conveyor transition. The readings on these meters and gauges were observed and recorded periodically throughout both days of milling.
Vehicle speed and direction of travel was measured using a Trimble GeoXT handheld data-logging global positioning system (GPS) unit (Trimble Navigation Ltd., Sunnyvale, CA) receiver on the second day of milling. The GPS unit was placed on padding on the top of the milling machine in an empty fire extinguisher bracket (the extinguisher had been relocated previously) in front of the operator's station (Figure 3). Speed was also recorded during both days of milling by a NIOSH researcher observing and recording the foot speed reading on the instrument panel of the mil every two minutes. As a measure of productivity, the time was recorded when each dump truck was loaded and pulled away from the milling machine.
Depth of cut was measured every fifteen minutes during both milling days using a tape measure held at the edge of the cut pavement. The width of the cut was measured as well. Bulk samples of the milled pavement were collected on a periodic basis from material left in or next to the cut by the milling machine. Wind speed and direction and temperature were recorded using a data-logging weather station (MultiLog Weather Station, Fourier Systems, Inc., Atlanta, GA). A hand-held multi-directional impeller wind meter was also used during the survey (Skywatch Meteos, JDC Electronic SA, Yverdon-Ies-Bains, Switzerland).
The work practices and use of personal protective equipment were recorded for each worker sampled, including the worker's position and distance relative to the milling machine (e.g., walking alongside, following behind, riding). Information obtained from conversations with workers to determine if the sampling days were typical of the nominal work load helped to place the sampling results in proper perspective. Data were recorded describing other operations nearby that generated dust, including the process, its location relative to the milling machine, and whether it was upwind or downwind of the milling machine.
Dust and silica Sampling Methods
On both days of sampling, personal breathing zone samples on the three members of the milling crew were collected at a flow rate of 4.2 liters per minute (L/min) using a battery operated sampling pump at the employee's waist connected via flexible tubing to a: preweighed, 37-mm diameter, 5-micron (~m) pore-size polyvinyl chloride filter supported by a backup pad in a three-piece filter cassette sealed with a cellulose shrink band in accordance with NIOSH Methods 0600 and 7500, and a cyclone (GK 2.69 Respirable/Thoracic Cyclone, BGI Inc., Waltham, MA) placed in the employee's breathing zone (NIOSH 1994, HSE 1997).
Area samples were collected on both days of sampling at six locations on the milling machine using an array of instruments mounted on a metal frame (Figure 4). The locations included the dashboard on the operator's platform, near the level controls on both sides of the mil, near the cutter drum on both sides of the mil, and on the right side near the transition from the primary conveyor to the loading conveyor (Figure 5). The sampling instruments in each array included a Iight-scattering aerosol photometer (pDR, Thermo Electron Corp., Franklin, MA) with a 10 millimeter (mm) nylon cyclone connected to the inlet via flexible tubing. The pDR was in turn connected via flexible tubing to a battery-operated sampling pump calibrated at a flow rate of 1.7 L/min. A preweighed 5 µm pore-size polyvinyl chloride filter supported by a backup pad in a two piece filter cassette sealed with a cellulose shrink band was placed in line between the pDR and the pump. Also included in each sampling array were two battery-operated sampling pumps, both connected though flexible tubing to a 10-mm nylon cyclone and a pre-weighed, 37-mm diameter, 5-¡.m pore-size polyvinyl chloride filter supported by a backup pad in a two-piece filter cassette sealed with a cellulose shrink band, in accordance with NIOSH Methods 0600 and 7500.
On the second day of sampling, additional area samples were collected at the six locations described above at a flow rate of 4.2 liters/minute using a battery-operated sampling pump connected via flexible tubing to a pre-weighed, 37-mm diameter, 5- micron (¡.m) pore-size polyvinyl chloride filter supported by a backup pad in a three piece filter cassette sealed with a cellulose shrink band in accordance with NIOSH Methods 0600 and 7500, and a cyclone (OK 2.69 Respirable/Thoracic Cyclone, BGI Inc., Waltham, MA) attached to the metal frame.
Gravimetric analysis for respirable particulate was cared out with the following modifications to NIOSH Method 0600: 1) the filters and backup pads were stored in an environmentally controlled room (20:1 1°C and 50:i5% relative humidity) and were subjected to the room conditions for at least two hours for stabilization prior to tare and gross weighing, and, 2) two weighings of the tare weight and gross weight were performed (NIOSH 1994). The difference between the average gross weight and the average tare weight was the result of the analysis. The limit of detection for this method was 0.02 mg.
Crystalline silica analysis of the hìgher-flow filter and all bulk samples was performed using X-ray diffraction. NIOSH Method 7500 was used with the following modifications: 1) filters were dissolved in tetrahydrofuran rather than being ashed in a furnace; and, 2) standards and samples were run concurrently and an external calibration curve was prepared from the integrated intensities rather than using the suggested normalization procedure (NIOSH 1994). These samples were analyzed for quartz and cristobalite. The limits of detection for quartz and cristobalite on filters were 0.01 and 0.02 mg, respectively. The limit of quantitation is 0.03 mg for both quartz and cristobalite. The lower-flow filter samples were not analyzed for silica.
The silica content of the pavement was determined though testing of bulk samples collected from milled pavement left in or next to the cut by the milling machine. The limit of detection for quartz in bulk samples was 0.8%. The limit of quantitation was 2%.
Experimental design
Initial activities on site, such as installing new water spray nozzles and new cutter-drum teeth, were devoted to returning the mil to the manufacturer's specifications. During the first day of sampling, samples were collected over thee sampling periods during a typical milling job. The second day of sampling was divided into four 2-hour periods. During the first period, the manufacturer-specified nozzles (UniJet® model 11005 SS, Spraying Systems Co., Wheaton, IL) rated at 0.5 gallons per minute (gpm) at 40 pounds per square inch (psi) were used. For the second and third period, higher-flow nozzles (UniJet® model 11008, Spraying System Co., Wheaton, IL) rated at 0.8 gpm at 40 psi were installed on the cutter-dr spray bar. during the final period, the manufacturer-specified nozzles were used again. This design was used instead of a randomized design because of the length of time and effort required to change the nozzles in the field. The spray nozzles for the primary conveyor and the material transfer conveyor were not changed. Personal and high-flow area samples for respirable dust and respirable crystalline silica were changed approximately every two hours during both sampling days. The lower-flow area samples were collected for the full shift on both days.
RESULTS AND DISCUSSION
Description of the Mill and the Controls
The milling machine used at this site had 3560 hours on the machine at the beginning of the site visit. It was equipped with water spray nozzles at three places, including dr spraying nozzles, primary conveyor spraying nozzles, and material transfer conveying nozzles. There were 18 flat fan spray nozzles (UniJet® model 11005 SS, Spraying Systems Co., Wheaton, IL) mounted on a spray bar in the cutter drum housing. This type of nozzle was used at all of the installations on this milL. The first thee nozzles on the cutter drum spray bar were mounted 2 inches (in) apart, the third and fourth nozzle were mounted 3 % in apart, and the remaining nozzles were 5 1/2 in. apart. The cutter drum extension was served by a separate spray bar equipped with thee nozzles. The first two nozzles were 2in apart, while the second and third nozzle were 5 1/2 in apart. There were a total of nine nozzles at the primary conveyor, installed at the transition from the cutter drum to the primary conveyor; four were mounted on each side and one on the extension. These nozzles were 1 foot apart. There were two nozzles mounted above the material transfer conveyor at the transition from the primary conveyor. Those nozzles were 32 in apart. New nozzles were installed on the evening before the first sampling day. The water pump for the spraying system is rated at 40 L/min (10.6 gallons) of water at 3 1/2 bar (51 psi).
The 8 ft 6 in wide cutter drum held 193 bits arranged in a helical coil around the drum. The drum and holders were in factory spec condition, with 50 hrs on the holders. New bits were installed on the evening before the first sampling day, and were changed several times during the next two days. The dr rotation was measured and found to agree with the manufacturer's specification of92.8 rpm.
Personal protective equipment and work practices
The milling crew members wore hard hats (except the operator), safety glasses, and traffic safety vests. The operator was the only employee who spent all of his time on the mil, operating the mil from either the right or left side of the operator's station. The foreman spent the majority of the first day operating the rear controls, while the third crewman performed tasks such as operating a skid-steer loader and daring the water truck (Figure 6). However, in the afternoon, the foreman operated the skid steer loader while the third crewman ran the rear controls. For the most par, the skid-steer loader was not operated near the milling machine on the first day. On one occasion a road grader passed by, and for a brief period in the afternoon, milling took place alongside a field while a farmer was running a combine. On the second day, the skid-steer loader was idle for the majority of the day and the third crew member spent most of the day running one of the rear controls. The foreman left the mill periodically to attend to matters such as truck scheduling. On both days, the trucks assigned to take away the milled material drove on the paved portion of the road, until that was no longer possible, lessening the potential of dust being generated by the trucks as they passed the milling machine.
Respirable dust and crystalline silica sampling results
The results of personal breathing zone sampling for respirable dust and crystalline silica conducted on October 8 are presented in Table 1. On October 8, which represented a typical milling day, respirable dust results ranged from 0.14 to 1.83 mg/m . The TW A respirable dust exposures for the three employees were 0.26 mg/m3 (499 minutes) for the operator, 1.0 mg/m3 (495 minutes) for the foreman, and 0.38 mg/m3 (438 minutes) for the third employee, who began the day operating~ the skid steer loader. Their 8-hour TWAs were 0.27 mg/m3 for the operator, 1.0 mg/m for the foreman, and 0.35 mg/m3 for the third crew member. The OSHA PELs for these employees, calculated based upon the percent silica in their samples, were 1.42 mg/m 3 for the operator, 1.17 mg/m3 for the foreman, and 1.13 mg/m3 for the third member of the milling crew. The PELs were calculated using the value of the LOD/.J for quartz values below the LOD (Hornung and Reed 1990). None of the employee's exposures exceeded the OSHA PEL on October 8 as a TW A, but excursions above the PEL did take place during the first two sampling periods for the foreman, who spent most of those periods operating the rear controls on the mill.
Respirable quartz results from personal samples ranged from below the limit of to detection 0.1 1 inglm3. The TW A respirable quartz exposures for October 8 were 0.013 mg/m3 for the operator, 0.064 mg/m3 for the foreman, and 0.030 mg/m3 for the third milling Crew member. The TWAs were also calculated using the value of LOD/.. for quartz results less than the LOD of 0.01 mg. Their 8-hour quartz TWAs were 0.014 mg/m3. 0.066 mg/m3, and 0.027 mg/m3. respectively. On October 8. the foreman's TWA and 8-hour TWA exposure exceeded the NIOSH quartz REL of 0.05 mg/m3.
Table 2 lists the results of the milling crew's respirable dust and respirable quartz samples on October 9. Calculating TWA respirable dust exposures by nozzle type and employee results in TWAs of2.1 mg/m3 for the operator, 0.62 mg/m3 for the foreman, and 1.1 mg/m3 for the rear control operator for the UniJet® 11005 nozzle, versus 1.4 mg/m3, 0.65 mg/m3, and 0.89 mg/m , respectively, for the UniJet® 11008 nozzle. TWA quartz results for the UniJet® 11005 nozzle were 0.12 mg/m3 for the operator, 0.041 mg/m3 for the foreman, and 0.050 mg/in3 for the worker operating the rear controls. 8 TW A quartz results for the UníJetlIII008 nozzle were 0.081 mg/m3 for the operator, 0.041 mg/m3 for the foreman, and 0.043 mg/m3 for the third crewman. In contrast to October 8, the operator received the highest exposures on the second sampling day, regardless of the nozzle type. Inspection of Table 3 shows that the highest emissions were associated with the left side of the mil and the upper conveyor. Unfortunately, the weather station did not log data, so the effect of the wind direction on those results is unknown.
Table 4 reports the results of the area samples collected on October 8 with the lower-flow respirable dust samplers (1.7 L/min) and the pdR direct-reading instruments. Those results indicate that for both sampling methods, that exposures were lowest in the operator's station and highest at the upper conveyor (the material transfer conveyor). This table also lists the gravimetric/pDR ratios calculated for each sampling location. These ratios were used to adjust pDR short term sampling concentrations, which are provided later in this report. Table 5 presents the results for the lower-flow respirable dust samples and the pdR samples for October 9, including the results from all nozzle types. The upper conveyor produced the highest exposure on that day as welL. Perhaps the operator's personal exposures differ from the area sample at his work station because he spends most of the time on one or the other side of the mm, while the sampler was in the center of his work station (Figure 7). Table 5, which provides the results of the lower-flow and pDR area samples, shows that, as in Table 3, the highest emissions were associated with the left side of the mill and the upper conveyor. The mill removed material from the right side of the road, so the left side of the mill was facing the paved edge of the road, while the right side faced the previous cut. This orientation may explain in par why the exposures were higher on the left side of the milL. The manufacturer's representative attributed this result to passing truck traffic, Table 6 relates area sampling results to productivity, water flow, and water spray pressure while Table 7 describes the work done on October 9.
When reviewing the results of sampling conducted on October 9, for the purpose of this study it is useful to compare the results obtained when the different water spray nozzles were used. For the purpose of this analysis, the results were converted to the natural log (In) scale because on the log scale the variability of the data did not vary with concentration. From the In scale analysis of the respirable dust results (Tables 8~ II), the ratio of the UniJet® 11005 nozzle to the UniJet® 11008 nozzle. results is the ratio of their geometric means, 1.2. This indicates that the respirable dust measurements obtained while the UniJet® 11005 nozzle was used are about 20% higher, though the result is not statistically significant, even at the lO% significance leveL. Results for the pDRs are similar. Those results are also about 20% higher for the UniJet® 11005 and are also not statistically significant at the 10% leveL. Examination of the tables indicates that for most groupings, the UniJetlIl1005 nozzle does give higher results. Review of all of the respirable dust data from October 9 shows that 59% of the UniJet® 11005 nozzle results exceeded the PEL, while 50% of the UniJet!I 11008 nozzle results did so. For personal breathing zone samples, half of the results while the UniJet® 11005 was in use exceeded the PEL; one third of the UniJet® 11008 results exceeded the PEL.
From the In scale analysis of the quartz sampling results (Tables 12-15), the ratio of the UniJet® 11005 nozzle to the UniJet® 11008 nozzle results is the ratio of their geometric means, 1.16. Thus, for respirable quartz, the results while UniJet® 11005 nozzles were installed on the cutter drum were about 16% higher, though the result is not statistically significant, .even at the 10% significance leveL. Examination of the tables indicates that the quartz results are not as consistent as those for respirable dust. For data from both days, 7 respirable quartz results were less than the LOD and 13 values were between LOD and LOQ. For the seven quartz values' below the LOD, the value Lan/.. was substituted.
Quartz in bulk samples
The results of 10 bulk samples ranged from 12 to 28%, with a mean of 19.9% and a median of 18.5%.
CONCLUSIONS AND RECOMMENDATIONS
Conclusions from this pilot study regarding the effect of increasing the water flow to the spray nozzles on dust and quart exposures are limited by several factors.. First, the higher flow nozzles were only installed on the cutter drum and the cutter drum extension. Second, the nozzles selected represent a difference of only 30% more flow when the higher-flow nozzles were installed. Nevertheless, the respirable dust measurements obtained while the UniJet® 11005 nozzles were used were about 20% higher than when the higher-flow UniJet®11008 nozzles were used. The respirable quartz results while UniJet® 11005 nozzles were installed on the cutter drum were about 16% higher. Neither the reductions in respirable dust concentrations nor those for the quartz results were statistically significant, even at the lO% significance leveL. Statistical significance mean that the difference is not due to chance alone.
Research on dust controls in mining has shown that water sprays have two roles, wetting of broken material being transported, and airborne capture (NIOSH 2003). Uniformly wetting the broken material during the breakage process is far more effective, and ensures that dust particles stay attached to the material (NQSH 2003). Increasing the water flow rate and increasing the number of sprays have both been shown to be effective; it is too early in this project to recommend an approach. In one instance, dust from a shearer dr was reduced by 60% when the 46 smaller orifice nozzles were substituted for the originall7 nozzles, with the pressure and flow held constant (NIOSH 2003). The shape of the spray is another important factor in its effectiveness.
Future studies might test the water system on a newer-model machine to begin to explore the relationship between water flow and pressure and airborne dust concentrations. Variables related to the site and job might obscure this relationship, but it is hoped that a trend might emerge.
REFERENCES
29 CFR 1910.1000 (2001) Occupational Safety and Health Administration: air contaminants.
29 CFR 1926.55 (2003). Occupational Safety and Health Administration: gases, vapors, fumes, dusts, and mists.
ACGIH (2004). Threshold limit values for chemical substances. Cincinnati,OH: American Conference of Governmental Industrial Hygienists.
Akbar-Khanzadeh F, Brillhart RL (2002). Respirable crystalline silica dust exposure during concrete finishing (grinding) using hand-held grinders in the construction industry. An. occup. Hyg. 46:341-346.
Bureau of Mines (1992). crystalline silica primer. Washington, DC: U.S. Department of the Interior, Bureau of Mines, Branch of Industrial Minerals, Special Publication.
Glindmeyer HW, Hammad YY (1988). Contributing factors to sandblasters' Silicosis: inadequate respiratory protection equipment and standards. J Occup Med. 30:917-921.
HSE (1997). MDHS 14/2. General methods for sampling and gravimetric analysis of respirable and total inhalable dust. Methods for the determination of hazardous substances. Health and safety laboratory. Sudbury, Suffolk, UK: Health and Safety Executive.
Hornung R, Reed L (1990). Estimation of average concentration in the presence of nondetectable values. Applied Occupational and Environmental Hygiene, 5(1):46-51.
Linch, KD (2002). Respirable concrete dust-Silicosis hazard in the construction industry. Appl. Occup. and Environ. Hyg. 17: 209-221.
Neuhauser, Curt (curt.neuhauser@dot.state.wi.us) (2004) RE: US 12 project. Private email message to Alan Echt (AEcht@cdc.gov), January 7.
New Jersey Department of Health and Senior Services (2001) New Jersey silica partnership In: Occupational Health Surveillance Update, February. Trenton, NJ: NJ Department of Health and Senior Services; Division of Epidemiology, Environmental and Occupational Health, Occupational Health Service, Occupational Health Surveillance Program.
NIOSH (1994). NIOSH manual of analytical methods. 4th rev. ed., Eller PM, ed. Cincinnati, OH: U.s. Department of Health and Human Services, Public Health Service, Centers for Disease Control and Prevention, National Institute for Occupational Safety and Health, DHHS (NIOSH) Publication No. 94-113.
NJOSH (2000). Respirable crystalline silica exposures during tuck pointing. Cincinnati, OH: U.S. Department of Health and Human Services, Public Health Service, Centers for Disease Control and Prevention, National Institute for Occupational Safety and Health. DHHS (NIOSH) Publication No. 2000-113.
NIOSH (2002). NIOSH hazard review: health effects of occupational exposure to respirable crystalline silica. Cincinnati, OH: U.S. Department of Health and Human Services, Centers for Disease Control and Prevention, National Institute for Occupational Safety and Health. DHHS (NIOSH) Publication No. 2002-129.
NIOSH (2003). Information Circular/2003: Handbook for dust control in mining. Pittsburgh, P A: U.S. Department of Health and Human Services, Public Health Service, Centers for Disease Control and Prevention, National Institute for Occupational Safety and Health, Pittsburgh Research Laboratory. IC 9465. DHHS (NIOSH) Publication No. 2003-147.
OSHA (1996). Memorandum for regional administrators from: Joseph A. Dear. Subject: special emphasis program (SEP) for Silicosis. May 2nd 1996. Appendix F: Permissible Exposure Limits for construction and Maritime. Retrieved May 24, 2004, from: http://www.osha.gov/SLTC/etools/silica/spec_emph_prog/spec_emph_prog.html
Public Works (1995). Pavement recycling. Public Works 126: April 15, 1995.
Rappaport 8M, Goldberg M, Susi P, Herrick RF (2003). Excessive exposure to silica in the U.S. construction industry. An. occup. Hyg. 47:111-122.
Thorpe A, Ritchie AS, Gibson MJ, Brown RC (1999). Measurements of the effectiveness of dust control on cut-off saws used in the construction industry. Ann. occup. Hyg. 43:443-456.
Table 1: Results of Personal Breathing Zone Samples
Payne and Dolan
October 8, 2003
| Job | Time (min) | Respirable Dust (mg) | Respirable Quartz (mg) | Percent Quartz | Volume (L) | Respirable Dust (mg/m3) | OSHA PEL (mg/m3) | Respirable Quartz (mg/m3) |
|---|---|---|---|---|---|---|---|---|
| Operator | 146 | 0.19 | (0.01) | (5.26) | 598 | 0.32 | 1.38 | (0.02) |
| Foreman | 142 | 0.69 | 0.05 | 7.54 | 549 | 1.26 | 1.05 | 0.09 |
| Skid Steer | 137 | 0.37 | 0.03 | 8.92 | 569 | 0.65 | 0.92 | 0.06 |
| Operator | 156 | 0.087 | ND | 639 | 0.14 | 5.00 | ||
| Foreman | 155 | 1.1 | 0.07 |
6.09 | 600 | 1.83 | 1.24 | 0.11 |
| Skid Steer | 153 | 0.22 | (0.01) | (4.55) | 636 | 0.35 | 1.53 | (0.02) |
| Operator | 197 | 0.26 | (0.01) | (3.85) | 807 | 0.32 | 1.71 | (0.01) |
| Foreman | 198 | 0.15 | ND | 766 | 0.20 | 5.00 | ||
| Skid Steer | 148 | 0.098 | ND | 615 | 0.16 | 5.00 |
ND indicates a result less than the limit of detection for this method of 1 O¡.g of quartz per sample. Results in parentheses indicate a semi-quantitative value between the limit of detection and the limit of quantitation.
Table 2: Results of Personal Breathing Zone Samples
Payne and Dolan
October 9,2003
| Job | Time (min) | Respirable Dust (mg) | Respirable Quartz (mg) | Percent Quartz | Volume (L) | Respirable Dust (mg/m3) | OSHA PEL (mg/m3) | Respirable Quartz (mg/m3) |
|---|---|---|---|---|---|---|---|---|
| UniJet® 11005 Nozzle | ||||||||
| Operator | 138 | 1.3 | 0.08 | 6.00 | 572 | 2.27 | 1.25 | 0.14 |
| Foreman | 117 | 0.4 | (0.03) | (7.50) | 499 | 0.80 | 1.05 | (0.06) |
| Rear Control | 105 | 0.23 | (0.01) | (4.35) | 435 | 0.53 | 1.58 | (0.02) |
| UniJet® 11008 Nozzle | ||||||||
| Operator | 111 | 0.69 | 0.03 | 4.93 | 460 | 1.50 | 1.44 | 0.07 |
| Foreman | 114 | 0.22 | (0.01) | (4.55) | 486 | 0.45 | 1.53 | (0.02) |
| Rear Control | 111 | 0.59 | (0.03) | (5.08) | 460 | 1.28 | 1.41 | (0.07) |
| UniJet® 11008 Nozzle | ||||||||
| Operator | 132 | 0.69 | 0.05 | 6.81 | 547 | 1.26 | 1.13 | 0.09 |
| Foreman | 125 | 0.44 | 0.03 | 7.50 | 533 | 0.83 | 1.05 | 0.06 |
| Rear Control | 134 | 0.31 | (0.01) | (3.23) | 556 | 0.56 | 1.91 | (0.02) |
| UniJet® 11005 Nozzle | ||||||||
| Operator | 114 | 0.93 | 0.05 | 4.95 | 472 | 1.97 | 1.44 | 0.10 |
| Foreman | 111 | 0.21 | (0.01) | (4.76) | 473 | 0.44 | 1.48 |
(0.02) |
| Rear Control | 107 | 0.72 | 0.03 | 4.72 | 444 | 1.62 | 1.49 | 0.08 |
ND indicates a result less than the limit of detection for this method of 10 µg of quartz per sample.
Results in parentheses indicate a semi-quantitative value between the limit of detection and the limit of quantitation.
Table 3: High~Flow Area Sample Results
Payne and Dolan
October 9, 2003
| Location | Nozzle | Respirable Dust (mg) | Respirable Quartz (mg) | % Quartz | Time (min) | Volume (L) | Respirable Dust (mg/m3) | Respirable Quartz (mg/m3) |
|---|---|---|---|---|---|---|---|---|
| Operator | UniJet® 11005 | ND | ** | |||||
| Operator | UniJet® 11008 | 0.18 | ND | 32 | 134 | 1.35 | ||
| Operator | UniJet® 11008 | 0.43 | ND | 128 | 535 | 0.80 | ||
| Operator | UniJet® 11005 | 0.76 | (0.2) | (2.63) | 123 | 514 | 1.48 | (0.04) |
| Cutter Drum Right | UniJet® 11005 | 0.36 | (0.2) | (5.56) | 117 | 491 | 0.73 | (0.04) |
| Cutter Drum Right | UniJet® 11008 | 0.35 | (0.2) | (5.71) | 110 | 461 | 0.76 | (0.04) |
| Cutter Drum Right | UniJet® 11008 | 0.65 | 0.06 | 8.62 | 134 | 562 | 1.16 | 0.10 |
| Cutter Drum Right | UniJet® 11005 | 0.87 | 0.04 | 4.71 | 125 | 524 | 1.66 | 0.08 |
| Rear Controls Right | UniJet® 11005 | 0.12 | ND | 117 | 490 | 0.24 | ||
| Rear Controls Right | UniJet® 11008 | 0.27 | ND | 114 | 477 | 0.57 | ||
| Rear Controls Right | UniJet® 11008 | 0.2 | (0.2) | (10.00) | 130 | 545 | 0.37 | (0.04) |
| Rear Controls Right | UniJet® 11005 | 0.6 | (0.2) | (3.33) | 125 | 524 | 1.15 | (0.04) |
| Rear Controls Left | UniJet® 11005 | 1.3 | 0.07 | 5.23 | 109 | 454 | 2.86 | 0.15 |
| Rear Controls Left | UniJet® 11008 | 0.58 | 0.04 | 6.03 | 58 | 242 | 2.40 | 0.14 |
| Rear Controls Left | UniJet® 11008 | 1.6 | 0.12 | 7.50 | 126 | 525 | 3.05 | 0.23 |
| Rear Controls Left | UniJet® 11005 | 2.8 | 0.12 | 4.29 | 131 | 546 | 5.13 | 0.22 |
| Cutter Drum Left | UniJet® 11005 | 1.6 | 0.10 | 6.25 | 113 | 475 | 3.37 | 0.21 |
| Cutter Drum Left | UniJet® 11008 | 1.6 | 0.10 | 6.25 | 114 | 479 | 3.34 | 0.21 |
| Cutter Drum Left | UniJet® 11008 | 0.86 | 0.05 | 6.76 | 130 | 546 | 1.57 | 0.10 |
| Cutter Drum Left | UniJet® 11005 | 0.87 | 0.04 | 4.94 | 130 | 546 | 1.59 | 0.08 |
| Upper Conveyor | UniJet® 11005 | 3 | 0.35 | 11.67 | 124 | 525 | 5.71 | 0.67 |
| Upper Conveyor | UniJet® 11008 | 1.9 | 0.10 | 5.16 | 106 | 449 | 4.23 | 0.22 |
| Upper Conveyor | UniJet® 11008 | 1.9 | 0.21 | 11.05 | 140 | 593 | 3.20 | 0.35 |
| Upper Conveyor | UniJet® 11005 | 1.8 | 0.11 | 6.11 | 132 | 559 | 3.22 | 0.20 |
ND indicates a result less than the lit of detection for this method of 10µg of quartz per sample.
Results in parentheses indicate a semi-quantitative value between the lit of detection and the lit of quantitation.
Table 4: Low-Flow and pDR Area Sample Results
Payne and Dolan
October 8, 2003
| Sampling Location | Sample Time (min.) | Gravimetric Respirable Dust (mg/m3) | Average Respirable Dust at Location (mg/m3) | pDR Respirable Dust (mg/m3) | Gravimetric/pDR Ratio |
|---|---|---|---|---|---|
| Operator | 498 | 0.0309 | 0.32 | 0.216 | 1.469 |
| 501 | 0.325 | ||||
| Cutter Drum Right | 514 | 0.753 | 0.72 | 0.0633 | 1.133 |
| 515 | 0.681 | ||||
| Cutter Drum Left | 507 | 0.486 | 0.50 | 0.722 | 0.692 |
| 507 | 0.513 | ||||
| Rear Controls Right | 505 | 0.714 | 0.85 | 0.856 | 0.989 |
| 505 | 0.980 | ||||
| Upper Conveyor | 522 | 3.333 | 2.79 | 3.315 | 0.841 |
| 522 | 2.244 | ||||
| Rear Controls Left | 518 | 1.742 | 1.70 | 1.750 | 0.973 |
| 522 | 1.664 |
Table 5: Low-Flow and pDR Area Sample Results
Payne and Dolan
October 9, 2003
| Sampling Location | Sample Time (min.) | Gravimetric Respirable Dust (mg/m3) | Average Respirable Dust at Location (mg/m3) | pDR Respirable Dust (mg/m3) | Gravimetric/pDR Ratio |
|---|---|---|---|---|---|
| Operator | 505 | 0.964 | 1.00 | 0.989 | 1.015 |
| 505 | 1.043 | ||||
| Cutter Drum Right | 498 | 1.938 | 1.82 | 1.839 | 0.992 |
| 499 | 1.709 | ||||
| Cutter Drum Left | 506 | 2.882 | 2.88 |
2.939 | 0.980 |
| 504 | 1.850 | pinched hose | |||
| Rear Controls Right | 498 | 0.519 | 0.65 | 0.746 | 0.867 |
| 498 | 0.775 | ||||
| Upper Conveyor | 507 | 3.169 | 2.68 | 3.297 | 0.812 |
| 507 | 2.184 | ||||
| Rear Controls Left | 506 | 2.696 | 2.62 | 2.459 | 1.066 |
| 506 | 2.545 |
Table 7: Descriptions of Milling Machine Cuts
Payne and Dolan
October 9, 2003
| Cut ID | Elapsed Time (minutes) | Distance Cut (feet) | GPS Average Velocity (ft/min) | Average speed from time study | Average Cut Depth (inches) | Average Cut Width (inches) | Nozzle Type | |
|---|---|---|---|---|---|---|---|---|
| m/min | ft/min | |||||||
1 |
17.6 |
446 |
25.3 |
9 | 29.5 | 9 | 98 | UniJet® 11005 |
Back up |
5.9 |
1412 |
238.7 |
|||||
2 |
67.3 |
1255 |
18.6 |
7.1 | 23.3 | 7.4 | 98 | UniJet® 11005 |
2A |
34.1 |
690 |
20.2 |
7.4 | 24.3 | 9.5 | 98 | UniJet® 11008 |
Back up |
7.2 |
1893 |
264.8 |
|||||
3 |
68.5 |
1805 |
26,4 |
7.1 | 23.2 | 7.8 | 98 | UniJet® 11008 |
Back up |
7.1 |
1877 |
264.9 |
|||||
4 |
28.7 |
1117 |
39.0 |
10.4 | 34 | 6.7 | UniJet® 11008 | |
4A |
44.9 |
771 |
17.2 |
5.2 | 17.1 | 10.9 | 97 | UniJet® 11005 |
| Back up | 6.8 | 1778 | 263.4 | |||||
| 5 | 42.8 | 1582 | 36.9 | 9.4 | 30.7 | 6.3 | 98 | UniJet® 11005 |
Elapsed times are actual operating times.
Table 8: Respirable Dust Mean by UniJet® Nozzle Type
Payne and Dolan
October 9, 2003
| # of 11005 Samples | Fraction of 11005 Samples > PEL | Mean (SD) 11005 | Number of 11008 Samples | Fraction of 11008 Samples > PEL | Mean (SD), 11008 | Geom Mean (GSD) 11005 | Geom Mean (GSD), 11008 | 11005 GM/ 11008 GM |
|---|---|---|---|---|---|---|---|---|
| 17 | 0.59 | 2.05 (1.58) | 18 | 0.50 | 1.59(1.15) | 1.50 (2.39) | 1.25 (2.07) | 1.5/1.25=1.2 |
Table 9: Respirable Dust Means and Geometric Mean by Area or Personal Sample
Payne and Dolan
October 8 and 9, 2003
| Date | Personal or Area Sample | UniJet ® 11005 Number of Samples | Fraction of UniJet® 11005 Samples > PEL | Mean (SD), UniJet® 11005 | UniJet® 11008 Number of Samples | Fraction of UniJet® Samples > PEL | Mean (SD), UniJet® 11008 | Geom Mean (GSD), UniJet® 11005 | Geom Mean (GSD), UniJet® 11008 | UniJet® 11005 GM/ UniJet® 11008 GM |
|---|---|---|---|---|---|---|---|---|---|---|
| 10-08 | P | 9 | 0.22 | 0.58(0.58) | 0.40(2.45) | |||||
| 10-09 | P | 6 | 0.50 | 1.27(0.78) | 6 | 0.33 | 0.98(0.43) | 1.05(2.02) | 0.89(1.64) | 1.05/0.89=1.18 |
| 10-09 | A | 11 | 0.64 | 2.47(1.77) | 12 | 0.58 | 1.90(1.29) | 1.82(2.52) | 1.47(2.20) | 1.82/1.47=1.24 |
Table 10: Respirable Dust Mean and Geometric Mean by Worker
Payne and Dolan
October 8 and 9, 2003
| Date | Worker | Number of |
Mean (SD), UniJet® 11005 | Number of UniJet® 11008 Samples | Mean (SD), UniJet® 11008 | Geom Mean (GSD), UniJet® 11005 | Geom Mean (GSD), UniJet® 11008 | UniJet® 11005 GM/ UniJet® 11008 GM |
|---|---|---|---|---|---|---|---|---|
| 10-08 | Foreman | 3 | 1.10 (0.83) | 0.77(3.27) | ||||
| 10-08 | Operator | 3 | 0.26(0.10) | 0.24(1.61) | ||||
| 10-08 | Skid Steer | 3 | 0.39(0.25) | 0.33(2.02) | ||||
| 10-09 | Foreman | 2 | 0.62(0.25) | 2 | 0.64(0.27) | 0.59(1.53) | 0.61(1.54) | 0.59/0.61=0.97 |
| 10-09 | Operator | 2 | 2.12(0.21) | 2 | 1.38(0.17) | 2.11(1.11) | 1.37(1.13) | 2.11/1.37=1.54 |
| 10-09 | Rear Control | 2 | 1.08(0.77) | 2 | 0.92(0.51) | 0.93(2.20) | 0.85(1.79) | 0.93/0.85=1.09 |
Table 11: Respirable Dust Mean and Geometric Mean by Location
Payne and Dolan
October 8 and 9, 2003
| Date | Location | Number of UniJet ® 11005 Samples |
Mean (SD), UniJet® 11005 | Number of UniJet® 11008 Samples | Mean (SD), UniJet® 11008 | Geom Mean (GSD), UniJet® 11005 | Geom Mean (GSD), UniJet® 11008 | UniJet® 11005 GM/ UniJet® 11008 GM |
|---|---|---|---|---|---|---|---|---|
| 10-09 | Cutter Drum Left | 2 | 2.48(1.26) | 2 | 2.46(1.25) | 2.31(1.70) | 2.29(1.71) | 2.31/2.29=1.01 |
| 10-09 | Rear Controls Left | 2 | 4.00(1.61) | 2 | 2.73(0.46) | 3.83(1.51) | 2.71(1.18) | 3.83/2.71=1.41 |
| 10-09 | Operator | 1 | 1.48 | 2 | 1.08(0.39) | 1.48 | 1.04(1.45) | 1.48/1.04=1.42 |
| 10-09 | Cutter Drum Right | 2 | 1.20(0.66) | 2 | 0.96(0.28) | 1.10(1. 79) | 0.94(1.35) | 1.10/0.94=1.17 |
| 10-09 | Upper Conveyor | 2 | 4.47(1.76) | 2 | 3.72(0.73) | 4.29(1.50) | 3.68(1.22) | 4.29/3.68=1.17 |
| 10-09 | Rear Controls Right | 2 | 0.70(0.64) | 2 | 0.47(0.14) | 0.53(3.03) | 0.46(1.36) | 0.53/0.46=1.15 |
Table 12: Respirable Quartz Means by UniJet® Nozzle Type
Payne and Dolan
October 9, 2003
| # of 11005 Samples | Mean (SD) 11005 | # of 11008 Samples | Mean (SD) 11008 | Geom Mean (GSD) 11005 | Geom Mean (GSD) 11008 | 11005 GM/ 11008 GM |
|---|---|---|---|---|---|---|
| 17 | 0.13(0.16) | 18 | 0.10(0.094) | 0.078(2.69) | 0.067(2.64) | .078/.067=1.16 |
Table 13: Respirable Quartz Means and Geometric Means by Area or Personal Sample Payne and Dolan October 8 and 9,2003
| Date | Personal or Area Sample | Number of UniJet ® 11005 Samples |
Mean (SD), UniJet® 11005 | Number of UniJet® 11008 Samples | Mean (SD), UniJet® 11008 | Geom Mean (GSD), UniJet® 11005 | Geom Mean (GSD), UniJet® 11008 | UniJet® 11005 GM/ UniJet® 11008 GM |
|---|---|---|---|---|---|---|---|---|
| 10-08 | P | 9 | 0.040(0.039) | |||||
| 10-09 | P | 6 | 4.00(1.61) | 6 | 0.054(0.026) | 0.057(2.02) | 0.048(1.81) | 0.057/0.048=1.19 |
| 10-09 | A | 11 | 0.16(0.19) | 12 | 0.13(0.11) | 0.092(3.03) | 0.080(2.99) | 0.092/0.80=1.15 |
Table 14: Respirable Quartz Means and Geometric Mean by Worker
Payne and Dolan
October 8 and 9, 2003
| Date | Worker | Number of |
Mean (SD), UniJet® 11005 | Number of UniJet® 11008 Samples | Mean (SD), UniJet® 11008 | Geom Mean (GSD), UniJet® 11005 | Geom Mean (GSD), UniJet® 11008 | UniJet® 11005 GM/ UniJet® 11008 GM |
|---|---|---|---|---|---|---|---|---|
| 10-08 | Foreman | 3 | 0.072(0.55) | 3 | 0.046(4.03) | |||
| 10-08 | Operator | 3 | 0.018(0.0062) | 3 | 0.017(1.46) | |||
| 10-08 | Skid Steer | 3 | 0.029(0.025) | 3 | 0.023(2.29) | |||
| 10-09 | Foreman | 2 | 0.039(0.022) | 2 | 0.041(0.029) | 0.035(1.82) | 0.036(2.18) | 0.035/0.036=0.97 |
| 10-09 | Operator | 2 | 2.12(0.21) | 2 | 0.080(0.0085) | 0.12(1.27) | 0.080(1.11) | 0.12/0.080=1.5 |
| 10-09 | Rear Control | 2 | 0.052(0.035) | 2 | 0.041(0.022) | 0.046(2.06) | 0.038(1.77) | 0.046/0.038=1.21 |
Table 15: Respirable Quartz Means and Geometric Means by Location
Payne and Dolan
October 8 and 9, 2003
| Date | Location | Number of UniJet ® 11005 Samples |
Mean (SD), UniJet® 11005 | Number of UniJet® 11008 Samples | Mean (SD), UniJet® 11008 | Geom Mean (GSD), UniJet® 11005 | Geom Mean (GSD), UniJet® 11008 | UniJet® 11005 GM/ UniJet® 11008 GM |
|---|---|---|---|---|---|---|---|---|
| 10-09 | Cutter Drum Left | 2 | 0.14(0.093) | 2 | 0.15(0.079) | 0.13(2.01) | 0.14(1.72) | 0.13/0.14=0.93 |
| 10-09 | Rear Controls Left | 2 | 0.18(0.050) | 2 | 0.19(0.059) | 0.18(1.31) | 0.18 (1.38) | 0.18/0.18=1 |
| 10-09 | Operator | 1 | 0.049() | 2 | 0.033(0.028) | 0.049 | 0.026(2.67) | 0.049/0.026=1.88 |
| 10-09 | Cutter Drum Right | 2 | 0.054(0.034) | 2 | 0.067(0.046) | 0.049(1.94) | 0.059(2.11) | 0.049/0.059=0.83 |
| 10-09 | Upper Conveyor | 2 | 0,43(0.33) | 2 | 0.29(0.096) | 0.36(2.37) | 0.28(1.41) | 0.36/0.28=1.29 |
| 10-09 | Rear Controls Right | 2 | 0..024(0.014) | 2 | 0.027(0.01 7) | 0.022(1.85) | 0.024(1.97) | 0.022/0.024=0.92 |
Figure 1: Water flow meters
Figure 2: Cutter drum water supply pressure gauge 27
Figure 3: GPS instrument location.
Figure 4: Area sampling array
Figure 5: Area Sample Locations
Figure 6: Operator and foreman, Foreman is operating right rear controls.
Figure 7: Position of operator and locations of personal and area samplers