
Summary Statement
A report on a study of the effectiveness of planned OSHA inspections, including details of the methods, results and recommendations.
Marach 1999
The Directorate of Construction
Occupational Safety and Health Administration
U.S. Department of Labor
In response to Contract No. B9F91522
Electronic Edition
March 1999
Contents
| Summary |
iii
|
| Acknowledgments |
V
|
Addendum:
Demonstration to Test Planned Programmed Inspection Effectiveness 38
Appendix 1: Summary of Data
Appendix 2: Agenda for Site Visit to CRA (not included in electronic
edition)
Appendix 3: Protocol for Interviews (not included in electronic
edition)
Appendix 4: Literature Reviewed (not included in electronic edition)
Background:
This study was solicited by OSHA to provide a critical review of the current
system for scheduling random inspections in the construction industry,
known as planned programmed inspections. These inspections are one of
two ways that OSHA enforces the law and regulations for occupational safety
and health, and are inevitably compared to the other approach, known as
unprogrammed inspections, which involve inspections of employers based
on cause.
The current system for planned programmed inspections was developed in
1988 in response to a Supreme Court ruling and a report from the Department's
Inspector General. This system uses national data on anticipated or active
construction projects from F.W. Dodge and selects projects for inspection
using a model administered by Construction Resources Analysis (CRA) at
the University of Tennessee. The area offices receive monthly lists of
inspection targets selected at random by CRA and meeting certain criteria
specified by the OSHA national office and the area offices.
There is a tradeoff between neutrality and inspection effectiveness as
measured in terms of violations and penalties. The planned programmed
inspections, based on neutral selection of inspection targets, are bound
to produce "less inspection bang" than the unprogrammed inspections that
are based on cause. In the literature on inspection systems, a central
issue is how to compare random inspections directed at all subjects to
"for cause" inspections directed at likely "bad actors." Is one system
better than the other, and can one exist without the other and still be
equally effective?
We based this study on the available technical literature, inspection
data obtained from OSHA's Integrated Management Information Service (IMIS),
a site visit to the CRA facility in Knoxville, and structured telephone
interviews with senior staff in the national office, five regional offices
and 11 area offices.
Findings: We heard an unusually wide range of opinions in our interviews
with OSHA field managers. There are those who think the planned programmed
system is worthless. Others think the current system is excellent.
We found the truth to lie somewhere in between.
There is an institutional ambivalence about the planned programmed inspections
throughout the Agency. Many field managers think they take too many resources
and produce too few results. At the same time, most OSHA field managers
agree that the Agency needs some type of random inspection system to establish
OSHA's presence and to act as a deterrent to all employers. But how that
should be accomplished and what portion of the Agency's inspection resources
it should occupy has not been addressed, and that's part of the problem.
We found that the
IMIS data have many deficiencies that raise questions about their validity
in assessing different types of inspections. Based on IMIS, we found that
the Agency performs planned programmed inspections on fewer than 2,000
construction sites per year. Of the sites assigned to the area offices,
less than 14 percent are inspected. What happens to the rest is anybody's
guess.
Planned programmed inspections result in 25 percent fewer violations and
penalties per inspection than the average for all types of OSHA construction
inspections. But they also take 25 percent less time to conduct.
Field managers expressed many valid criticisms about the existing system,
including deficiencies in the Dodge data and the CRA schedules. Those
deficiencies do not outweigh the benefits of both the Dodge data and the
CRA modeling. There are inherent problems in anticipating when a construction
project is going to be active or not, and the smaller the project the
less confidence there is in the scheduling. Thus the current system works
best for larger construction projects and therefore selects larger employers
too often.
A number of area offices demonstrate that planned programmed inspections
can be performed in ways that minimize resource waste due to inactive
sites. At least one area office has found a way to use CRA to get at the
most hazardous employers. At the same time, other area offices have a
poor understanding of the system and how to make best use of it.
Recommendations: Planned programmed inspections are important,
but the Agency needs to redefine their role and establish more clearly
the expectations it has about their role. It should give the area offices
more leeway to devise their own planned programmed inspection systems,
but in order to do so the national office needs to establish better procedures
for the review of proposed systems and the ongoing monitoring of implementation.
The IMIS system needs to be reviewed in terms of data entry. While this
system in all likelihood is accurate in some of the key respects, classification,
coding and data entry about inspection type is woefully lacking in quality
control. It is also critical that inspectors file reports on all inspections
of construction sites, even where the site turns out to be inactive, and
a short reporting form should be developed for this purpose.
F.W. Dodge provides the only national data base on construction activities
and OSHA should continue to use it. The CRA contract is a very good bargain,
but the Agency should find ways to make better use of its resources to
evaluate the effectiveness of the construction enforcement program. In
particular, it should use CRA's expertise to characterize the industry
for each area office jurisdiction in terms of risk profiles, and then
compare inspection activity as reported in IMIS against these profiles.
To ultimately test the value of the planned programmed inspections, we
have outlined a possible three-year demonstration to evaluate different
inspection systems.
There are number of immediate steps the Agency can take to improve the
planned programmed inspection system, mainly by providing more information
about how area offices can use the system, communicating solutions that
area offices have developed by establishing an internal web site for this
purpose, developing a self learning program for area office staff, and
providing progress reports at all regional conferences for area office
managers.
Many people assisted in this project. At the national office, Bruce Swanson, Berrien Zettler, John Franklin and Joe DuBois provided extensive information. The IMIS staff performed numerous data runs. The staff of the Construction Resources Analysis at the University of Tennessee were very helpful in accommodating a site visit, providing extensive information, and conducting a field validation study of the construction schedules in the Knoxville area. Most importantly, we thank the many hard working people we talked to at regional and area offices for their interest, time, patience and expertise.
The contract for this study1 calls for a critical examination of the current construction inspection scheduling process. In a post-award meeting with Bruce Swanson, Director of the Directorate of Construction and his deputy, H. Berrien Zettler2, two key questions were identified for study: 1) does the existing approach achieve the most optimal selection of employers for inspection? and 2) can or should an improved system be devised?
It was agreed that the report would focus on whether the Agency could improve the effectiveness of its programmed construction inspections while maintaining the neutrality required by the courts, and that the evaluation would concentrate on three areas:
- An analysis of
Marshall v. Barlow's, Inc.3 with the aim of defining
more clearly what criteria OSHA should use to select employers for programmed
inspections to meet the two objectives of 1) showing fairness to all
employers while 2) optimizing the safety and health effectiveness of
the programmed inspections. This analysis was to include OSHA's consideration
of these objectives in Directive CPL 2.251 - Scheduling System for
Programmed Inspections and the Interim Directive for Inspection Targeting.
- An assessment of the quality of Dodge data and University of Tennessee methodology with the aim of understanding the extent to which this approach meets both the fairness and effectiveness objectives, and whether improvements can or should be made. This assessment was also to consider whether there are other uses of the Dodge data and University of Tennessee expertise in analyzing those data for purposes of better evaluating the performance of OSHA's construction safety and health programs.
1On October 23, 1998 OSHA's Directorate of Construction issued a professional services contract to Dr. Knut Ringen with the following tasks: a) Assess the efficacy of the Dodge report data with a survey of selected OSHA field offices; b) Assess the University of Tennessee program to develop construction inspection schedules; c) Propose alternative inspection scheduling methodologies; and d) Evaluate the data developed by the University of Tennessee and make recommendations as to how these data might be used to predict trends and other measures of construction. The schedule to deliver the final report was extended by one month due to the need for more data analysis than anticipated and the completion of a field validation study of the CRA model.
2At OSHA, Washington D.C. Nov. 10, 1998
3429 US 1347,97 S. Ct. 776(1977). Here after referred to as Barlow's.
- An assessment of how the OSHA area offices select employers for programmed inspections in real life, the extent to which these practices rely on the Dodge data/University of Tennessee methodology, and where area office practices deviate from this system, how well they meet the combined objectives of fairness and effectiveness. This assessment was also to examine whether a protocol could be developed to enable area offices greater latitude in their approaches to selecting employers for scheduled inspections where use of local resources make this possible, while ensuring that such approaches are consistent with Barlow's. This part of the project was to entail telephone interviews with regional administrators and area office directors.
The study has relied on the following approaches.
Review of Available Materials. We have collected available literature, interpretations and directives, and studies and opinions from within the Agency, including its headquarters and field offices, as well as from outside the Agency.
Collection of Data. We have obtained an extensive amount of data from the Agency's headquarters as well as field offices. These data are preliminary, and we were not able, within the time and resources available for this project, to assess their validity. Data reported here are combined for FY 1996-98 unless otherwise indicated. We included Federal OSHA inspection data only, and omitted all data from Regions VIII, IX and X because they primarily cover state OSHA plans. In addition, the University of Tennessee's Construction Resources Analysis (CRA), which is a subject of this study, offered to conduct a field validation of the scheduling model in the Knoxville area. Key data are summarized in Appendix 1.
Site Visit to
CRA. We made a full day visit to the University of Tennessee to assess
the facilities and staff of CRA, and to review the quality of its performance.
H. Berrien Zettler represented the Agency.
Interviews with OSHA Field Offices. We performed telephone interviews
with a total of 5 regional offices and 11 area offices. These interviews
were guided by a standardized protocol, and lasted between 30 minutes
and 1 hour and 15 minutes..
Certain terms are used throughout this report. While these terms are commonly used within the Agency, there are inconsistencies in interpretation or use of these terms. Therefore, we have developed the following informal definitions to describe how we use these terms throughout this report.
-
Construction Inspection.
This is an inspection of an employer engaged in a construction activity.
It is important to understand that today, a construction inspection inside
OSHA is not defined as a visit to a construction site, and data on inspections
do not reflect the number of construction sites visited, but rather reflect
the number of employers on the sites visited.
Programmed Inspection. This refers a comprehensive inspection in most cases, in a high hazard industry, which includes by definition construction, where some type of administrative procedure that is systematic and neutral is used to select the target for the inspection.. This refers to programmed inspections in construction that use one of two categories of approaches to selecting worksites:
Planned Programmed
Inspection. This refers to programmed inspections in construction
that use one of two categories of approaches to selecting worksites:
Scheduled
Inspections. These are planned programmed inspections that use
the F.W. Dodge/CRA scheduling system developed by the national office.
SEP Inspections. These are Special Emphasis programmed inspections
that may have been developed by the national office, the regional
offices or the area offices and are directed at a special problem
(e.g., fall protection).
3In this report, an inspection means a "safety" inspection. We have not included health inspections, which are rare in construction.
4On this point Agency policy is consistent. There is continuous and sometimes confusing intermixing of the terms worksite, employer and establishment. On the one hand, inspections are directed at establishments (i.e., employers), because in general industry establishment and worksite usually involve the same controlling entity. On the other hand, the Agency specifies that because of the transient nature of construction, worksites are to selected for programmed inspections rather than employers, and uses the term employer rather than establishment. OSHA Directive CPL 2.251 - Scheduling System for Programmed Inspections, section B.1.b.(2)
-
Unprogrammed Inspections.
These are inspections resulting from imminent dangers, fatalities or serious
injuries, complaints or referrals.
Inspector. This refers to an OSHA official who inspects construction sites. For purposes of this report, an inspector is the same as a CSHO. In this report, which focuses on safety (as opposed to health), we report data per inspector using as the denominator all safety inspectors in the regions.
Field Manager. This a director or other senior official in OSHA's regional offices and area offices.
Violation. This is the finding by an inspector that an employer has failed to meet his or her responsibilities under the OSHAct and related regulations.
Penalty. This is the monetary fine which the Agency issues pursuant to a violation.
5The SEP inspections pose a classification problem. Most of the SEP inspection targets are CSHO referrals, and these should not be classified as planned programmed inspections. Nevertheless, they usually are.
The idea behind the planned programmed inspections is that any employer anywhere in the construction industry is a possible candidate for an OSHA inspection. In theory, planned programmed inspections give the Agency a presence throughout the industry, and by doing so act as a deterrent against hazards on the job.
In 1977, the US Supreme Court issued its ruling Ray Marshall v. Barlow's, Inc.6 The thrust of Barlow's is to prevent unbridled use of government power and discretion, and specifically to prevent practices based on prejudice. Thus, the Court required that to conduct an inspection of an employer without a showing of probable cause, OSHA would need to show that the employer was selected for inspection based upon a reasonable administrative decision process using "specific neutral criteria."We read the requirement for "specific neutral criteria" as a means of preventing actions based on prejudice. We believe, however, that the decision still allows OSHA full authority to discriminate between classes of employers--e.g., by weighing high hazard activities. The decision does not require the Agency to blindly select its targets from all employers in an industry, and therefore does not equate "neutrality" with "randomness."
Just as the Agency has classified construction as a high hazard industry, it is perfectly legitimate for OSHA to classify certain segments of the construction industry as high hazard construction activities as long as there is a reasonable basis for doing so. Such classifications can include certain kinds of construction projects that involve a high risk of a specific hazard, such as falls or electrocutions; or work under certain conditions that pose high risks, such as highway or bridge work; or it can include certain employers specializing in hazardous work, such as roofers or crane operators; or certain classes of employers with high injury or illness risks, such as employers below a certain size. In other words, rather using the universe of construction as the sampling frame, OSHA can stratify the universe into many smaller sampling frames and select from them using a neutral methodology.
In 1987, the Department of Labor's Office of Inspector General issued a report finding that the Agency was not in compliance with Barlow's, and instructed the Agency to develop new policies and procedures7.6The author of this report is not a lawyer, and as a result, is not qualified to render a legal opinion concerning permissible practices under Ray Marshall v. Barlow's, Inc., 429 US 1347, 97 S. CT 776 (1977). What is presented here is our oversimplified interpretation of a complex issue argued by specialists over decades.
7Office of Inspector General. Special Review of OSHA Enforcement Activities. Report No. 02-6-028-10-105, Sept. 11, 1987.
2.2 How the Current System is Supposed to Work
A new system for planned programmed inspections was originally developed by the Agency in 1988 and subsequently refined. It has three basic elements:
a. The F.W. Dodge Data Base
The F.W. Dodge Company conducts a regular survey of planned construction in the US and provides its data base to customers for a variety of purposes. The US Department of Labor contracts with F.W. Dodge to deliver the Dodge report on a monthly basis.
b. The CRA Analysis
Each month the Dodge report, which is an electronic data file, is transmitted by OSHA to the CRA. CRA has developed an econometric model which it applies to the Dodge data to produce and maintain a data base of all active projects for their estimated duration, and to prepare a list of projects based on a random sample of all construction in each of OSHA's area office catchment areas based upon criteria set by the national office and local criteria set by many area offices. This list of selected projects is sent to each area office each month.
c. The Area Offices
The area offices may make certain exceptions to this system in order to accommodate local conditions. The area offices may request that CRA apply certain default (or deletion) features, such as the size of project, or type of project, or geographic emphasis area. They may also request a change in the number of assigned construction projects if they are short on inspection personnel or if they have unused inspection capacity that they would like to fill. Such defaults or special requests must be approved by the regional or national offices. If the area office finds it cannot complete all the inspections on the list, they may be carried over to the next month or they are returned to CRA at the end of the month to be reentered into the universe from which the random selections are made9.8A description of the current system is in The OSHA Construction Inspection System and How It Works. (Unfortunately, this document, which is undated and does not identify the sponsoring office, has a cover sheet with the title OSHA Construction Information System.)
2.3 The Tradeoff Between.
9There are detailed directions that the area offices should follow to comply with the system. See OSHA Directive CPL 2.251 - Scheduling System for Programmed Inspections, section B.1.b (2)
2.3
The Tradeoff Between
eutrality and Effectiveness
The dispute about the planned programmed inspections centers on whether they represent a good use of the Agency's time and resources. There is a very clear conflict and tradeoff between the objective of achieving neutrality in the selection of inspection targets and the objective of maximizing Agency effectiveness, defined (in the absence of better measures) as the number of violations and the amount of penalties issued per inspection.
By definition, an unbiased system will yield a less satisfactory end result than a system that is designed to be biased in such a way that it maximizes the end result. OSHA defines the end result as average number of violations or size of penalties resulting from the inspections. Under this definition, planned programmed inspections, which are based on a neutral selection of inspection targets, are inherently bound to yield lower returns than unprogrammed inspections which are based on cause.
If, on the other
hand, OSHA were to define the end result as injury and illness rates in
the industry, it would be possible to compare the impact of enforcement
strategies based on "unbiased" selection v. "biased"
selection. Unfortunately, the Agency does not collect data to allow this
comparison.
2.4 Tradeoff Considerations
There is nothing in the law that says that OSHA has to perform planned programmed inspections. OSHA could rely on "for cause" inspections entirely. This simple tradeoff leads to a number of considerations:
- Given that programmed inspections will result in lower returns in terms of violations and penalties, are they worth conducting?
- If the planned programmed inspections are worth conducting, which approaches should the Agency adopt to maximize its use of inspection resources?
- Under optimal resource use conditions, what proportion of the total construction inspections should be devoted to planned programmed inspections?
3.
Deficiencies in the IMIS Data
In order to attempt a factual analysis of the planned programmed inspection system (see section 6) we asked OSHA to supply us with data from the OSHA Integrated Management Information Service (IMIS) according to our specifications. While we have used these data as the basis for this assessment, we have very serious doubts about the quality and reliability of the data. Our doubts have been reinforced by the interviews we conducted with the field managers. Although an evaluation of data validity was beyond the scope of this project, we found glaring problems in the data we received.10
10IMIS is a very important data base. It is used to justify OSHA's existence and budget, for Congressional oversight, and to evaluate performance and set Agency priorities. See US Department Of Labor. Twenty Years of OSHA Federal Enforcement Data, January 1993. Our analysis was limited to comparing the impact of different types of inspections, and the findings presented here do not address the quality of the underlying key enforcement data, such as reliability of employer identification, types of violations, and penalty amounts.
The IMIS data do not appear to be internally consistent. This means that it is not possible to relate one data query to another with reliability:
- There were differences
in numbers for identical categories between runs of the same data for
the same time periods if the data query was posed differently. For instance,
we have received three different numbers for "total construction
inspections" for FY 96-98.
- According to the area office director, the total number of planned programmed inspections reported by IMIS for FY 98 for one area office was double the actual number of inspections performed.
The data system omits certain data that are critical to making a meaningful assessment of OSHA's effectiveness:
- There is no reliable information on construction sites which are visited but are inactive at the time of the visits. Therefore, we do not know what the actual rate of construction sites being inactive at the time of the scheduled inspection, or if it differs much for different types of inspections, such as planned programmed v. complaint inspections.
- Although we requested it, we were not able to get data for the planned programmed inspections with a Dodge number. Therefore, we do not know exactly what percentage of planned programmed inspections involved sites selected from the Do100dge/CRA system.
- The system provides insufficient data on each construction site to make meaningful comparison to industry characteristics, and does not have a denominator for either construction activity or injury and illness rates. Therefore OSHA has no way in which to measure impact on safety and health outcomes.
We heard too many conflicting uses of basic terms by OSHA field staff, which must lead to significant deficiencies in the IMIS data base. We were also told, quite frankly, that inspections could be classified to meet some management objective, even if this resulted in an erroneous classification of the actual inspection activity. Among a large number of classification problems, the following are particularly significant:
- Special emphasis inspections are classified as either program or unprogrammed inspections.
- CSHO referrals are classified as either programmed or unprogrammed inspections.
- "Related" inspections (whether programmed- or unprogrammed-) is a grab-bag of different situations. "Related" accounts for 25% of all programmed inspections. Many program-related inspections are actually unprogrammed inspections resulting from a drive-by CSHO referral.
- Although focused inspections are only to be used as part of programmed inspections, roughly 4% of all unprogrammed inspections are classified as focused inspections.
We have reason to believe that data entry may be unreliable. We were told that many inspectors leave data entry to clerks in the area offices without providing sufficient guidance in terms of which classifications to fill in.
Area offices told us that there are no data auditing or quality control procedures, such as edit checks or other manual or automated systems to verify or quantify data errors in the system. It is our understanding that OSHA once did perform quality checks, but discontinued the practice for budget reasons.
The system does not seem to be set up to answer many obvious policy questions. We asked twice for data to compare the rate of violations and the amount of penalties in programmed and unprogrammed inspections. Special data runs were required for this basic information, and we did not received what we asked for.
4. Assessment of the F.W. Dodge Data
We have considered the Dodge data base from this perspective: Does it produce a sufficiently valid universe of all construction to provide a sample that will act to maximize the safety and health impact from the inspections performed on the sites selected from it?
In 1992 Meridian Research, Inc. performed an assessment of the Dodge data files for OSHA's Office of Statistics11. The aim was to determine whether the Dodge data provide a fair representation of the construction industry as a whole, and whether there were alternative sources of data available to the Agency from which it could select construction projects for planned programmed inspections. We have not attempted to replicate the Meridian work, which serves the purposes of this study adequately. It found that Dodge in general provides an adequate universe, and that there is no equivalent alternative to it12.11Meridian Research. Review of Coverage Issues Related to the Universe File used by OSHA for Construction Inspection Targeting . OSHA: Office of Statistics, Sept. 30, 1992.
12When Meridian reviewed this issue in 1992, it considered an alternative data base called CMD (Construction Market Data.) At that time, CMD covered only 22 states and was not automated. It does have some features that may be an advantage over Dodge, particularly in the scheduling of projects, including updated start-dates. However, based on our interviews at CRA, it is still not a national data base.
4.1 Is Underreporting a Problem?
Dodge does not include one and two family housing or any construction projects under $50,000. It under-reports farm and rural construction, as well as construction performed by in-house employees in large general industry enterprises. It is estimated that this leaves out 18% of construction from the universe of construction activity in the US However, for the purposes of the planned programmed inspections, these are not significant issues:
- Construction projects under $50,000 are so small that they are likely to be only one or two-man jobs, that may last only a couple of days. Therefore, they are impossible to schedule with any degree of reliability. Besides, much of this work is likely to done by employers with fewer than 11 employees, and they are exempted from planned programmed inspections.
- Most agricultural work is exempted from the OSHAct.
- In-house force construction is covered by OSHA in its general industry inspection program.
4.2 Views of the Field Managers
In our interviews with the field managers, they expressed general satisfaction with the Dodge data. They noted that there were problems with the start dates of projects at times, that it seemed that large private bid projects were left off the Dodge lists,13 and that public construction, such as schools seemed to be over-represented14. They also said that it is sometimes difficult to locate construction projects based on the addresses provided in the Dodge slips, since Dodge reports projects by county and does not include zip codes.13It is likely that the large projects are simply not picked because they are rare in the Dodge file. In 1991, projects worth more than $1 million represented only 16 percent of the Dodge universe, while projects between $50,000 and $199,000 represented half of the universe. That means that in a truly random system, the probability of a project over $1 million being selected is one third the probability of a project less than $200,000 being selected. It is likely that the kind of project a field Manager has in mind as a "big project" is represented14. They also said that it is sometimes difficult to locate construction projects based on the addresses provided in the Dodge slips, since Dodge reports projects by county and does not include zip codes.
14The impression that public projects such as schools are over-represented was not shared by all managers, and some refuted it. It is important to keep in mind that school construction is currently very active.
CRA has been awarded the contract to analyze the Dodge data for OSHA since 1988. During this period the contract has been competitively resolicited twice with the CRA as the only qualified bidder. The current contract is for three years and is half-way completed.
We assessed CRA for the following characteristics: the qualifications of the staff; the quality of the work performed; the adequacy of the facilities and equipment; the cost of services performed; and institutional support provided to CRA by the University setting. Based on our experience in evaluating numerous university research programs, it was clear that CRA has a very good team atmosphere and provides a good setting for this activity. The staff was very well prepared for the site visit.
We found the staff to be highly qualified, with a good mix of experience and disciplines, including economics, engineering and safety and health. The co-directors have a wealth of experience between them, but they are approaching retirement age. The other staff provide a very solid "second-tier" that assures continuity. There is very little turnover in the staff, and it is quite evident that each staff member is fully capable of performing his or her duties with a minimum of supervision.
5.2
Quality of the Work Performed and Validation of the Model
We reviewed current activities and also obtained reports prepared by CRA
in the past. The site visit demonstrated that the staff know the subject
matter thoroughly and were able to answer all questions promptly and accurately.
We are not qualified experts in econometrics, and therefore we cannot
assess the accuracy of the model used to estimate construction schedules,
but within our areas of competence we found the work performed to be of
high quality.
There is an a priori problem in the model which both CRA and OSHA acknowledge. This model cannot predict with accuracy construction schedules for projects below $200,000, and works best with larger projects. This leads to the exclusion from the inspection schedule the kind of projects that are likely to pose some of the highest safety and health risks.
Field managers who are critical of CRA generally focus on deficiencies in the construction schedules, and believe that the CRA lists include too many inactive sites. Validations of the Dodge data that have been performed by CRA at OSHA's request on two occasions in the past found that the planned start date corresponded to the actual start date for all construction except public non-building construction, which can have a significant lag time. These analyses also found that estimates of duration were valid provided that the start date was estimated correctly15.
The earlier studies did not involve on-site verification of the validity of the schedules projected by CRA based on the Dodge data. In response to our concerns about the rate of inactive sites, the CRA staff offered to design and conduct a field study of all construction sites that were randomly selected by their model in the Knoxville, TN, Metropolitan Statistical Area. The aim was to determine how well actual construction corresponded to their projected schedules. This survey was conducted during the first week in March, 1999, and found that of 36 sites on the list, 30 (91.7%) were active when they visited them, and the three inactive sites showed evidence of ongoing construction activity16. They also found that it took 16 hours of staff time to drive around the area to survey each of the sites on the list17.15Construction Resources Analysis. Estimating Construction Duration. OSHA, Office of Statistics, March, 1997.
16 According to the authors they "...precisely followed the standard operating procedure outlined in OSHA's contract with [CRA]...We selected for site visit all building or heavy projects (single family housing and highway-road-paving projects were excluded) with a contract value of $950,000 and higher which we estimated to be between 30 and 60 percent complete this month." See letter to J. Dubois and H.B. Zettler fromW.R. Schreiver dated March 15, 1999. We have not attempted to validate the selection procedure, the field study procedure, or the findings. We were sent a notarized affidavit affirming the design and results signed by T.E. Cressler II and W.R. Schreiver as well as photos of each site visited. It should be noted that the threshold of $950,000 while in accordance with policy, would tend to make scheduling more reliable than would be the case if smaller volume projects were included.
17W.R. Schreiver. Personal communication in telephone interview with K. Ringen dated 3/12/99.
5.3 Adequacy of Facilities
The CRA has adequate, although very spartan physical facilities, and state-of-the-art equipment. There is no wasted overhead.
OSHA's contract with CRA, including indirect costs, is about $170,000 per year, which is very reasonable in comparison to the amount of work done. In our cost effectiveness assessment (see section 6.3(c)), it seems clear that CRA is very good bargain for the Agency in terms of the work that it is assigned.
It is important for OSHA that CRA receives strong institutional support from the University. As near as we can tell, the University is committed to helping sustain CRA, as evidenced by:
- CRA staff works closely with a number of academic departments, including economics and engineering. It gets assistance on special issues from faculty members when necessary. It gets graduate students from these departments to work on studies that are important to OSHA. This provides OSHA with inexpensive research assistance, and also potential candidates to enter the field of construction safety and health, which is greatly needed.
- University overhead is very reasonable in comparison to most universities, and enables more of OSHA's contract dollars to be spent for program purposes.
- The University
helps fund a number of related activities at CRA, including the recently
performed field study of the inspection schedule in the Knoxville area.
6. Analysis of the Planned Programmed Inspection System
OSHA performs roughly 18,000 construction inspections per year18. Of these about 6,000-7,000 inspections per year (38% of total) are planned programmed inspections. OSHA estimates that it inspects 3-3.5 employers during each visit to a construction site, and each is recorded as an individual inspection19. Thus, OSHA performs planned programmed inspections on 2,000-2,300 construction sites each year.
Table 1 provides a more detailed breakdown of site assignments and number of sites visited for programmed inspections in a typical month in each region. The University of Tennessee's national probability sample calls for OSHA to inspect roughly 1,250 construction worksites each month. However, based on the IMIS data provided us, the Agency only conducts planned programmed inspections on a total of roughly 180 sites, or 14% of the assigned sites, and in Region III only 6% are inspected. Furthermore, included among these are a number of Special Emphasis inspections.18This inspection volume is for the most recent years. A decade ago, OSHA used to do over 30,000 construction inspections.
19Per John Franklin, OSHA's Directorate of Construction and Joseph DuBois, OSHA's Office of Statistics.
Table 1
Average Number of CRA Assignments
Average Number of Construction Site Visits for Planned Programmed Inspections
Average per Month for FY 1996-98 By Region
|
Region
|
Total
Regions I-VII
|
|||||||
|
I
|
II
|
III
|
IV
|
V
|
VI
|
VII
|
||
| CRA Assignments |
115
|
182
|
297
|
196
|
209
|
206
|
29
|
1234
|
| Planned Programmed Site Inspections |
12
|
23
|
19
|
18
|
59
|
37
|
7
|
175
|
| Site Inspections as % of Assignments |
10%
|
13%
|
6%
|
9%
|
28%
|
18%
|
24%
|
14%
|
Construction Resource
Analysis. CRA Work Plan for OSHA, 11/25/98. Inspection data supplied by
OSHA, which have not been validated. The number of site visits was calculated
by dividing the number of inspections by 3. Regions VIII, IX, X are omitted
because they consist primarily of state OSHA plans. FY 96 data adjusted
upwards by 25% to reflect inspections lost due to government shutdown.
What happens to the 86% of sites that are not reported on?20 Are they inspected, but reported as unprogrammed? Are the sites inactive at the time they are visited? Unfortunately, there are no ready answers to these questions, even though they are essential to evaluating the effectiveness of OSHA's implementation of the planned programmed inspection system. We don't know if the inspections are being done, but not recorded accurately, or if the assignments are simply ignored21. But based on what we have learned from our interviews, it would appear that the area offices often ignore the uninspected sites22.
Exceptions are granted to the list of assignments, but as much as that happens, area offices request temporary additions to their list of assignments. Some sites are missed because they are inactive at the time of inspection, but exactly how many of those that are scheduled are inactive is anyone's guess. Sometimes the area offices, for a number of reasons, are unable to complete their assignments23, but according to the interviews we have conducted, that happens rarely. Occasionally, the area offices send back the list with incomplete inspections to the CRA, so that the sites can be reentered into the universe from which random selections take place.20Even this is almost certainly an overestimate. For instance, Region V (Chicago) counts all its emphasis inspections as planned programmed inspections, and these account for an estimated 65 percent of all programmed inspections. If they were deducted from inspections in Table 1, Region V would only inspect 10% of the sites on its list.
21We have been unable to determine why CRA persists in producing or the area offices requesting lists that appear to exceed the inspection capacity to such an extent.
22This is not to say the area offices are not doing inspections. One reason for the small number of programmed inspections is that unprogrammed inspections take priority. In one area office, 92% of all inspections were unprogrammed.
23The average monthly supplemental requests in 1998 amounted to roughly 65 additional inspection sites. See CRA Work Plan for OSHA, 11/25/98.
6.2 Validity of Complaints By Field Managers
Almost all area offices expressed the view that the planned programmed inspections give the a presence at sites where the Agency would otherwise not go. However, a number of field managers expressed strong dislikes for the current system because it is too resource intensive and not sufficiently flexible. It produces "too little bang for the buck."24 To the extent we could with the available data, we conducted a validation of the major criticisms.
a. Too Many Inactive Sites
The most common complaint is that the system produces too many visits to inactive construction sites. Construction is a transient and temperamental industry, governed by short term contracts which can be terminated or modified at any time, and the vagaries imposed by all kinds of external forces from climate to local ordinance enforcement. As a result, it is bound to be more difficult to locate an active construction site than a general industry facility. The CRA model used in the current system was designed in response to this unique character. But, could it be done better?
 Area
offices estimate that anywhere from less than 20% to 80% of planned programmed
sites are inactive at the time of inspection. Unfortunately, because the
Agency does not keep management information on each visit, we cannot confirm
or deny this contention, except to say that while the charge is consistent,
the spread in the estimate is unusually large25. Even though
the planned programmed inspections pose such a great burden, many regions
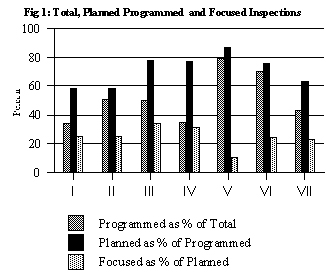
rely on them heavily. Fig. 1 shows the distribution of programmed inspection
activities in different regions. Region V relies on programmed inspections
for almost 80% of its inspections, and of these 9 in 10 are planned programmed
inspections26. Focused inspections are used in about 25% of
all planned programmed inspections, with Region III classifying 34% of
its inspections as focused, and Region V only 11%.
Area
offices estimate that anywhere from less than 20% to 80% of planned programmed
sites are inactive at the time of inspection. Unfortunately, because the
Agency does not keep management information on each visit, we cannot confirm
or deny this contention, except to say that while the charge is consistent,
the spread in the estimate is unusually large25. Even though
the planned programmed inspections pose such a great burden, many regions
rely on them heavily. Fig. 1 shows the distribution of programmed inspection
activities in different regions. Region V relies on programmed inspections
for almost 80% of its inspections, and of these 9 in 10 are planned programmed
inspections26. Focused inspections are used in about 25% of
all planned programmed inspections, with Region III classifying 34% of
its inspections as focused, and Region V only 11%.
24At the same time, a number of field managers who had experience with the system used before 1988 said they did no better working directly from the Dodge reports, without CRA's involvement. Several commented vehemently that they would never go back to the old system.
25We also cannot say whether or not the rate of sites being inactive at the time of inspection is higher for planned programmed inspections than for other types of inspections. According to our interviews, it is not even unusual to have inactive sites in complaint driven inspections.
26The source of data for Fig 1 is in Appendix 2, Table 1. However, the data are misleading as measures of the use of CRA assignments. According to the Regional Office, in Region V "planned programmed inspections" include CSHO referrals pertaining to the regional emphasis program on fall protection, that accounts for 65% of what is classified as planned programmed inspections. Other regions classify such referrals differently.
b. The Lists are Incomplete
We heard many field managers raise doubts about the extent to which the lists reflect current industry activities. They noted that the lists lack residential and small commercial construction, very large and privately bid projects, and include too many public projects such as schools. We have no way of verifying whether the mix of projects in terms of type of construction is representative, but we did look at how well the planned programmed inspections compared to other programmed inspections and to unprogrammed inspections based on the distribution of inspections by employer size (i.e., by number of employees.)
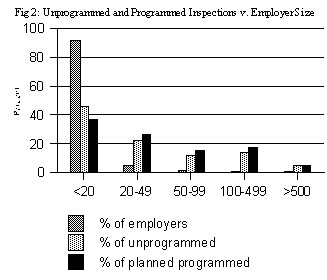 Fig.
2 shows the result of this analysis for Regions I-VII combined. It found
that while over 90% of construction employers have fewer than 20 employees,
only 40% of inspections covered this group, while employers in the larger
employer categories were much more likely to be selected. Planned programmed
inspections tend to miss the smaller employers and favor the larger employers
more than the other types of inspections, regardless of employer size27.
That's to be expected, because CRA's system excludes construction projects
below $200,000 and many of the area offices have much higher selection
thresholds--as high as $5 million for the West Atlanta Area Office. The
real problem is that too few of both unprogrammed and programmed
inspections are devoted to small employers.
Fig.
2 shows the result of this analysis for Regions I-VII combined. It found
that while over 90% of construction employers have fewer than 20 employees,
only 40% of inspections covered this group, while employers in the larger
employer categories were much more likely to be selected. Planned programmed
inspections tend to miss the smaller employers and favor the larger employers
more than the other types of inspections, regardless of employer size27.
That's to be expected, because CRA's system excludes construction projects
below $200,000 and many of the area offices have much higher selection
thresholds--as high as $5 million for the West Atlanta Area Office. The
real problem is that too few of both unprogrammed and programmed
inspections are devoted to small employers.
27Depending on type of inspection, an employer with more than 500 employees has a probability of being inspected by OSHA that is roughly 20,000-40,000 times greater than an employer with less than 20 employees. One reason for this is that a very large employer works on many more construction sites at any given time than a small employer. If we look at inspections by number of employees in each of the categories, however, there is a closer match between inspection probability and employment. See Appendix 1, Table 9.
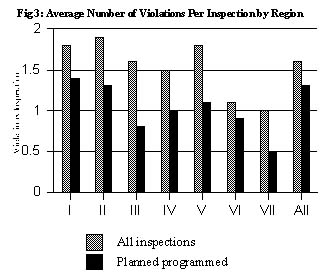
c. They Produce Too Few Results
The final major argument against the national planned programmed inspection system is that it produces less bang for the buck than the unprogrammed inspections because it produces fewer violations and lower penalty amounts. It is argued that Dodge/CRA is biased towards established construction projects with responsible owners and experienced construction contractors who have better safety records.
 We
know that OSHA's inspections as a whole do not accord each employer an
equal probability of inspection. That's obvious from Fig. 2.28
We also know that the area offices contribute to the distortion by setting
selection criteria that include high dollar projects only. Finally, the
CRA model predicts construction schedules for larger projects better than
smaller ones. But on average, do planned programmed inspections produce
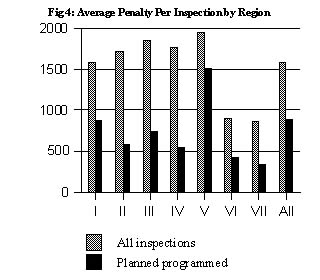
fewer violations and less penalties than other types of inspections? Fig.
3 shows the average number of violations and Fig. 4 the average penalties
per inspection for planned programmed inspections compared to total inspections
in construction inspections by region for FY 96-98.
We
know that OSHA's inspections as a whole do not accord each employer an
equal probability of inspection. That's obvious from Fig. 2.28
We also know that the area offices contribute to the distortion by setting
selection criteria that include high dollar projects only. Finally, the
CRA model predicts construction schedules for larger projects better than
smaller ones. But on average, do planned programmed inspections produce
fewer violations and less penalties than other types of inspections? Fig.
3 shows the average number of violations and Fig. 4 the average penalties
per inspection for planned programmed inspections compared to total inspections
in construction inspections by region for FY 96-98.
Programmed
inspections produce 20% fewer inspections with violations and 44% less
in penalty dollars than the average for all types of OSHA construction
inspections. This pattern is true across all regions, but the size of
the variation between regions is so striking that it raises questions
about whether the pattern is imposed by Dodge/CRA29.
28Dr. David Weil of Boston University is conducting an in-depth analysis of this issue which confirms in greater detail what is shown in Fig. 2. Heather Grob's doctoral dissertation, Self-Regulation and Safety Programs in Construction (Notre Dame, 1998) is perhaps the most detailed analysis to confirm this discrepancy.
29Except in one instance (see section 7.2) we did not look at severity of violations, but we suspect that not only do planned programmed inspections produce fewer violations, but also a lower percentage of willful and repeat violations, and that this is one reason the average penalties are so much lower.
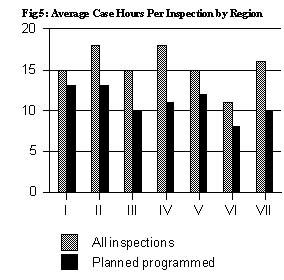
6.3 Cost Effectiveness
Does the planned programmed inspection system represent a good investment for the Agency given the small number of inspections that are actually carried out and the comparatively poor results in terms of violations and penalties obtained? The answer to this question has three parts: are planned programmed inspections as currently practiced cost effective; do they have an impact on safety patterns in the industry that justify the Agency's investment in them; and is the Dodge/CRA methodology the most effective approach?
a. Cost-Effectiveness
of the Planned Programmed Inspections
 Assessing the value
of the Agency's investment in planned programmed inspections compared
to other types of inspections the Agency carries out is beyond the scope
of this contract. However, as noted in section 6.2(c), the IMIS data suggest
that the planned programmed inspections as a whole produce fewer violations
and lower penalties on average per inspection. The only data we have to
compare the level of effort it takes the Agency to carry out different
types of inspections are average case hours per inspection.
Assessing the value
of the Agency's investment in planned programmed inspections compared
to other types of inspections the Agency carries out is beyond the scope
of this contract. However, as noted in section 6.2(c), the IMIS data suggest
that the planned programmed inspections as a whole produce fewer violations
and lower penalties on average per inspection. The only data we have to
compare the level of effort it takes the Agency to carry out different
types of inspections are average case hours per inspection.
Fig.5 shows a comparison of case hours per programmed inspection in construction compared to all construction inspections. On average for all construction inspections, the Agency spends 25% more time conducting an average inspection than it does a planned programmed inspection, and in Region IV it takes 63% more time to perform an average inspection. In other words, a planned programmed inspection takes 3-4 hours less than the average inspection.
 That
"saving" by itself would not be sufficient to justify conducting
planned programmed inspections alone. Table 2 shows "lost" penalty
revenues compared to the wages, expenses and overhead "saved"
between programmed inspections and the average inspection for each Region.
This means that for each planned programmed inspection performed, the
Agency "loses" a net of $464 in penalties compared to if it
had engaged in other types of inspections.30 Is that a reasonable
price for achieving a neutral system?
That
"saving" by itself would not be sufficient to justify conducting
planned programmed inspections alone. Table 2 shows "lost" penalty
revenues compared to the wages, expenses and overhead "saved"
between programmed inspections and the average inspection for each Region.
This means that for each planned programmed inspection performed, the
Agency "loses" a net of $464 in penalties compared to if it
had engaged in other types of inspections.30 Is that a reasonable
price for achieving a neutral system?
30Of course, the Agency does not lose the penalties since penalties go to the US General Treasury. If one assumes that penalties are the most important deterrent available to the agency, this implies a loss of safety and health protection of roughly 25% for each planned programmed inspection performed. There has been a long dispute among economists about the extent to which penalties act to deter unsafe practices, but I don't think any employers in the industry doubt this.
Table 2
Penalties Lost and Hours Gained per Inspection Planned Programmed vs. All Inspections in Construction
By Region, FY 96-98
|
Region
|
Total
Regions I-VII
|
|||||||
|
I
|
II
|
III
|
IV
|
V
|
VI
|
VII
|
||
|
Penalties
"Lost" Per Inspection ($)
|
-706
|
-1038
|
-1117
|
-1219
|
-400
|
-467
|
-424
|
-694
|
| Wages etc. "Saved" Per Inspection ($)* |
120
|
300
|
300
|
420
|
180
|
180
|
420
|
230
|
|
Net "Loss" Per Inspection ($) |
-586
|
-738
|
-817
|
-799
|
-220
|
-267
|
-4
|
-464
|
b. Impact on
Safety and Health
Ultimately we would like to measure the value of planned programmed
inspections compared to other types of inspections based on the extent
to which they reduce injury and illness rates among workers in construction.
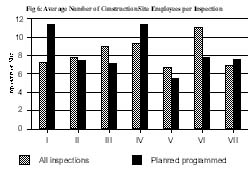 Frequently the
field managers state that the planned programmed inspections fail to
reach the smaller employers, who are usually the most hazardous employers31,
and we looked at this issue. Fig. 6, which is based on FY 1998 data,
shows that as often as not, the planned programmed inspections reach
sites with fewer employees than all OSHA inspections for construction
combined. So, at least in this limited sense there is no evidence that
the planned programmed inspections are a unique problem for the Agency.
Frequently the
field managers state that the planned programmed inspections fail to
reach the smaller employers, who are usually the most hazardous employers31,
and we looked at this issue. Fig. 6, which is based on FY 1998 data,
shows that as often as not, the planned programmed inspections reach
sites with fewer employees than all OSHA inspections for construction
combined. So, at least in this limited sense there is no evidence that
the planned programmed inspections are a unique problem for the Agency.
31Bureau of Labor Statistics. Occupational Injuries and Illnesses. Bulletin 2485, April 1997.
A central issue to this assessment can therefore not be answered. Do the planned programmed inspections, because they cause the Agency to go for inspections where it otherwise would not go, produce sufficient deterrence to justify the lower return? There is no doubt among OSHA's field managers that the random inspections serve this purpose, and therefore some type of system to accomplish this is needed.
c. The Dodge/CRA System
OSHA spends roughly $240,000 per year on its contract to purchase the F.W. Dodge reports, and another $170,000 on the CRA contract to model the Dodge reports and produce the inspection schedules.32 In other words, OSHA spends roughly $400,000 to identify what turns out to be 2,000 sites actually inspected. If we take into account the visits to sites that are inactive and not reported on, then it is likely that OSHA actually visits at least 2,500 sites per year. The cost of the CRA contract spread across these sites comes to $160-200 per site that OSHA visits. On the surface, this does not appear to be cost-effective.33
However, this is not a truly valid assessment. Even if CRA did not issue the schedules of inspections, OSHA would need to send each area office the Dodge reports for its catchment area. So OSHA could possibly save the CRA contract amount of $170,000. But in return for this saving, the area offices would then have to sift through the reports and identify sites, and make a random selection among them. Of course, the Agency would have to pay for this added staff time. We have estimated this added cost in Table 3, based on the interviews with area office staff who had experience with the system used before 1988, and compared it to CRA's current budget. In other words, the Agency would not save any monies by eliminating the CRA contract, and would almost certainly end up paying more.34
32DuBois, J., OSHA's Office of Statistics, Personal Communication Feb. 22, 1999.
33Assuming an average cost to the Agency of $60 per hour for CSHO wages, expenses and and overhead, this equals 2.5-3.5 hours of CSHO time per site visited.
34This does not even take into account the services that CRA delivers to a number of State Plans under the OSHA contract, or the additional services it provides the Agency in the form of technical assistance, data analysis and periodic reports.
Table 3
Estimated Added Area Office Costs Without CRA Procedure
| Per Area Office | All OSHA* | ||||
|
Hours/yr |
Wage & overhead | Annual cost | Hours/yr | Costs ($) | |
| Low Estimate (4.5 hours/month) |
54
|
$35/hr
|
$1,890
|
4,536
|
$157,760
|
| High Estimate (8 hours/week) |
416
|
$35/hr
|
$14,560
|
34,944
|
$1.2
million
|
| Best Estimate (16 hours/month) |
192
|
$35/hr
|
$6,720
|
16,128
|
$564,480
|
| CRA's annual budget |
$170,000
|
||||
But, would a return to having the area offices create their own sample be better? The answer to this question must consider four criteria:
-
Would the Area Offices Produce a More Complete Universe? It is possible that the area offices could use local knowledge to augment the Dodge reports. This would almost certainly be the main advantage, but it could also lead to the kinds of abuses that the Inspector General uncovered in 1987.
-
Would the Area Offices Produce a More Neutral Sample? The area offices would need to apply some type of random selection procedure, such as applying a random table. It is hard to see how this would produce a more neutral sample, and it is highly unlikely that the area offices could come up with a better model to estimate the time when expected projects would be active without interjecting local knowledge bias into the system.
-
Would the Area Offices Produce a Sample that Results in Fewer Inactive Sites? Verification of construction activity before projects are placed in the universe from which targets are to be selected should produce fewer visits to inactive sites. But such a process might be very time consuming, and would still not assure that a site is active at the time of the visit.
-
Would the Area Offices Produce a Sample that Yields a Higher Rate of Return? It would seem from Fig. 3 and Fig. 4 that regions that focus on SEP inspections (e.g., Region V) have a higher return in terms of violations and penalties. However, it seems that these regions rely more on CSHO referrals than on random selection from construction schedules to target employers.
We do not have any way of determining whether local "take over" of the sample selection process will improve inspection effectiveness or produce a higher rate of return. A number of area offices and State Plans have expressed a desire to maintain the Dodge/CRA system, while others have said they prefer to manage the whole process themselves. Several of the field managers we talked to helped manage the system before 1988, and tended to state that they did not think it was advantageous over the current system. Local takeover might lead to greater employer resistance and the chances of a Barlow's type challenge in the process, and it would be harder for the Agency to defend the neutrality of the system without the CRA acting as a "blinded" scheduler.
Most of the area office managers we talked to said that they expect planned programmed inspections in construction to produce visits to inactive sites, and they take actions accordingly to make the system more efficient. They are using many different and creative ways to make the existing system function more effectively, and in some cases CRA has been assisting them in accomplishing this.
-
Most area offices are increasingly using focused inspections, which now account for 25% of all planned programmed inspections. This may be one explanation for the lower time required to conduct an average planned programmed inspection35.
-
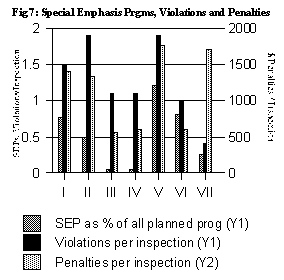
A number of regions and area offices rely on SEP inspections to perform what they claim are planned programmed inspections, even though they mostly use CSHO referrals to identify sites. Although it happens rarely, they can request lists from CRA that focus on certain types or size categories of construction, in which they expect to produce a high rate of return. Fig. 7 shows that the more SEPs that are used, the higher the rate of violations and average penalty per inspection36.
-
They ask that the universe from which the samples are made to be limited to certain, sub-area office geographic areas where they want to focus their attention at certain points in time. For instance, in one month they conduct inspections in the eastern part of their jurisdiction, the next month in the western part. The greater the distances in an area office's jurisdiction, the more important this approach becomes.
-
They always arm inspectors with a number of different targets when they go out, so that if a project is inactive they can go on to another.
- They also discourage
inspectors from being specialists in construction and assign the inspectors
a mix of construction projects and general industry establishments when
they go out, so that if there are no active construction projects the
inspector can focus on general industry targets.
- Finally, they urge inspectors to look for "CSHO referrals" while en route to a planned programmed inspection site. If the inspector has observed a probable violation, this procedure can save the Agency from having to seek a court ordered warrant. Many noted that the planned programmed inspections afford them the only opportunity to establish presence in remote areas, and when traveling distances are long it is especially important to plan for the event of an inactive construction site target, and also not to have to rely on the time consuming task of traveling to obtain warrants.
36The exception to this finding is the number of penalties in Region VII. Other factors play a role in penalty levels but as a whole SEPs have a major impact on inspection results.
7.1
Columbus Area Office Experiment
In 1997, the Columbus Area Office established the Construction Enforcement
Concept (CEC). This is perhaps the most interesting current local experiment
to improve the planned programmed inspections. The aim of CEC is to
place employers who have been found to have had fatality, willful, repeat
or failure-to-abate violations in the past three years on a special
list for targeting by programmed inspections. A list of these "priority
employers"(currently there are about 75 such employers) is sent
to CRA. Each month CRA selects inspection targets randomly from a universe
of projects where these employers are working to produce the schedule.
Apparently, OSHA has found this selection process to be in compliance
with Barlow's.
Table 4 shows
the results of CEC to date compared to the "normal" CRA schedule
that was used before. This analysis was conducted by the Columbus Area
Office and includes the 40 most recent inspections before CEC was instituted
using the established Dodge/CRA protocol for their selection, compared
to the first 35 inspections performed after CEC was instituted. Before
CEC, only 22.5 percent of inspections resulted in a violation, while
under CEC almost all inspections have resulted in violations (including
30 citations for serious violations and 3 repeat violations in a sample
that totaled 35 inspections.) After CEC, the use of focused inspections
fell from 80% to 55%. Importantly, the number of projects which were
inactive when the CSHO arrived on site declined from 40% to less than
25%.37
Table 4
Results of the Columbus AO CEC Program
| % w/violations | % w/focused inspections | % inactive sites | |
| Before CEC |
22.5
% (9/40)
|
80
%
|
40
%
|
| After CEC |
94.3 % (33/35)
|
55.3
%
|
<25
%
|
37It is not clear why the rate of inactive sites dropped so markedly, since the source of the projects selected is the Dodge reports in either case. This may illustrate the importance of leadership and motivation. An experiment frequently produces "Hawthorne" effects, and that's why controls are important in experimental designs.
8. Conclusions and Recommendations
8.1 The Agency Needs to Redefine the Role of the Planned Programmed Inspections
a. Conclusions
Ambivalence about the planned programmed inspections permeates the Agency. As a result, OSHA field managers do not have a clear and consistent understanding of the purpose of the planned programmed inspections, which leads to considerable frustration.
The role of the planned programmed inspections has evolved in response to external circumstances more than from leadership direction. The small number of planned programmed inspections conducted is a reflection of OSHA's limited resources and the fact that there is no legal requirement for these inspections. Unprogrammed inspections take precedence over programmed inspections, and among programmed inspections, special emphasis inspections are increasingly taking precedence over planned programmed inspections. In this situation the planned programmed inspections tend to become the last priority.
Nevertheless, there is universal agreement within the Agency about the importance of establishing a presence throughout the industry based on the random selection of inspection targets. The issue is to define how this should be accomplished, what level of expectations should be placed on the random inspections, and what proportion of the Agency's resources should be devoted to them.
Currently there is confusion about even what to call this system. It is variously referred to as the "Scheduled," "Planned Program," or "Targeted" inspection system. There is also considerable confusion, or perhaps opportunism, about what types of inspections that can be classified as planned programmed inspections. In particular, program-"related" and SEP inspections, which often are based on CSHO referrals rather than any kind of neutral selection system, seem to be frequently mis-classified as planned programmed inspections.
b. Recommendation
The Agency should establish a mission statement, and restate and simplify (if possible) policies and procedures for the planned programmed inspections. This statement should focus on the importance of having a presence throughout the industry that cannot be predicted or avoided by employers. The mission statement could focus on the view that planned programmed inspections are an important component of enforcement and serve to instill a safety culture and reinforce the value of self-regulation.
It should give
the system a specific name, and stick with it.
It seems reasonable that the Agency should devote 40 percent of inspection
resources to the programmed inspections. At the same time, there is
room for area offices to seek different ways of making these inspections
more effective.
The Agency should make clear its expectations that area offices should
be able to reduce the number of inspection visits to inactive sites
to less than 15 percent, and should monitor the area office's performance
in this regard.
8.2 The Area Offices Should Be Allowed Structured Leeway in Designing Planned Programmed Inspection Systems that Meet Their Needs
a. Conclusion
Overall, the planned programmed inspections are not being performed as intended by OSHA in response to Barlow's. The integrity of the system is threatened by a growing trend towards ignoring or circumventing it by the Area Offices. While the CRA lists provide a neutral sample, the randomness or neutrality is opened to suspicion when the area offices select only 14% of projects listed for inspection.
At the same time, the innovations that are being made in the planned programmed inspections come from the area offices. A number of area offices use their own systems, or rely on special emphasis inspections as their planned programmed inspections. However, the special emphasis programs are often conducted based on probable cause and not pursuant to the random process involving CRA.
It does not appear that the regional offices or the national office are using consistent or adequate procedures in terms of reviewing and approving alternatives or amendments to the existing systems being developed by the area offices.
b. Recommendation
The Agency should allow area offices to opt out of the current scheduling system if they can design a protocol that meets the requirements of Barlow's. To assure that this does not lead to abuses, the Agency needs establish a protocol in accordance with the recommendations of the Inspector General's 1987 report. It should conduct a thorough review before it approves any opt-outs, and should have in place a procedure to monitor how the area offices that opt out implement their programs.
To the extent possible, area offices that focus on special emphasis program inspections also should use a neutral process to select targets, either CRA or one developed locally and approved by the regional or national offices.
8.3 The Agency Needs to Improve Data Collection in the IMIS System
a. Conclusions
The data presented
in section 6 show huge and inconsistent variations between regions.
We think that some of the variations, and perhaps a very significant
part, result from different uses of terms and different coding of information
for data entered into IMIS, and the omission of essential data about
construction site characteristics. It is hard to see how the Agency
can make decisions, monitor performance, and evaluate problems with
any degree of certainty given the glaring deficiencies found in IMIS,
at least for construction.
b . Recommendation
The Agency needs to review the quality assurance procedures for IMIS. It needs to instill standardized classifications. It needs to develop various edit checks on data entry. It needs to conduct field audits of the area offices to verify classification, coding and data entry practices.
The Agency should implement a number of immediate improvements:
-
Data entry procedures should be reviewed and clear definitions of classification terms should be developed immediately.
-
Wherever a Dodge inspection takes place, the Dodge number should be entered in a specified field.
-
More information is needed on the type of construction project that is inspected. CRA has developed a good classification system that could form the basis for IMIS.
-
IMIS should include a data field for reports from visits to construction sites that are inactive (see 8.4).
In addition, an electronic link between the IMIS data and the Dodge data base should be designed for purposes of evaluating which sites have been visited. CRA could assist in the development of this analysis capability. (See also 8.9)
Finally, the Directorate of Construction needs to improve its capability for analysis and reporting of data from IMIS.
8.4 A Report Should be Filed for All Construction Inspections, Even if the Site is Inactive
a. Conclusion
The most common complaint about the planned programmed inspection system expressed by field managers is that the sites are too often inactive. However, since inspectors do not report on visits to inactive sites, there is no way to assess the magnitude of this problem, or to determine if it is unique to planned programmed inspections.
b. Recommendation
Whenever an inspector visits a construction site, a report should be filed. This should also be the case even if the site is inactive at the time of the visit, and a short form should be developed to simplify such reporting. The report should include characteristics of the construction project, and an assessment of why the site is inactive if that information is available.
8.5 The Dodge Contract Should Continue
a. Conclusion
F.W. Dodge remains the only viable national data base, and OSHA should continue its subscription to it. The Dodge data base contains between 150,000 and 200,000 construction projects at any given time, and adds about 22,000 new projects each month. CRA selects 1,200-1,400 projects from this data base each month, and this provides an ample universe from which to select in such a manner that no employer that is subject to enforcement under the OSHAct will feel to be exempt from the possibility of being subjected to a planned programmed inspection.
By making the Dodge data available to the State Plans, OSHA provides these plans with a great services on which they have come to depend, but would be unable to sustain on their own.
b. Recommendation
The F.W. Dodge contract should continue, and in addition:
-
The Agency should request that Dodge reports include zip code in the addresses for all construction projects, except possibly road, rail and pipeline construction, when it may not make sense to do so. For the vast majority of construction projects, zip codes would be an excellent aid to locating construction projects for inspection38.
-
Either on its own or through CRA, the Agency should review the Construction Market Data (CMD) to determine whether this data base would provide a valuable addition to the Dodge data for those area offices where CMD provides coverage.
38This is especially true if the Agency adopts Geographic Information System methods to present its performance data.
8.6 The CRA Contracts Should Continue
a. Conclusions
CRA is well qualified to perform the work needed by OSHA for the planned programmed inspection system, and is a very cost effective resource for OSHA. Any alternative would in all likelihood add significant cost to area office budgets. The Dodge data would still need to be purchased and sent to each area office. Most of the field managers who remember the system in place before 1988 favor the CRA scheduling system. It is very uncertain whether alternatives would produce a higher rate of return in terms of an increased number of inspections performed, or average number of violations and increased penalties per inspection performed.By making CRA available to the State Plans, OSHA provides these plans with a great services on which they have come to depend, but would be unable to sustain on their own.
b. Recommendation
The CRA contract should be continued at the current level of effort. CRA is clearly capable of providing OSHA with more research support that could help evaluate the effectiveness of the construction inspection program. It should be possible to reprogram funding from CRA's current activities to more research support activities for the Agency, particularly if a number of area offices are given the opportunity to opt out from using the CRA schedules and decide to take advantage of that opportunity. (See 8.9)
CRA should develop a selection procedure that yields a list of assignments more compatible with the actual inspection capacity for each area office.CRA should perform more field validation studies of its scheduling model, particularly to determine the extent to which it can reliably predict construction schedules for projects below $950,000 in value, and it should propose ways to schedule projects of less than $200,000 in value.
CRA would benefit from increasing its capabilities in biostatistics and epidemiology.
8.7 There is Room for Immediate Improvement in Terms of Area Office Implementation of the Planned Programmed Inspections
a. Conclusion
No matter how planned inspections are carried out, construction sites that are targeted will be inactive in some cases. Because of the vagaries of construction, sites become inactive for unpredictable reasons: weather, contracting problems, supply problems, labor disputes, permit refusals, etc. If the system were to target sites known to be active, it would no longer be random. So the real issue that field managers must address, is how to minimize resources lost due to inactive sites.
b. Recommendation
Significant improvements in the implementation of the program can be made in the short term. The Agency should require the area offices to make the most of their inspection resources by adopting the kind of efficiencies that are described in section 7 of this report.
The Agency should make clear to the field managers that planned programmed inspections that results in a visit to an inactive site is expected and accepted given the transient nature of construction work. A fifteen percent (15%) rate might be a reasonable target.
8.8 The Directorate Needs to Improve Communications with the Area Offices
a. Conclusions
The Directorate of Construction, in cooperation with the regional offices, needs to improve communications to and between area offices. A number of area offices do not understand or use the capabilities and flexibility allowed under the CRA planned programmed inspection system, and are not aware of the many creative experiments that are being conducted in various area offices in order to make the planned programmed inspections more valuable.
b. Recommendation
A self-learning course with a simple manual and video should be prepared and sent to each area office. A Web-site where area offices can report their experiments and where the Directorate provides data on performance should be created. There should be an update on the planned programmed inspections program at each regional area office manager's meeting.
8.9 The Agency Needs to Develop an Industry Denominator for Evaluation of Its Inspection Practices and Linkage to Injury and Illness Data
a. Conclusion
Current IMIS data permit only a very limited descriptive evaluation of the inspection system. They provide no real information on the characteristics of the construction industry against which to measure inspection activity and results. They provide no way to evaluate the extent to which inspection patterns by industry characteristics relate to injury and illness patterns for those industry characteristics.
b. Recommendation
CRA should be able to use the Dodge data to provide a model of construction activity to estimate labor hours by type of construction for each area office.
CRA could provide OSHA with assistance in estimating the Agency's impact on injury and illness rates in construction by linking together Dodge data on the industry with BLS injury and illness data and IMIS inspection data.39
39 This would provide a research resource with great potential value to the National Institute for Occupational Safety and Health, and OSHA should seek assistance from NIOSH in the form of joint funding of these activities.
8.10 The Use of Planned Programmed Inspections Needs to Be Tested
a. Conclusion
Based on this analysis,
it is not possible to recommend whether OSHA should expand, maintain
or discontinue the planned programmed inspection system. It is hard
to see any patterns in the data which justify the specifics of the very
strong views that are expressed by a minority of field managers against
the current system. At the same time, it is hard to justify the programmed
inspections given their diminished results compared to other types of
inspections.
Most of the field managers recognize the need for some type of programmed inspections, but many challenge the effectiveness of the current system of scheduling those inspections. It is hard to find any resounding evidence that these inspections produce as good or better results than other types of inspections. There are no major differences between programmed and unprogrammed inspections in terms of employer size. While planned programmed inspections may result in more inactive sites visited, and in less violations and penalties, they also take 25% less inspection resources.
It is not surprising that planned programmed inspections result in fewer violations or penalties. This is to be expected given that they are performed on a random sample of sites, while unprogrammed inspections are based on cause. Unfortunately, data systems are not in place to determine whether the lower rate of inspection return is justified based on the impact the random inspections have on safety and health practices.
There is a fundamental unfairness about comparing programmed inspections to unprogrammed inspections, and it is not necessarily valid to rely on violations and penalties as the ultimate outcome of OSHA's activities. Preventive programs are hard to justify, because if they work well there will be few adverse outcomes to measure. The fact that programmed inspections find more employers "in compliance" than unprogrammed inspections could signify that the employers favored by programmed inspections have "gotten the message" as a result of being favored. But we don't know whether that's the case.
b. Recommendation
To better evaluate its construction inspection activities OSHA should design a demonstration program better determine the optimal mix of inspection resources by comparing inspection activities to industry risk characteristics.
Such
an experiment could place a sample of area offices which volunteer to
participate in three groups (with perhaps 6-10 offices in each group)
according to their current inspection preferences: 1) those which prefer
to use the current Dodge/CRA system; 2) those which prefer to focus
on SEP inspections, and 3) those which prefer to focus on unprogrammed
inspections. Over a three year period, they should be evaluated in terms
of their resource use and inspection impact. An outline of the design
and approach is in the attached addendum.
Demonstration to Test Planned Programmed Inspection Effectiveness
Outline
Objective:
To evaluate the effectiveness of planned programmed inspections to determine
their impact on industry risk characteristics.
Design: A sample of area offices would be placed in three groups
(with perhaps 6-10 offices in each group) according to their current
inspection preferences: 1) those which prefer to use the current Dodge/CRA
system; 2) those which prefer to focus on SEP inspections, and 3) those
which prefer to focus on unprogrammed inspections. Each of experimental
area office jurisdictions would be carefully characterized for construction
activity to define labor hours by craft and by type of construction
using a classification system based on the one already developed by
CRA. The construction would then be compared to the BLS injury and illness
data to establish their expected risk rates by size of employer.
Evaluation: The evaluation would make comparisons between the three experimental groups, and also make comparisons to between the experimental groups and the remaining OSHA offices which do not chose to participate. The outcome would be measures of inspection activities, where the number and type of inspection, violations and penalties issued would be compared to type of construction, size of construction project, and type and size of employer.
Review: To assure independence and quality, OSHA could ask ACCSH to establish an expert working group with added expertise in quasi-experimental evaluation. The working group would review the experimental design and make recommendations for improvements, and periodically monitor progress.
Implementation: OSHA could seek the assistance of NIOSH in conducting this experiment particularly to help design the experiment and its evaluation plan. A contract with an experienced evaluation organization would be needed to conduct an independent evaluation of the project.
Duration: Three years.
Summary of Key IMIS Data
Table 1. Construction Inspectionsby Region, FY 96-98
| Type
of Inspection |
Region
|
I-VII
Combined |
||||||
|
I
|
II
|
III
|
IV
|
V
|
VI
|
VII
|
||
| Total Construction |
5,819
|
7,827
|
4,676
|
6,435
|
8,581
|
6774
|
2,670
|
42,782
|
| All Programmed |
1,991
|
3,961
|
2,344
|
2,249
|
6,745
|
4,760
|
1,143
|
23,193
|
| Planned Programmed |
1,158
|
2,281
|
1,832
|
1733
|
5,765
|
3,628
|
717
|
17,114
|
| Planned Programmed as % of all Construction Inspections |
34%
|
51%
|
50%
|
35%
|
79%
|
70%
|
43%
|
52%
|
| Planned Programmed as % of all Construction Inspections |
20%
|
29%
|
39%
|
27%
|
67%
|
54%
|
27%
|
38%
|
|
Planned Programmed as % of all Programmed Inspections |
58%
|
58%
|
78%
|
77%
|
87%
|
76%
|
63%
|
71%
|
Note: Based on
data supplied by OSHA, which have not been verified. The numbers here
are for federal OSHA inspections only. Regions VIII, IX, X are omitted
because they consist primarily of state plan states.
Table 2. Special Emphasis Program Inspections
By Region, FY 98
|
Region
|
I-VII
Combined |
|||||||
|
I
|
II
|
III
|
IV
|
V
|
VI
|
VII
|
||
| Seps Per Planned Programmed Inspection |
0.8
|
0.5
|
0.05
|
0.05
|
1.2
|
0.08
|
0.25
|
0.63
|
Table 3. Construction
Inspection, Violations and Penalties
By Region, FY 96-98
|
Region
|
Total
Regions I-VII |
|||||||
|
I
|
II
|
III
|
IV
|
V
|
VI
|
VII
|
||
| All Construction Inspections |
5,819
|
7,827
|
4,666
|
6,435
|
8,581
|
6,774
|
2,665
|
42,767
|
| All Violations |
10,768
|
15,195
|
7,531
|
9,817
|
15,414
|
7,560
|
2,630
|
68,915
|
| All Penalties (in $1,000) |
9,231
|
13,402
|
8,700
|
11,335
|
16,770
|
6,065
|
2,301
|
67,804
|
By Region, FY 96-98
Table 4. Violations
and Penalties Per Construction Inspection By Region, FY 96-98
|
Region
|
Total
Regions
I-VII |
|||||||
|
I
|
II
|
III
|
IV
|
V
|
VI
|
VII
|
||
| Violations Per Inspection |
1.8
|
1.9
|
1.6
|
1.5
|
1.8
|
1.1
|
1.0
|
1.6
|
| All Penalties ($) |
1,586
|
1,712
|
1,860
|
1,761
|
1,950
|
895
|
861
|
1,585
|
Table 5. Rate
of Noncompliance Per Inspection By Region, FY 96-98
|
Region
|
Total
Regions
I-VII |
|||||||
|
I
|
II
|
III
|
IV
|
V
|
VI
|
VII
|
||
| Unprogrammed Inspections |
78%
|
74%
|
68%
|
68%
|
66%
|
54%
|
60%
|
67%
|
| Programmed Inspections |
61%
|
57%
|
62%
|
52%
|
75%
|
44%
|
35%
|
55%
|
| Planned Programmed Inspections |
49%
|
47%
|
58%
|
48%
|
74%
|
42%
|
29%
|
50%
|
| Programmed Inspections--Not Planned |
78%
|
72%
|
77%
|
63%
|
85%
|
49%
|
44%
|
67%
|
Table 6. Employees
on Site Per Inspection By Region, FY 98
|
Region
|
|||||||
|
I
|
II
|
III
|
IV
|
V
|
VI
|
VII
|
|
| All Construction Inspections |
7.3
|
7.8
|
9.0
|
9.4
|
6.7
|
11.1
|
7.0
|
| Planned Programmed Inspections |
11.4
|
7.5
|
7.15
|
11.4
|
5.5
|
7.8
|
7.6
|
Table 7. CSHO Case Hours Per Inspection By Region, FY 96-98
|
Region
|
|||||||
|
I
|
II
|
III
|
IV
|
V
|
VI
|
VII
|
|
| All Construction Inspections |
15
|
18
|
15
|
18
|
15
|
11
|
16
|
| Planned Programmed Inspections |
13
|
13
|
10
|
11
|
12
|
8
|
10
|
Table 8. Inspections, Violations and Assessments Per Inspector
By Region, FY 96-98
|
Region
|
I-VII
Combined |
|||||||
|
I
|
II
|
III
|
IV
|
V
|
VI
|
VII
|
||
| Number of safety inspectors |
64
|
92
|
66
|
92
|
114
|
86
|
36
|
550
|
| Total Inspections/inspector |
91
|
85
|
71
|
70
|
75
|
79
|
74
|
78
|
| Programmed/Inspector |
31
|
43
|
36
|
25
|
59
|
55
|
32
|
40
|
| "Dodge/CRA"/Inspector |
18
|
25
|
28
|
51
|
42
|
20
|
29
|
|
| Violations/Inspector |
168
|
165
|
114
|
50
|
135
|
88
|
73
|
121
|
| Penalties/Inspector ($1000) |
144
|
146
|
132
|
948
|
147
|
71
|
64
|
118
|
| Penalties/Violation ($) |
857
|
882
|
1,155
|
1,154
|
1,087
|
802
|
874
|
973
|
Table 9. Inspections
by Employer Size
Regions I-VII Combined , FY 96-98
|
Employer
Size |
Proportion
of Industry
|
Proportion
of Inspections
|
||||
|
Employers
|
Employees
|
All
Inspections
|
Unpro-
grammed |
All
Programmed |
Planned
Programmed
|
|
|
1-19
|
82%
|
45%
|
42%
|
46%
|
43%
|
37%
|
|
20-49
|
4.9
|
14
|
25
|
23
|
28
|
27
|
|
50-99
|
2.1
|
19
|
13
|
12
|
14
|
15
|
|
100-499
|
1
|
16
|
15
|
14
|
13
|
17
|
|
>500
|
<½
of 1 %
|
6
|
5
|
5
|
3
|
5
|
|
Total
|
100
|
100
|
100
|
100
|
100
|
100
|