
Summary Statement
A broad collection of tables and charts covering health and safety in the U.S. construction industry, as well as considerable economic and training data.
2007
Section 26: Health Insurance Coverage in Construction and Other Industries
In 2005, about 74% of wage-and-salary employees in the United States were covered by health insurance obtained at the workplace from their employer or union.1 That compares with 84% of the population who had health insurance coverage from any source.2 The estimates are based on the 2006 Current Population Survey (CPS) Annual Social and Economic Supplement (March Supplement, formerly Annual Demographic Supplement), which is the most consistently cited source of data reporting numbers and characteristics of people with and without health insurance.
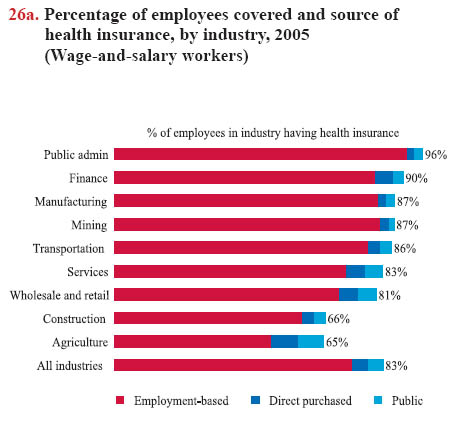
The survey asks people whether they were covered by a private health insurance plan in the last calendar year. If they say "yes," they are then asked, "Was this health insurance plan in your own name?" and "Was this health insurance plan offered through your current or former employer or union?" Respondents are also asked about health insurance coverage from public sources, such as Medicare, Medicaid, TRICARE (formally known as CHAMPUS; military health care program for active duty and retired members of the uniformed services, their families, and survivors), and CHAMPVA (medical program through which the Department of Veterans Affairs helps pay the cost of medical services for eligible veterans, veteran's dependents, and survivors of veterans).Overall, the proportion of construction workers covered by health insurance to workers in other industries is relatively low, whether insurance is provided by the employer or any other source (chart 26a). In 2005, just 58% of construction wage-and-salary workers had employment-based health insurance, 4% purchased health insurance themselves or received it from a family member, and another 3% had health insurance from public sources. Among self-employed workers in 2005, 64% were covered by health insurance from a personal plan, a family member or other sources, such as public coverage.
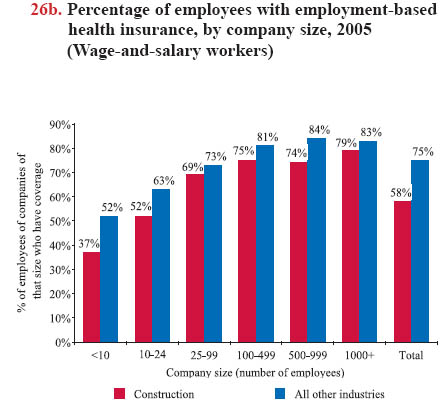
Several factors contribute to the relatively low number of construction workers with insurance coverage. One is the prevalence of small companies in the industry. Companies having 25 or more employees are more likely to provide health insurance, on average, than smaller companies (chart 26b), and about 40% of construction employees work in establishments having fewer than 20 employees (see chart book page 3).
Another contributing factor is that Hispanics, who make up a significant portion of the construction workforce, are less likely to have health insurance coverage than their non-Hispanic counterparts. While 61% of non-Hispanic construction workers have employment-based coverage, just 30% of Hispanic construction workers have coverage through their employment – and 26% of construction wage-and-salary workers are Hispanic, compared with 14% in all industries (see chart book page 15).
The seasonality of construction work in many parts of the United States also may contribute to the relatively low coverage. Industries having a higher proportion of seasonal employment, such as construction and agriculture, provide less access to insurance. For example, employment-based health insurance is rare for part-time and seasonal work. Among part-time construction workers, only 37% received health insurance from their employment.
Generally, the construction industry has increased its reliance on contingent and alternative employees (see chart book page 21), and these workers have a much lower rate of health insurance coverage than most wage-and-salary workers. Generally, racial minorities are less likely to have health insurance, and this trend prevails in construction. Among production workers, 46% of minorities, compared with 50% of nonminority workers, have insurance through their employment. Although women in general are less likely to receive employment- based insurance, 73% of women who are wage-and-salary workers in construction have health insurance coverage through their employment, while 57% of men do.
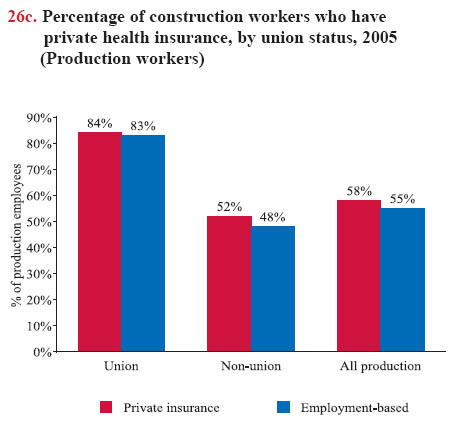
Union production (blue-collar) construction workers are much more likely to have employment-based health insurance than non-union workers, who are more likely to buy their own or be uninsured (chart 26c). A similar pattern prevails for production workers in all industries combined, where 88% of union members obtain health insurance through their employment, compared with 65% of non-union workers. Non-union workers in construction are even less likely to have health insurance coverage than non-union workers in other industries. Some characteristics of construction, such as smaller companies and seasonal employment as described above, may partly explain the difference.
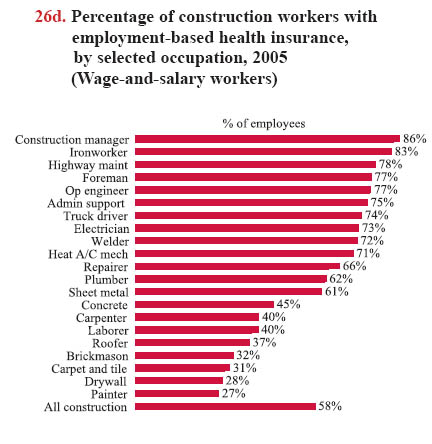
Health insurance coverage varies also by construction occupation, in part because of different trends in average firm size, unionization rates, and independent contracting practices among occupations (chart 26d). Union construction workers are covered by multiemployer health and welfare plans, which are negotiated during collective bargaining with contractors. All contractors that have signed the agreement pay into a fund managed jointly by employer and union representatives, enabling small enterprises to provide benefits for workers.
Download MS PowerPoint versions of Charts
1. All numbers cited in the text: U.S. Census Bureau and U.S. Bureau of Labor Statistics, 2006 Current Population Survey (CPS) Annual Social and Economic Supplement. Calculations by CPWR Data Center.
2. U.S. Census Bureau, Housing and Household Economic Statistics Division, Historic Health Insurance, http://www.census.gov/hhes/www/hlthins/historic/index.html (Accessed November 2007).
Note:
Chart 26c - Production workers are all workers, except managerial, professional, and administrative support staff – and include the self-employed.
Chart 26d - Sample sizes > 30, except Ironworker (21).
Source:
All charts - U.S. Census Bureau and U.S. Bureau of Labor Statistics, 2006 Current Population Survey (CPS) Annual Social and Economic Supplement. Calculations by CPWR Data Center.
Back to Table of Contents